Armenian vs Immigrants from Colombia Hearing Disability
COMPARE
Armenian
Immigrants from Colombia
Hearing Disability
Hearing Disability Comparison
Armenians
Immigrants from Colombia
3.0%
HEARING DISABILITY
56.0/ 100
METRIC RATING
172nd/ 347
METRIC RANK
2.7%
HEARING DISABILITY
98.4/ 100
METRIC RATING
62nd/ 347
METRIC RANK
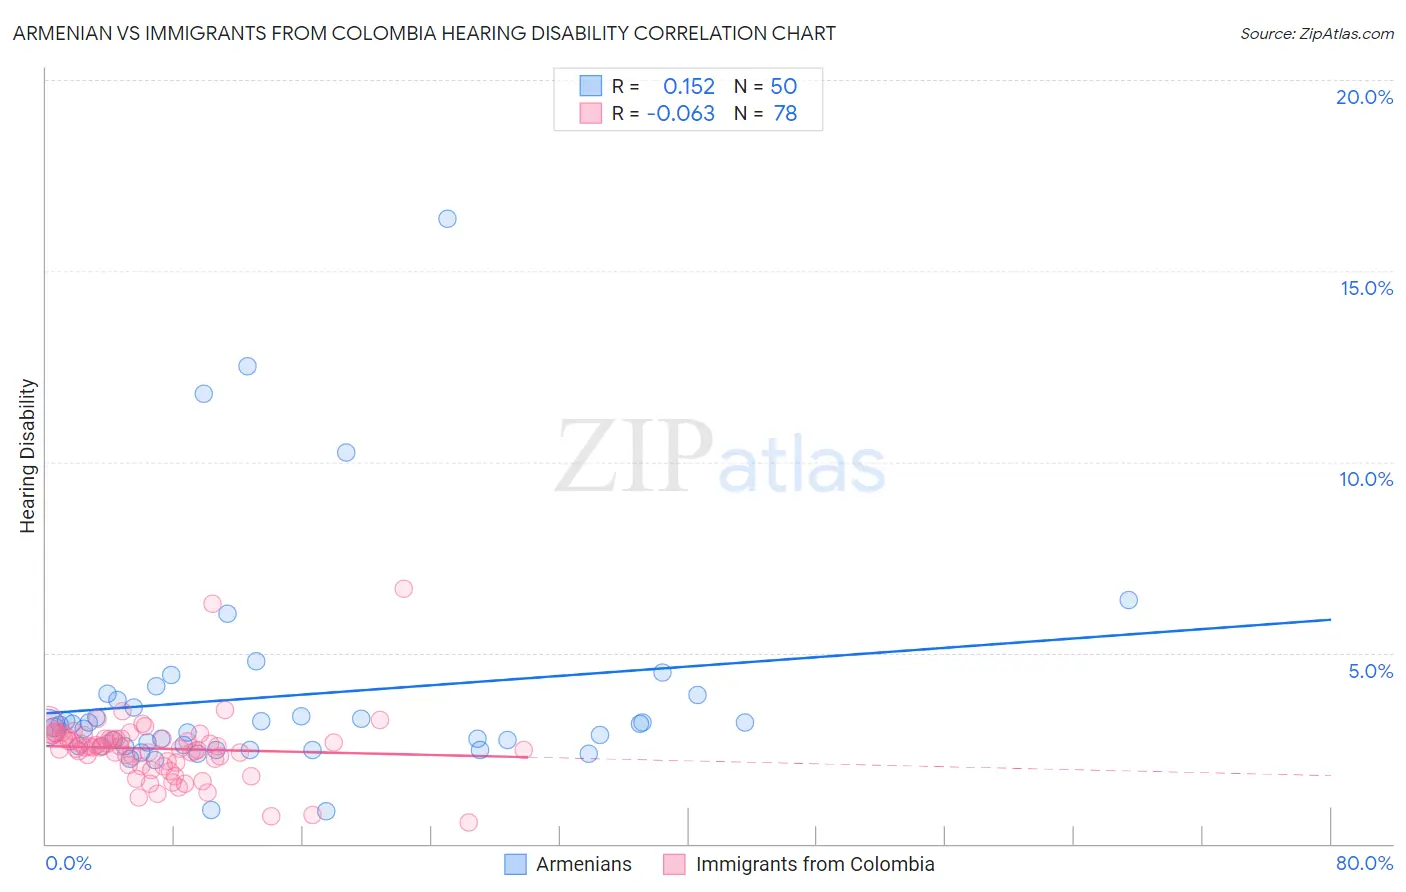
Armenian vs Immigrants from Colombia Hearing Disability Correlation Chart
The statistical analysis conducted on geographies consisting of 310,889,694 people shows a poor positive correlation between the proportion of Armenians and percentage of population with hearing disability in the United States with a correlation coefficient (R) of 0.152 and weighted average of 3.0%. Similarly, the statistical analysis conducted on geographies consisting of 378,548,694 people shows a slight negative correlation between the proportion of Immigrants from Colombia and percentage of population with hearing disability in the United States with a correlation coefficient (R) of -0.063 and weighted average of 2.7%, a difference of 10.1%.
Hearing Disability Correlation Summary
| Measurement | Armenian | Immigrants from Colombia |
| Minimum | 0.86% | 0.57% |
| Maximum | 16.4% | 6.7% |
| Range | 15.5% | 6.1% |
| Mean | 3.9% | 2.5% |
| Median | 3.1% | 2.5% |
| Interquartile 25% (IQ1) | 2.6% | 2.1% |
| Interquartile 75% (IQ3) | 3.8% | 2.8% |
| Interquartile Range (IQR) | 1.2% | 0.62% |
| Standard Deviation (Sample) | 2.9% | 0.89% |
| Standard Deviation (Population) | 2.9% | 0.88% |
Similar Demographics by Hearing Disability
Demographics Similar to Armenians by Hearing Disability
In terms of hearing disability, the demographic groups most similar to Armenians are Immigrants from Ukraine (3.0%, a difference of 0.060%), Immigrants from Cabo Verde (3.0%, a difference of 0.090%), Arab (3.0%, a difference of 0.15%), Immigrants from Greece (3.0%, a difference of 0.18%), and Immigrants from Eastern Europe (3.0%, a difference of 0.20%).
| Demographics | Rating | Rank | Hearing Disability |
| Immigrants | Zimbabwe | 64.2 /100 | #165 | Good 3.0% |
| Immigrants | South Eastern Asia | 62.9 /100 | #166 | Good 3.0% |
| Immigrants | Eastern Europe | 58.1 /100 | #167 | Average 3.0% |
| Immigrants | Greece | 57.9 /100 | #168 | Average 3.0% |
| Arabs | 57.6 /100 | #169 | Average 3.0% |
| Immigrants | Cabo Verde | 56.9 /100 | #170 | Average 3.0% |
| Immigrants | Ukraine | 56.6 /100 | #171 | Average 3.0% |
| Armenians | 56.0 /100 | #172 | Average 3.0% |
| Immigrants | Serbia | 51.1 /100 | #173 | Average 3.0% |
| Indonesians | 50.0 /100 | #174 | Average 3.0% |
| Immigrants | Romania | 48.4 /100 | #175 | Average 3.0% |
| Panamanians | 47.0 /100 | #176 | Average 3.0% |
| Immigrants | Philippines | 46.4 /100 | #177 | Average 3.0% |
| Japanese | 46.0 /100 | #178 | Average 3.0% |
| Immigrants | Moldova | 43.1 /100 | #179 | Average 3.0% |
Demographics Similar to Immigrants from Colombia by Hearing Disability
In terms of hearing disability, the demographic groups most similar to Immigrants from Colombia are Immigrants from Uzbekistan (2.7%, a difference of 0.0%), Indian (Asian) (2.7%, a difference of 0.050%), Immigrants from Sri Lanka (2.7%, a difference of 0.11%), Immigrants from Egypt (2.7%, a difference of 0.14%), and Immigrants from Nepal (2.7%, a difference of 0.19%).
| Demographics | Rating | Rank | Hearing Disability |
| Immigrants | Ethiopia | 99.0 /100 | #55 | Exceptional 2.7% |
| Immigrants | Nicaragua | 99.0 /100 | #56 | Exceptional 2.7% |
| South Americans | 99.0 /100 | #57 | Exceptional 2.7% |
| Immigrants | Peru | 98.6 /100 | #58 | Exceptional 2.7% |
| Immigrants | Eritrea | 98.5 /100 | #59 | Exceptional 2.7% |
| Immigrants | Egypt | 98.5 /100 | #60 | Exceptional 2.7% |
| Immigrants | Uzbekistan | 98.4 /100 | #61 | Exceptional 2.7% |
| Immigrants | Colombia | 98.4 /100 | #62 | Exceptional 2.7% |
| Indians (Asian) | 98.4 /100 | #63 | Exceptional 2.7% |
| Immigrants | Sri Lanka | 98.4 /100 | #64 | Exceptional 2.7% |
| Immigrants | Nepal | 98.3 /100 | #65 | Exceptional 2.7% |
| Immigrants | Belize | 98.2 /100 | #66 | Exceptional 2.7% |
| Egyptians | 98.1 /100 | #67 | Exceptional 2.7% |
| Immigrants | Africa | 98.0 /100 | #68 | Exceptional 2.7% |
| Nicaraguans | 97.9 /100 | #69 | Exceptional 2.7% |