Armenian vs Immigrants from Austria Householder Income Ages 25 - 44 years
COMPARE
Armenian
Immigrants from Austria
Householder Income Ages 25 - 44 years
Householder Income Ages 25 - 44 years Comparison
Armenians
Immigrants from Austria
$103,248
HOUSEHOLDER INCOME AGES 25 - 44 YEARS
99.2/ 100
METRIC RATING
79th/ 347
METRIC RANK
$106,103
HOUSEHOLDER INCOME AGES 25 - 44 YEARS
99.8/ 100
METRIC RATING
57th/ 347
METRIC RANK
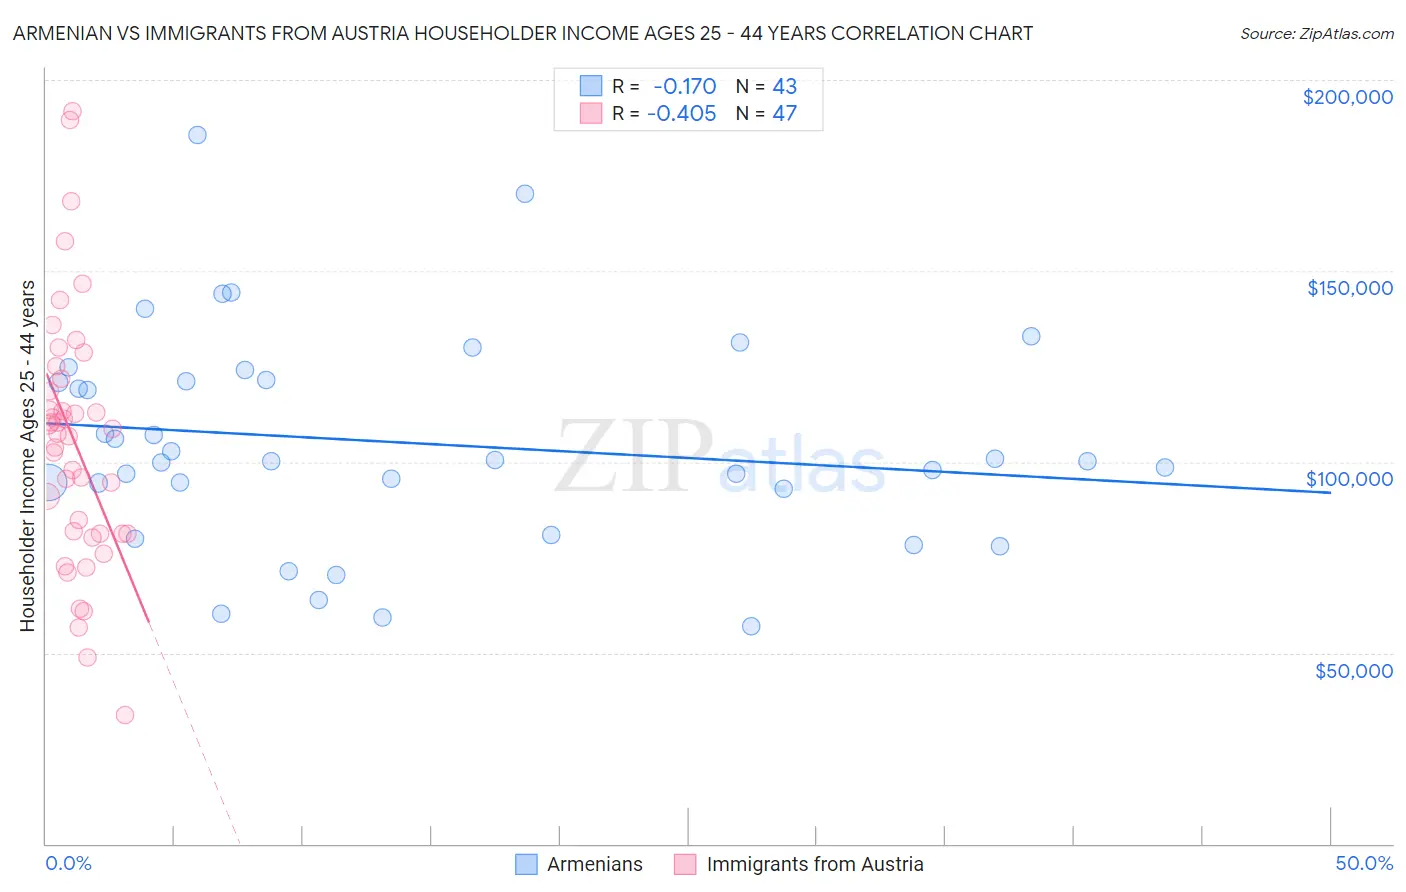
Armenian vs Immigrants from Austria Householder Income Ages 25 - 44 years Correlation Chart
The statistical analysis conducted on geographies consisting of 310,247,429 people shows a poor negative correlation between the proportion of Armenians and household income with householder between the ages 25 and 44 in the United States with a correlation coefficient (R) of -0.170 and weighted average of $103,248. Similarly, the statistical analysis conducted on geographies consisting of 167,639,704 people shows a moderate negative correlation between the proportion of Immigrants from Austria and household income with householder between the ages 25 and 44 in the United States with a correlation coefficient (R) of -0.405 and weighted average of $106,103, a difference of 2.8%.
Householder Income Ages 25 - 44 years Correlation Summary
| Measurement | Armenian | Immigrants from Austria |
| Minimum | $56,917 | $33,571 |
| Maximum | $185,535 | $191,842 |
| Range | $128,618 | $158,271 |
| Mean | $105,016 | $105,149 |
| Median | $100,154 | $107,519 |
| Interquartile 25% (IQ1) | $92,917 | $81,250 |
| Interquartile 75% (IQ3) | $121,535 | $121,802 |
| Interquartile Range (IQR) | $28,618 | $40,552 |
| Standard Deviation (Sample) | $28,063 | $33,347 |
| Standard Deviation (Population) | $27,735 | $32,991 |
Similar Demographics by Householder Income Ages 25 - 44 years
Demographics Similar to Armenians by Householder Income Ages 25 - 44 years
In terms of householder income ages 25 - 44 years, the demographic groups most similar to Armenians are Immigrants from Egypt ($103,192, a difference of 0.050%), South African ($103,160, a difference of 0.080%), Immigrants from Serbia ($103,155, a difference of 0.090%), Argentinean ($103,111, a difference of 0.13%), and Immigrants from Bulgaria ($103,423, a difference of 0.17%).
| Demographics | Rating | Rank | Householder Income Ages 25 - 44 years |
| Chinese | 99.5 /100 | #72 | Exceptional $104,264 |
| Italians | 99.5 /100 | #73 | Exceptional $104,215 |
| Immigrants | Fiji | 99.5 /100 | #74 | Exceptional $103,954 |
| Koreans | 99.4 /100 | #75 | Exceptional $103,824 |
| Immigrants | Spain | 99.4 /100 | #76 | Exceptional $103,752 |
| Immigrants | Southern Europe | 99.3 /100 | #77 | Exceptional $103,486 |
| Immigrants | Bulgaria | 99.3 /100 | #78 | Exceptional $103,423 |
| Armenians | 99.2 /100 | #79 | Exceptional $103,248 |
| Immigrants | Egypt | 99.2 /100 | #80 | Exceptional $103,192 |
| South Africans | 99.2 /100 | #81 | Exceptional $103,160 |
| Immigrants | Serbia | 99.2 /100 | #82 | Exceptional $103,155 |
| Argentineans | 99.1 /100 | #83 | Exceptional $103,111 |
| Immigrants | Philippines | 99.0 /100 | #84 | Exceptional $102,910 |
| Immigrants | Ukraine | 98.9 /100 | #85 | Exceptional $102,664 |
| Immigrants | Hungary | 98.9 /100 | #86 | Exceptional $102,655 |
Demographics Similar to Immigrants from Austria by Householder Income Ages 25 - 44 years
In terms of householder income ages 25 - 44 years, the demographic groups most similar to Immigrants from Austria are Immigrants from Pakistan ($106,129, a difference of 0.030%), Greek ($106,457, a difference of 0.33%), Immigrants from South Africa ($105,748, a difference of 0.34%), Paraguayan ($106,615, a difference of 0.48%), and Immigrants from Norway ($106,629, a difference of 0.50%).
| Demographics | Rating | Rank | Householder Income Ages 25 - 44 years |
| Cambodians | 99.9 /100 | #50 | Exceptional $107,148 |
| Immigrants | Czechoslovakia | 99.9 /100 | #51 | Exceptional $106,888 |
| Immigrants | Europe | 99.9 /100 | #52 | Exceptional $106,817 |
| Immigrants | Norway | 99.9 /100 | #53 | Exceptional $106,629 |
| Paraguayans | 99.9 /100 | #54 | Exceptional $106,615 |
| Greeks | 99.9 /100 | #55 | Exceptional $106,457 |
| Immigrants | Pakistan | 99.8 /100 | #56 | Exceptional $106,129 |
| Immigrants | Austria | 99.8 /100 | #57 | Exceptional $106,103 |
| Immigrants | South Africa | 99.8 /100 | #58 | Exceptional $105,748 |
| Immigrants | Latvia | 99.8 /100 | #59 | Exceptional $105,522 |
| Egyptians | 99.7 /100 | #60 | Exceptional $105,282 |
| Lithuanians | 99.7 /100 | #61 | Exceptional $105,223 |
| Immigrants | Italy | 99.7 /100 | #62 | Exceptional $105,201 |
| Immigrants | Scotland | 99.7 /100 | #63 | Exceptional $105,089 |
| New Zealanders | 99.7 /100 | #64 | Exceptional $105,085 |