Ghanaian vs Immigrants from Senegal Ambulatory Disability
COMPARE
Ghanaian
Immigrants from Senegal
Ambulatory Disability
Ambulatory Disability Comparison
Ghanaians
Immigrants from Senegal
6.0%
AMBULATORY DISABILITY
71.3/ 100
METRIC RATING
157th/ 347
METRIC RANK
6.4%
AMBULATORY DISABILITY
1.7/ 100
METRIC RATING
240th/ 347
METRIC RANK
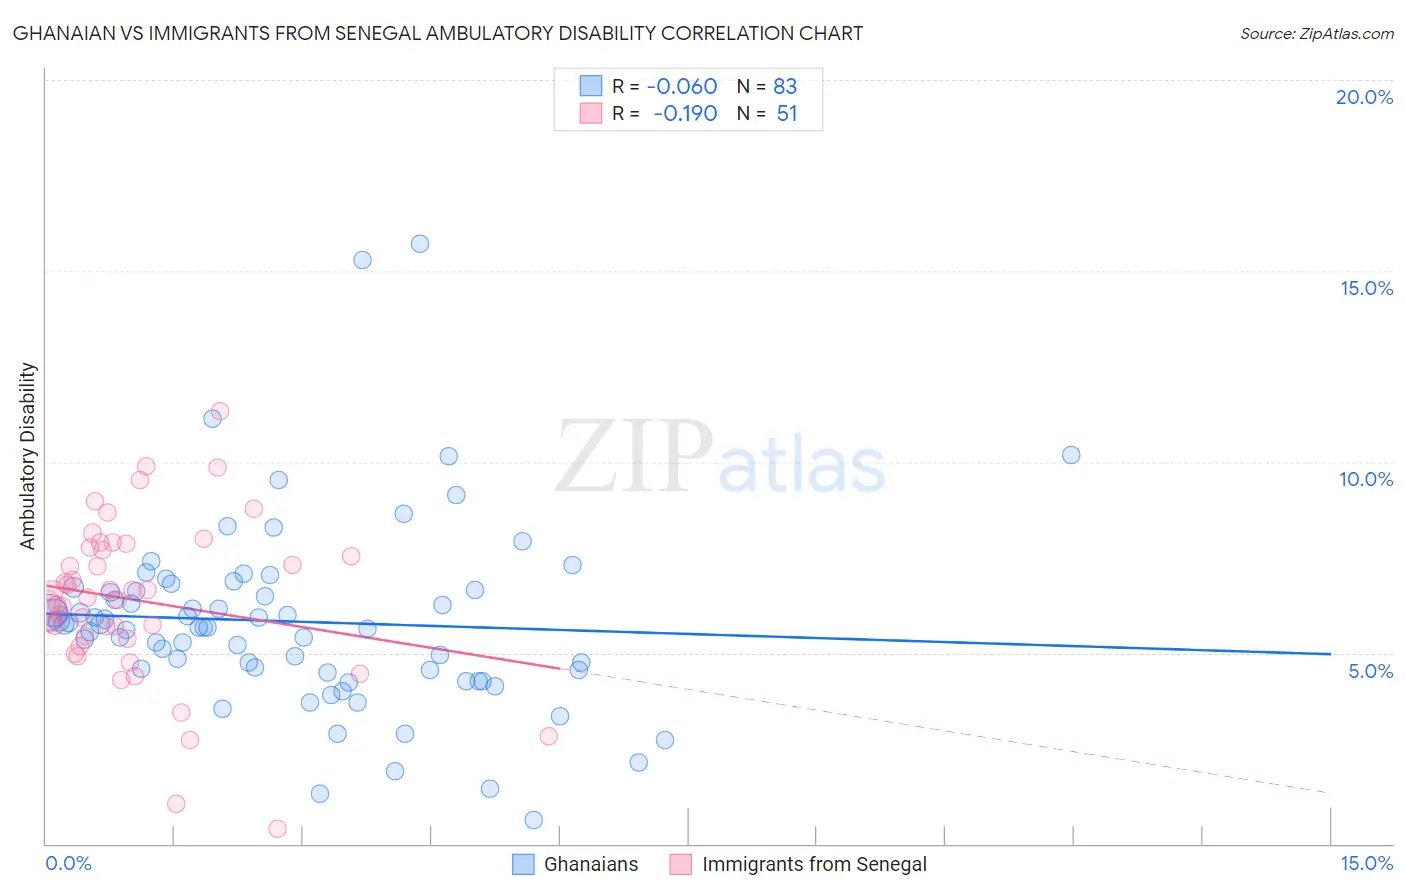
Ghanaian vs Immigrants from Senegal Ambulatory Disability Correlation Chart
The statistical analysis conducted on geographies consisting of 190,643,390 people shows a slight negative correlation between the proportion of Ghanaians and percentage of population with ambulatory disability in the United States with a correlation coefficient (R) of -0.060 and weighted average of 6.0%. Similarly, the statistical analysis conducted on geographies consisting of 90,127,972 people shows a poor negative correlation between the proportion of Immigrants from Senegal and percentage of population with ambulatory disability in the United States with a correlation coefficient (R) of -0.190 and weighted average of 6.4%, a difference of 6.7%.
Ambulatory Disability Correlation Summary
| Measurement | Ghanaian | Immigrants from Senegal |
| Minimum | 0.61% | 0.40% |
| Maximum | 15.7% | 11.3% |
| Range | 15.1% | 10.9% |
| Mean | 5.8% | 6.4% |
| Median | 5.7% | 6.4% |
| Interquartile 25% (IQ1) | 4.5% | 5.4% |
| Interquartile 75% (IQ3) | 6.6% | 7.7% |
| Interquartile Range (IQR) | 2.1% | 2.4% |
| Standard Deviation (Sample) | 2.5% | 2.1% |
| Standard Deviation (Population) | 2.4% | 2.1% |
Similar Demographics by Ambulatory Disability
Demographics Similar to Ghanaians by Ambulatory Disability
In terms of ambulatory disability, the demographic groups most similar to Ghanaians are Immigrants from Fiji (6.0%, a difference of 0.010%), Immigrants from Latvia (6.0%, a difference of 0.020%), Northern European (6.0%, a difference of 0.030%), Immigrants from Scotland (6.0%, a difference of 0.050%), and Central American (6.0%, a difference of 0.10%).
| Demographics | Rating | Rank | Ambulatory Disability |
| Maltese | 81.6 /100 | #150 | Excellent 6.0% |
| Greeks | 79.6 /100 | #151 | Good 6.0% |
| Immigrants | Austria | 78.8 /100 | #152 | Good 6.0% |
| Syrians | 75.5 /100 | #153 | Good 6.0% |
| Immigrants | Croatia | 75.1 /100 | #154 | Good 6.0% |
| Immigrants | Scotland | 72.1 /100 | #155 | Good 6.0% |
| Northern Europeans | 71.8 /100 | #156 | Good 6.0% |
| Ghanaians | 71.3 /100 | #157 | Good 6.0% |
| Immigrants | Fiji | 71.2 /100 | #158 | Good 6.0% |
| Immigrants | Latvia | 71.1 /100 | #159 | Good 6.0% |
| Central Americans | 69.8 /100 | #160 | Good 6.0% |
| Immigrants | Belarus | 69.2 /100 | #161 | Good 6.1% |
| Nigerians | 67.1 /100 | #162 | Good 6.1% |
| Lebanese | 66.2 /100 | #163 | Good 6.1% |
| Basques | 63.7 /100 | #164 | Good 6.1% |
Demographics Similar to Immigrants from Senegal by Ambulatory Disability
In terms of ambulatory disability, the demographic groups most similar to Immigrants from Senegal are Senegalese (6.4%, a difference of 0.030%), Immigrants from Haiti (6.5%, a difference of 0.080%), Haitian (6.4%, a difference of 0.090%), Immigrants from Germany (6.4%, a difference of 0.10%), and Spaniard (6.5%, a difference of 0.11%).
| Demographics | Rating | Rank | Ambulatory Disability |
| Sub-Saharan Africans | 2.3 /100 | #233 | Tragic 6.4% |
| Immigrants | Liberia | 2.3 /100 | #234 | Tragic 6.4% |
| Hispanics or Latinos | 2.2 /100 | #235 | Tragic 6.4% |
| Dutch | 2.0 /100 | #236 | Tragic 6.4% |
| Immigrants | Germany | 1.8 /100 | #237 | Tragic 6.4% |
| Haitians | 1.8 /100 | #238 | Tragic 6.4% |
| Senegalese | 1.7 /100 | #239 | Tragic 6.4% |
| Immigrants | Senegal | 1.7 /100 | #240 | Tragic 6.4% |
| Immigrants | Haiti | 1.6 /100 | #241 | Tragic 6.5% |
| Spaniards | 1.6 /100 | #242 | Tragic 6.5% |
| Germans | 1.5 /100 | #243 | Tragic 6.5% |
| Immigrants | Panama | 1.5 /100 | #244 | Tragic 6.5% |
| Tlingit-Haida | 1.5 /100 | #245 | Tragic 6.5% |
| Armenians | 1.5 /100 | #246 | Tragic 6.5% |
| Immigrants | Cuba | 1.4 /100 | #247 | Tragic 6.5% |