Immigrants from Uzbekistan vs Immigrants from Senegal Ambulatory Disability
COMPARE
Immigrants from Uzbekistan
Immigrants from Senegal
Ambulatory Disability
Ambulatory Disability Comparison
Immigrants from Uzbekistan
Immigrants from Senegal
6.5%
AMBULATORY DISABILITY
0.6/ 100
METRIC RATING
256th/ 347
METRIC RANK
6.4%
AMBULATORY DISABILITY
1.7/ 100
METRIC RATING
240th/ 347
METRIC RANK
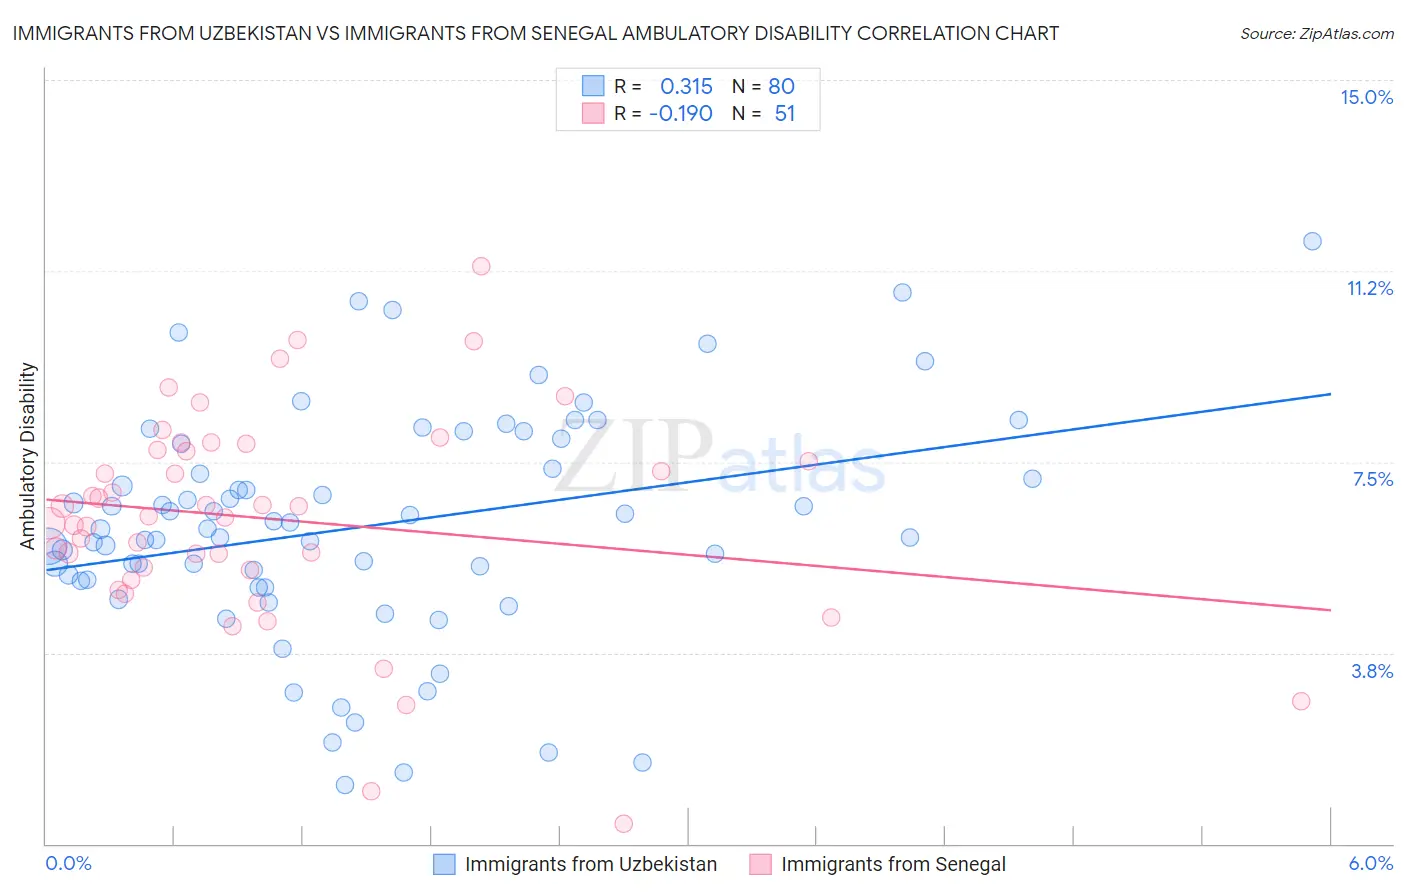
Immigrants from Uzbekistan vs Immigrants from Senegal Ambulatory Disability Correlation Chart
The statistical analysis conducted on geographies consisting of 118,661,431 people shows a mild positive correlation between the proportion of Immigrants from Uzbekistan and percentage of population with ambulatory disability in the United States with a correlation coefficient (R) of 0.315 and weighted average of 6.5%. Similarly, the statistical analysis conducted on geographies consisting of 90,127,972 people shows a poor negative correlation between the proportion of Immigrants from Senegal and percentage of population with ambulatory disability in the United States with a correlation coefficient (R) of -0.190 and weighted average of 6.4%, a difference of 1.4%.
Ambulatory Disability Correlation Summary
| Measurement | Immigrants from Uzbekistan | Immigrants from Senegal |
| Minimum | 1.2% | 0.40% |
| Maximum | 11.8% | 11.3% |
| Range | 10.7% | 10.9% |
| Mean | 6.2% | 6.4% |
| Median | 6.2% | 6.4% |
| Interquartile 25% (IQ1) | 5.2% | 5.4% |
| Interquartile 75% (IQ3) | 7.6% | 7.7% |
| Interquartile Range (IQR) | 2.4% | 2.4% |
| Standard Deviation (Sample) | 2.2% | 2.1% |
| Standard Deviation (Population) | 2.2% | 2.1% |
Demographics Similar to Immigrants from Uzbekistan and Immigrants from Senegal by Ambulatory Disability
In terms of ambulatory disability, the demographic groups most similar to Immigrants from Uzbekistan are Welsh (6.5%, a difference of 0.080%), Bermudan (6.5%, a difference of 0.080%), Belizean (6.5%, a difference of 0.15%), Spanish American Indian (6.5%, a difference of 0.16%), and Scottish (6.5%, a difference of 0.30%). Similarly, the demographic groups most similar to Immigrants from Senegal are Senegalese (6.4%, a difference of 0.030%), Immigrants from Haiti (6.5%, a difference of 0.080%), Haitian (6.4%, a difference of 0.090%), Spaniard (6.5%, a difference of 0.11%), and German (6.5%, a difference of 0.13%).
| Demographics | Rating | Rank | Ambulatory Disability |
| Haitians | 1.8 /100 | #238 | Tragic 6.4% |
| Senegalese | 1.7 /100 | #239 | Tragic 6.4% |
| Immigrants | Senegal | 1.7 /100 | #240 | Tragic 6.4% |
| Immigrants | Haiti | 1.6 /100 | #241 | Tragic 6.5% |
| Spaniards | 1.6 /100 | #242 | Tragic 6.5% |
| Germans | 1.5 /100 | #243 | Tragic 6.5% |
| Immigrants | Panama | 1.5 /100 | #244 | Tragic 6.5% |
| Tlingit-Haida | 1.5 /100 | #245 | Tragic 6.5% |
| Armenians | 1.5 /100 | #246 | Tragic 6.5% |
| Immigrants | Cuba | 1.4 /100 | #247 | Tragic 6.5% |
| Immigrants | Portugal | 1.4 /100 | #248 | Tragic 6.5% |
| Native Hawaiians | 1.1 /100 | #249 | Tragic 6.5% |
| Chinese | 1.0 /100 | #250 | Tragic 6.5% |
| Hawaiians | 0.9 /100 | #251 | Tragic 6.5% |
| Immigrants | Bahamas | 0.8 /100 | #252 | Tragic 6.5% |
| Scottish | 0.7 /100 | #253 | Tragic 6.5% |
| Belizeans | 0.7 /100 | #254 | Tragic 6.5% |
| Welsh | 0.6 /100 | #255 | Tragic 6.5% |
| Immigrants | Uzbekistan | 0.6 /100 | #256 | Tragic 6.5% |
| Bermudans | 0.5 /100 | #257 | Tragic 6.5% |
| Spanish American Indians | 0.5 /100 | #258 | Tragic 6.5% |