Arapaho vs Nicaraguan Disability Age 5 to 17
COMPARE
Arapaho
Nicaraguan
Disability Age 5 to 17
Disability Age 5 to 17 Comparison
Arapaho
Nicaraguans
4.7%
DISABILITY AGE 5 TO 17
100.0/ 100
METRIC RATING
17th/ 347
METRIC RANK
5.3%
DISABILITY AGE 5 TO 17
98.6/ 100
METRIC RATING
102nd/ 347
METRIC RANK
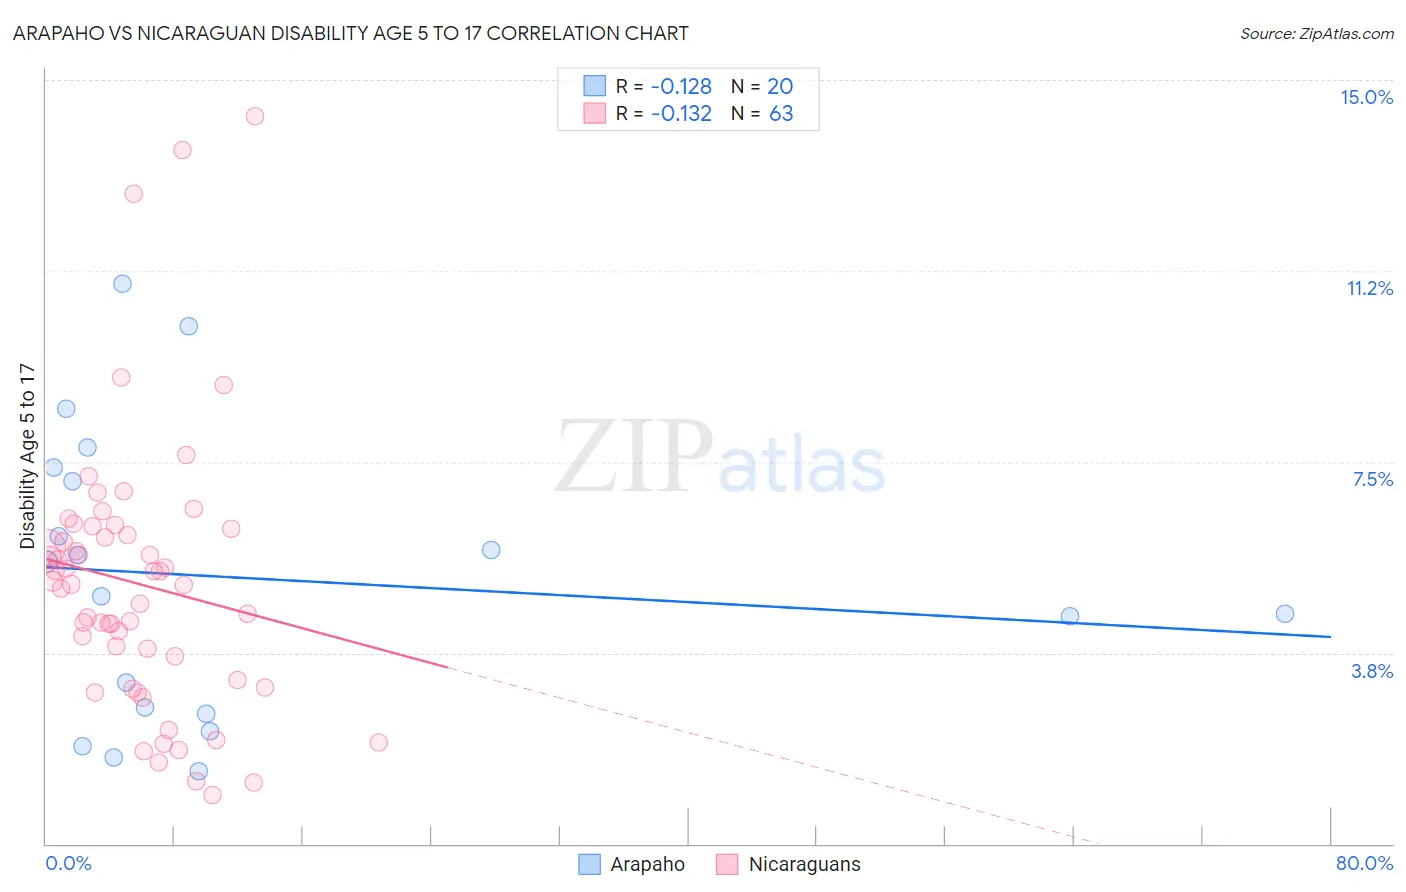
Arapaho vs Nicaraguan Disability Age 5 to 17 Correlation Chart
The statistical analysis conducted on geographies consisting of 29,737,383 people shows a poor negative correlation between the proportion of Arapaho and percentage of population with a disability between the ages 5 and 17 in the United States with a correlation coefficient (R) of -0.128 and weighted average of 4.7%. Similarly, the statistical analysis conducted on geographies consisting of 284,558,915 people shows a poor negative correlation between the proportion of Nicaraguans and percentage of population with a disability between the ages 5 and 17 in the United States with a correlation coefficient (R) of -0.132 and weighted average of 5.3%, a difference of 12.0%.
Disability Age 5 to 17 Correlation Summary
| Measurement | Arapaho | Nicaraguan |
| Minimum | 1.4% | 0.96% |
| Maximum | 11.0% | 14.3% |
| Range | 9.6% | 13.3% |
| Mean | 5.2% | 5.1% |
| Median | 5.2% | 5.1% |
| Interquartile 25% (IQ1) | 2.6% | 3.2% |
| Interquartile 75% (IQ3) | 7.3% | 6.2% |
| Interquartile Range (IQR) | 4.6% | 3.0% |
| Standard Deviation (Sample) | 2.8% | 2.7% |
| Standard Deviation (Population) | 2.7% | 2.6% |
Similar Demographics by Disability Age 5 to 17
Demographics Similar to Arapaho by Disability Age 5 to 17
In terms of disability age 5 to 17, the demographic groups most similar to Arapaho are Immigrants from South Central Asia (4.7%, a difference of 0.020%), Immigrants from Singapore (4.7%, a difference of 0.46%), Immigrants from Uzbekistan (4.8%, a difference of 0.51%), Chinese (4.7%, a difference of 0.88%), and Burmese (4.8%, a difference of 0.89%).
| Demographics | Rating | Rank | Disability Age 5 to 17 |
| Immigrants | India | 100.0 /100 | #10 | Exceptional 4.6% |
| Armenians | 100.0 /100 | #11 | Exceptional 4.6% |
| Iranians | 100.0 /100 | #12 | Exceptional 4.6% |
| Thais | 100.0 /100 | #13 | Exceptional 4.7% |
| Immigrants | Korea | 100.0 /100 | #14 | Exceptional 4.7% |
| Chinese | 100.0 /100 | #15 | Exceptional 4.7% |
| Immigrants | Singapore | 100.0 /100 | #16 | Exceptional 4.7% |
| Arapaho | 100.0 /100 | #17 | Exceptional 4.7% |
| Immigrants | South Central Asia | 100.0 /100 | #18 | Exceptional 4.7% |
| Immigrants | Uzbekistan | 100.0 /100 | #19 | Exceptional 4.8% |
| Burmese | 100.0 /100 | #20 | Exceptional 4.8% |
| Yup'ik | 100.0 /100 | #21 | Exceptional 4.8% |
| Asians | 100.0 /100 | #22 | Exceptional 4.8% |
| Immigrants | Bolivia | 100.0 /100 | #23 | Exceptional 4.8% |
| Immigrants | Lebanon | 100.0 /100 | #24 | Exceptional 4.8% |
Demographics Similar to Nicaraguans by Disability Age 5 to 17
In terms of disability age 5 to 17, the demographic groups most similar to Nicaraguans are Salvadoran (5.3%, a difference of 0.030%), Menominee (5.3%, a difference of 0.080%), Nepalese (5.3%, a difference of 0.10%), Peruvian (5.3%, a difference of 0.10%), and Immigrants from Italy (5.3%, a difference of 0.19%).
| Demographics | Rating | Rank | Disability Age 5 to 17 |
| Immigrants | Grenada | 99.1 /100 | #95 | Exceptional 5.3% |
| Immigrants | El Salvador | 99.0 /100 | #96 | Exceptional 5.3% |
| Immigrants | Europe | 99.0 /100 | #97 | Exceptional 5.3% |
| Immigrants | Austria | 98.9 /100 | #98 | Exceptional 5.3% |
| Cambodians | 98.8 /100 | #99 | Exceptional 5.3% |
| Nepalese | 98.7 /100 | #100 | Exceptional 5.3% |
| Menominee | 98.7 /100 | #101 | Exceptional 5.3% |
| Nicaraguans | 98.6 /100 | #102 | Exceptional 5.3% |
| Salvadorans | 98.6 /100 | #103 | Exceptional 5.3% |
| Peruvians | 98.5 /100 | #104 | Exceptional 5.3% |
| Immigrants | Italy | 98.4 /100 | #105 | Exceptional 5.3% |
| Immigrants | Yemen | 98.2 /100 | #106 | Exceptional 5.3% |
| Russians | 98.2 /100 | #107 | Exceptional 5.3% |
| Immigrants | South Africa | 98.1 /100 | #108 | Exceptional 5.3% |
| Immigrants | Northern Africa | 98.1 /100 | #109 | Exceptional 5.3% |