Arapaho vs Romanian Cognitive Disability
COMPARE
Arapaho
Romanian
Cognitive Disability
Cognitive Disability Comparison
Arapaho
Romanians
16.8%
COGNITIVE DISABILITY
97.3/ 100
METRIC RATING
110th/ 347
METRIC RANK
16.6%
COGNITIVE DISABILITY
99.7/ 100
METRIC RATING
60th/ 347
METRIC RANK
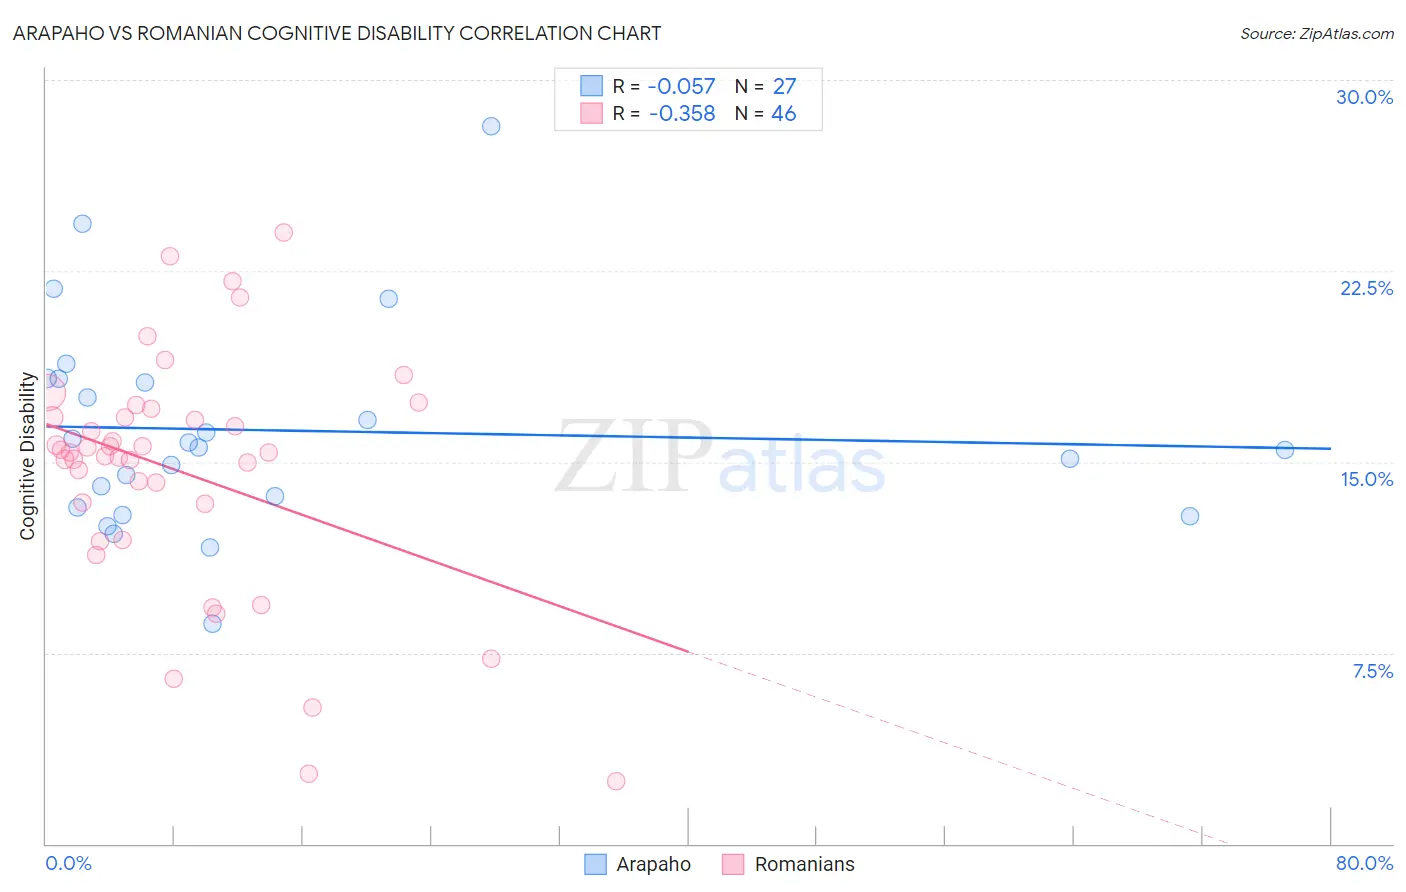
Arapaho vs Romanian Cognitive Disability Correlation Chart
The statistical analysis conducted on geographies consisting of 29,780,325 people shows a slight negative correlation between the proportion of Arapaho and percentage of population with cognitive disability in the United States with a correlation coefficient (R) of -0.057 and weighted average of 16.8%. Similarly, the statistical analysis conducted on geographies consisting of 377,876,642 people shows a mild negative correlation between the proportion of Romanians and percentage of population with cognitive disability in the United States with a correlation coefficient (R) of -0.358 and weighted average of 16.6%, a difference of 1.6%.
Cognitive Disability Correlation Summary
| Measurement | Arapaho | Romanian |
| Minimum | 8.6% | 2.4% |
| Maximum | 28.2% | 24.0% |
| Range | 19.5% | 21.6% |
| Mean | 16.2% | 14.6% |
| Median | 15.6% | 15.4% |
| Interquartile 25% (IQ1) | 13.2% | 13.3% |
| Interquartile 75% (IQ3) | 18.3% | 16.7% |
| Interquartile Range (IQR) | 5.0% | 3.4% |
| Standard Deviation (Sample) | 4.1% | 4.7% |
| Standard Deviation (Population) | 4.1% | 4.6% |
Similar Demographics by Cognitive Disability
Demographics Similar to Arapaho by Cognitive Disability
In terms of cognitive disability, the demographic groups most similar to Arapaho are Albanian (16.8%, a difference of 0.010%), Uruguayan (16.8%, a difference of 0.010%), Indian (Asian) (16.8%, a difference of 0.040%), Immigrants from Sri Lanka (16.8%, a difference of 0.040%), and Korean (16.8%, a difference of 0.040%).
| Demographics | Rating | Rank | Cognitive Disability |
| Paraguayans | 98.0 /100 | #103 | Exceptional 16.8% |
| Palestinians | 98.0 /100 | #104 | Exceptional 16.8% |
| Immigrants | Eastern Asia | 97.9 /100 | #105 | Exceptional 16.8% |
| Northern Europeans | 97.8 /100 | #106 | Exceptional 16.8% |
| Immigrants | Nicaragua | 97.8 /100 | #107 | Exceptional 16.8% |
| Canadians | 97.5 /100 | #108 | Exceptional 16.8% |
| Albanians | 97.3 /100 | #109 | Exceptional 16.8% |
| Arapaho | 97.3 /100 | #110 | Exceptional 16.8% |
| Uruguayans | 97.2 /100 | #111 | Exceptional 16.8% |
| Indians (Asian) | 97.2 /100 | #112 | Exceptional 16.8% |
| Immigrants | Sri Lanka | 97.1 /100 | #113 | Exceptional 16.8% |
| Koreans | 97.1 /100 | #114 | Exceptional 16.8% |
| Yup'ik | 96.9 /100 | #115 | Exceptional 16.9% |
| Inupiat | 96.5 /100 | #116 | Exceptional 16.9% |
| Immigrants | Japan | 96.2 /100 | #117 | Exceptional 16.9% |
Demographics Similar to Romanians by Cognitive Disability
In terms of cognitive disability, the demographic groups most similar to Romanians are Pennsylvania German (16.6%, a difference of 0.010%), Immigrants from Peru (16.6%, a difference of 0.010%), Immigrants from England (16.6%, a difference of 0.060%), Austrian (16.6%, a difference of 0.090%), and Bhutanese (16.6%, a difference of 0.090%).
| Demographics | Rating | Rank | Cognitive Disability |
| Swedes | 99.8 /100 | #53 | Exceptional 16.5% |
| Immigrants | Iran | 99.8 /100 | #54 | Exceptional 16.5% |
| Immigrants | Venezuela | 99.7 /100 | #55 | Exceptional 16.5% |
| Austrians | 99.7 /100 | #56 | Exceptional 16.6% |
| Bhutanese | 99.7 /100 | #57 | Exceptional 16.6% |
| Pennsylvania Germans | 99.7 /100 | #58 | Exceptional 16.6% |
| Immigrants | Peru | 99.7 /100 | #59 | Exceptional 16.6% |
| Romanians | 99.7 /100 | #60 | Exceptional 16.6% |
| Immigrants | England | 99.6 /100 | #61 | Exceptional 16.6% |
| Czechoslovakians | 99.6 /100 | #62 | Exceptional 16.6% |
| Argentineans | 99.6 /100 | #63 | Exceptional 16.6% |
| Venezuelans | 99.6 /100 | #64 | Exceptional 16.6% |
| Colombians | 99.6 /100 | #65 | Exceptional 16.6% |
| Immigrants | Ukraine | 99.5 /100 | #66 | Exceptional 16.6% |
| Latvians | 99.5 /100 | #67 | Exceptional 16.6% |