Immigrants from Western Africa vs Canadian Cognitive Disability
COMPARE
Immigrants from Western Africa
Canadian
Cognitive Disability
Cognitive Disability Comparison
Immigrants from Western Africa
Canadians
18.4%
COGNITIVE DISABILITY
0.0/ 100
METRIC RATING
308th/ 347
METRIC RANK
16.8%
COGNITIVE DISABILITY
97.5/ 100
METRIC RATING
108th/ 347
METRIC RANK
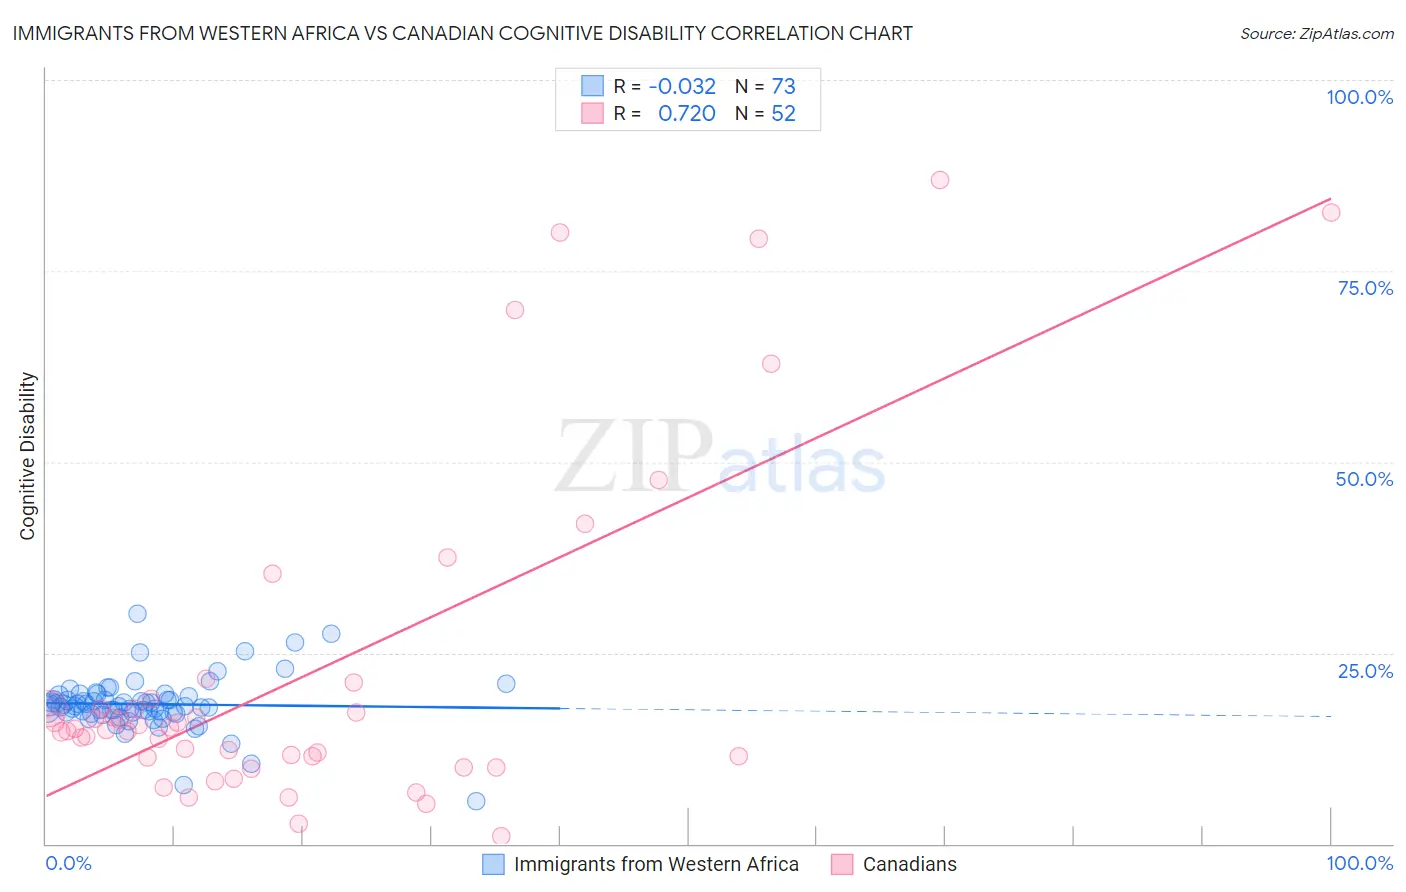
Immigrants from Western Africa vs Canadian Cognitive Disability Correlation Chart
The statistical analysis conducted on geographies consisting of 357,804,343 people shows no correlation between the proportion of Immigrants from Western Africa and percentage of population with cognitive disability in the United States with a correlation coefficient (R) of -0.032 and weighted average of 18.4%. Similarly, the statistical analysis conducted on geographies consisting of 437,506,516 people shows a strong positive correlation between the proportion of Canadians and percentage of population with cognitive disability in the United States with a correlation coefficient (R) of 0.720 and weighted average of 16.8%, a difference of 9.1%.
Cognitive Disability Correlation Summary
| Measurement | Immigrants from Western Africa | Canadian |
| Minimum | 5.5% | 1.0% |
| Maximum | 30.2% | 87.0% |
| Range | 24.6% | 85.9% |
| Mean | 18.3% | 22.4% |
| Median | 17.9% | 15.0% |
| Interquartile 25% (IQ1) | 17.2% | 11.3% |
| Interquartile 75% (IQ3) | 19.5% | 18.4% |
| Interquartile Range (IQR) | 2.3% | 7.1% |
| Standard Deviation (Sample) | 3.6% | 21.9% |
| Standard Deviation (Population) | 3.6% | 21.7% |
Similar Demographics by Cognitive Disability
Demographics Similar to Immigrants from Western Africa by Cognitive Disability
In terms of cognitive disability, the demographic groups most similar to Immigrants from Western Africa are Immigrants from Eastern Africa (18.4%, a difference of 0.040%), Seminole (18.3%, a difference of 0.090%), Ugandan (18.3%, a difference of 0.090%), Colville (18.3%, a difference of 0.10%), and Immigrants from Eritrea (18.3%, a difference of 0.21%).
| Demographics | Rating | Rank | Cognitive Disability |
| Immigrants | Ghana | 0.0 /100 | #301 | Tragic 18.3% |
| Barbadians | 0.0 /100 | #302 | Tragic 18.3% |
| Immigrants | Kenya | 0.0 /100 | #303 | Tragic 18.3% |
| Immigrants | Eritrea | 0.0 /100 | #304 | Tragic 18.3% |
| Colville | 0.0 /100 | #305 | Tragic 18.3% |
| Seminole | 0.0 /100 | #306 | Tragic 18.3% |
| Ugandans | 0.0 /100 | #307 | Tragic 18.3% |
| Immigrants | Western Africa | 0.0 /100 | #308 | Tragic 18.4% |
| Immigrants | Eastern Africa | 0.0 /100 | #309 | Tragic 18.4% |
| Choctaw | 0.0 /100 | #310 | Tragic 18.4% |
| Hmong | 0.0 /100 | #311 | Tragic 18.4% |
| Chickasaw | 0.0 /100 | #312 | Tragic 18.5% |
| Yaqui | 0.0 /100 | #313 | Tragic 18.5% |
| Sub-Saharan Africans | 0.0 /100 | #314 | Tragic 18.5% |
| Immigrants | Dominica | 0.0 /100 | #315 | Tragic 18.6% |
Demographics Similar to Canadians by Cognitive Disability
In terms of cognitive disability, the demographic groups most similar to Canadians are Albanian (16.8%, a difference of 0.050%), Arapaho (16.8%, a difference of 0.060%), Uruguayan (16.8%, a difference of 0.070%), Immigrants from Nicaragua (16.8%, a difference of 0.090%), and Indian (Asian) (16.8%, a difference of 0.090%).
| Demographics | Rating | Rank | Cognitive Disability |
| Immigrants | Asia | 98.1 /100 | #101 | Exceptional 16.8% |
| Irish | 98.1 /100 | #102 | Exceptional 16.8% |
| Paraguayans | 98.0 /100 | #103 | Exceptional 16.8% |
| Palestinians | 98.0 /100 | #104 | Exceptional 16.8% |
| Immigrants | Eastern Asia | 97.9 /100 | #105 | Exceptional 16.8% |
| Northern Europeans | 97.8 /100 | #106 | Exceptional 16.8% |
| Immigrants | Nicaragua | 97.8 /100 | #107 | Exceptional 16.8% |
| Canadians | 97.5 /100 | #108 | Exceptional 16.8% |
| Albanians | 97.3 /100 | #109 | Exceptional 16.8% |
| Arapaho | 97.3 /100 | #110 | Exceptional 16.8% |
| Uruguayans | 97.2 /100 | #111 | Exceptional 16.8% |
| Indians (Asian) | 97.2 /100 | #112 | Exceptional 16.8% |
| Immigrants | Sri Lanka | 97.1 /100 | #113 | Exceptional 16.8% |
| Koreans | 97.1 /100 | #114 | Exceptional 16.8% |
| Yup'ik | 96.9 /100 | #115 | Exceptional 16.9% |