Arapaho vs Burmese Cognitive Disability
COMPARE
Arapaho
Burmese
Cognitive Disability
Cognitive Disability Comparison
Arapaho
Burmese
16.8%
COGNITIVE DISABILITY
97.3/ 100
METRIC RATING
110th/ 347
METRIC RANK
16.7%
COGNITIVE DISABILITY
99.3/ 100
METRIC RATING
73rd/ 347
METRIC RANK
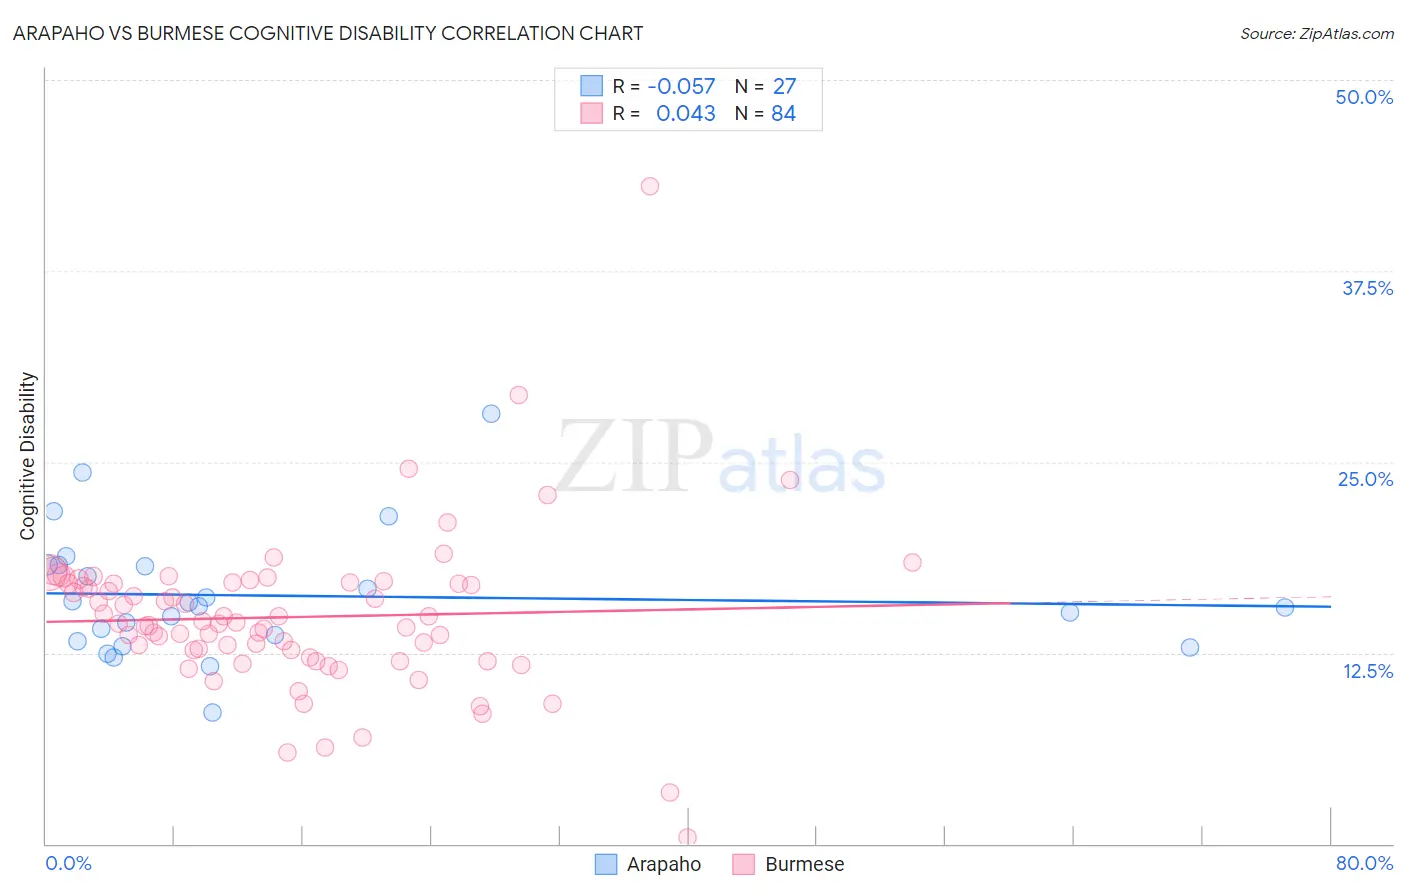
Arapaho vs Burmese Cognitive Disability Correlation Chart
The statistical analysis conducted on geographies consisting of 29,780,325 people shows a slight negative correlation between the proportion of Arapaho and percentage of population with cognitive disability in the United States with a correlation coefficient (R) of -0.057 and weighted average of 16.8%. Similarly, the statistical analysis conducted on geographies consisting of 465,327,059 people shows no correlation between the proportion of Burmese and percentage of population with cognitive disability in the United States with a correlation coefficient (R) of 0.043 and weighted average of 16.7%, a difference of 1.0%.
Cognitive Disability Correlation Summary
| Measurement | Arapaho | Burmese |
| Minimum | 8.6% | 0.40% |
| Maximum | 28.2% | 43.0% |
| Range | 19.5% | 42.6% |
| Mean | 16.2% | 14.8% |
| Median | 15.6% | 14.4% |
| Interquartile 25% (IQ1) | 13.2% | 12.4% |
| Interquartile 75% (IQ3) | 18.3% | 17.1% |
| Interquartile Range (IQR) | 5.0% | 4.7% |
| Standard Deviation (Sample) | 4.1% | 5.3% |
| Standard Deviation (Population) | 4.1% | 5.3% |
Similar Demographics by Cognitive Disability
Demographics Similar to Arapaho by Cognitive Disability
In terms of cognitive disability, the demographic groups most similar to Arapaho are Albanian (16.8%, a difference of 0.010%), Uruguayan (16.8%, a difference of 0.010%), Indian (Asian) (16.8%, a difference of 0.040%), Immigrants from Sri Lanka (16.8%, a difference of 0.040%), and Korean (16.8%, a difference of 0.040%).
| Demographics | Rating | Rank | Cognitive Disability |
| Paraguayans | 98.0 /100 | #103 | Exceptional 16.8% |
| Palestinians | 98.0 /100 | #104 | Exceptional 16.8% |
| Immigrants | Eastern Asia | 97.9 /100 | #105 | Exceptional 16.8% |
| Northern Europeans | 97.8 /100 | #106 | Exceptional 16.8% |
| Immigrants | Nicaragua | 97.8 /100 | #107 | Exceptional 16.8% |
| Canadians | 97.5 /100 | #108 | Exceptional 16.8% |
| Albanians | 97.3 /100 | #109 | Exceptional 16.8% |
| Arapaho | 97.3 /100 | #110 | Exceptional 16.8% |
| Uruguayans | 97.2 /100 | #111 | Exceptional 16.8% |
| Indians (Asian) | 97.2 /100 | #112 | Exceptional 16.8% |
| Immigrants | Sri Lanka | 97.1 /100 | #113 | Exceptional 16.8% |
| Koreans | 97.1 /100 | #114 | Exceptional 16.8% |
| Yup'ik | 96.9 /100 | #115 | Exceptional 16.9% |
| Inupiat | 96.5 /100 | #116 | Exceptional 16.9% |
| Immigrants | Japan | 96.2 /100 | #117 | Exceptional 16.9% |
Demographics Similar to Burmese by Cognitive Disability
In terms of cognitive disability, the demographic groups most similar to Burmese are Slavic (16.7%, a difference of 0.0%), German (16.7%, a difference of 0.010%), Estonian (16.7%, a difference of 0.010%), Immigrants from Belgium (16.7%, a difference of 0.020%), and Immigrants from Sweden (16.7%, a difference of 0.030%).
| Demographics | Rating | Rank | Cognitive Disability |
| Immigrants | Ukraine | 99.5 /100 | #66 | Exceptional 16.6% |
| Latvians | 99.5 /100 | #67 | Exceptional 16.6% |
| Ukrainians | 99.4 /100 | #68 | Exceptional 16.6% |
| Immigrants | Uzbekistan | 99.4 /100 | #69 | Exceptional 16.7% |
| Immigrants | Sweden | 99.4 /100 | #70 | Exceptional 16.7% |
| Immigrants | Belgium | 99.3 /100 | #71 | Exceptional 16.7% |
| Germans | 99.3 /100 | #72 | Exceptional 16.7% |
| Burmese | 99.3 /100 | #73 | Exceptional 16.7% |
| Slavs | 99.3 /100 | #74 | Exceptional 16.7% |
| Estonians | 99.3 /100 | #75 | Exceptional 16.7% |
| Immigrants | Serbia | 99.3 /100 | #76 | Exceptional 16.7% |
| Immigrants | Hungary | 99.3 /100 | #77 | Exceptional 16.7% |
| Peruvians | 99.3 /100 | #78 | Exceptional 16.7% |
| Immigrants | Bulgaria | 99.3 /100 | #79 | Exceptional 16.7% |
| Egyptians | 99.2 /100 | #80 | Exceptional 16.7% |