Arapaho vs Spanish American Indian Cognitive Disability
COMPARE
Arapaho
Spanish American Indian
Cognitive Disability
Cognitive Disability Comparison
Arapaho
Spanish American Indians
16.8%
COGNITIVE DISABILITY
97.3/ 100
METRIC RATING
110th/ 347
METRIC RANK
17.8%
COGNITIVE DISABILITY
2.0/ 100
METRIC RATING
235th/ 347
METRIC RANK
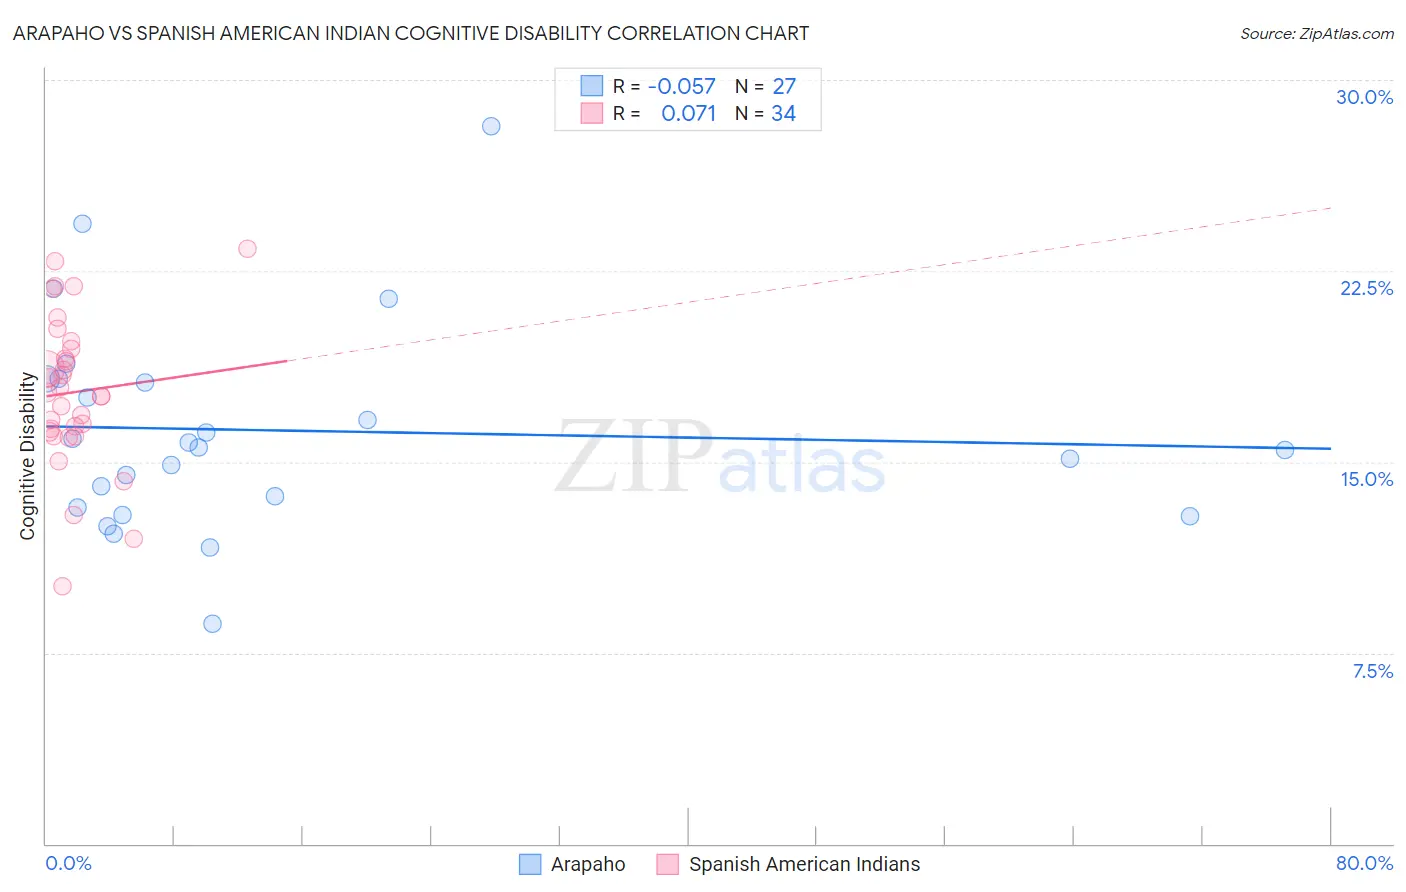
Arapaho vs Spanish American Indian Cognitive Disability Correlation Chart
The statistical analysis conducted on geographies consisting of 29,780,325 people shows a slight negative correlation between the proportion of Arapaho and percentage of population with cognitive disability in the United States with a correlation coefficient (R) of -0.057 and weighted average of 16.8%. Similarly, the statistical analysis conducted on geographies consisting of 73,150,113 people shows a slight positive correlation between the proportion of Spanish American Indians and percentage of population with cognitive disability in the United States with a correlation coefficient (R) of 0.071 and weighted average of 17.8%, a difference of 5.5%.
Cognitive Disability Correlation Summary
| Measurement | Arapaho | Spanish American Indian |
| Minimum | 8.6% | 10.1% |
| Maximum | 28.2% | 23.4% |
| Range | 19.5% | 13.2% |
| Mean | 16.2% | 17.7% |
| Median | 15.6% | 17.6% |
| Interquartile 25% (IQ1) | 13.2% | 16.2% |
| Interquartile 75% (IQ3) | 18.3% | 19.4% |
| Interquartile Range (IQR) | 5.0% | 3.3% |
| Standard Deviation (Sample) | 4.1% | 3.0% |
| Standard Deviation (Population) | 4.1% | 2.9% |
Similar Demographics by Cognitive Disability
Demographics Similar to Arapaho by Cognitive Disability
In terms of cognitive disability, the demographic groups most similar to Arapaho are Albanian (16.8%, a difference of 0.010%), Uruguayan (16.8%, a difference of 0.010%), Indian (Asian) (16.8%, a difference of 0.040%), Immigrants from Sri Lanka (16.8%, a difference of 0.040%), and Korean (16.8%, a difference of 0.040%).
| Demographics | Rating | Rank | Cognitive Disability |
| Paraguayans | 98.0 /100 | #103 | Exceptional 16.8% |
| Palestinians | 98.0 /100 | #104 | Exceptional 16.8% |
| Immigrants | Eastern Asia | 97.9 /100 | #105 | Exceptional 16.8% |
| Northern Europeans | 97.8 /100 | #106 | Exceptional 16.8% |
| Immigrants | Nicaragua | 97.8 /100 | #107 | Exceptional 16.8% |
| Canadians | 97.5 /100 | #108 | Exceptional 16.8% |
| Albanians | 97.3 /100 | #109 | Exceptional 16.8% |
| Arapaho | 97.3 /100 | #110 | Exceptional 16.8% |
| Uruguayans | 97.2 /100 | #111 | Exceptional 16.8% |
| Indians (Asian) | 97.2 /100 | #112 | Exceptional 16.8% |
| Immigrants | Sri Lanka | 97.1 /100 | #113 | Exceptional 16.8% |
| Koreans | 97.1 /100 | #114 | Exceptional 16.8% |
| Yup'ik | 96.9 /100 | #115 | Exceptional 16.9% |
| Inupiat | 96.5 /100 | #116 | Exceptional 16.9% |
| Immigrants | Japan | 96.2 /100 | #117 | Exceptional 16.9% |
Demographics Similar to Spanish American Indians by Cognitive Disability
In terms of cognitive disability, the demographic groups most similar to Spanish American Indians are Osage (17.8%, a difference of 0.0%), Guatemalan (17.8%, a difference of 0.020%), Tongan (17.8%, a difference of 0.020%), Panamanian (17.8%, a difference of 0.020%), and Mongolian (17.7%, a difference of 0.060%).
| Demographics | Rating | Rank | Cognitive Disability |
| Immigrants | Central America | 2.3 /100 | #228 | Tragic 17.7% |
| Immigrants | Guatemala | 2.2 /100 | #229 | Tragic 17.7% |
| Mongolians | 2.2 /100 | #230 | Tragic 17.7% |
| Guatemalans | 2.1 /100 | #231 | Tragic 17.8% |
| Tongans | 2.1 /100 | #232 | Tragic 17.8% |
| Panamanians | 2.1 /100 | #233 | Tragic 17.8% |
| Osage | 2.0 /100 | #234 | Tragic 17.8% |
| Spanish American Indians | 2.0 /100 | #235 | Tragic 17.8% |
| Immigrants | Iraq | 1.8 /100 | #236 | Tragic 17.8% |
| Immigrants | Mexico | 1.8 /100 | #237 | Tragic 17.8% |
| Cheyenne | 1.7 /100 | #238 | Tragic 17.8% |
| Cajuns | 1.4 /100 | #239 | Tragic 17.8% |
| Iraqis | 1.4 /100 | #240 | Tragic 17.8% |
| Mexicans | 1.1 /100 | #241 | Tragic 17.8% |
| Paiute | 1.1 /100 | #242 | Tragic 17.8% |