Belgian vs Slovak Ambulatory Disability
COMPARE
Belgian
Slovak
Ambulatory Disability
Ambulatory Disability Comparison
Belgians
Slovaks
6.2%
AMBULATORY DISABILITY
28.6/ 100
METRIC RATING
195th/ 347
METRIC RANK
6.7%
AMBULATORY DISABILITY
0.1/ 100
METRIC RATING
270th/ 347
METRIC RANK
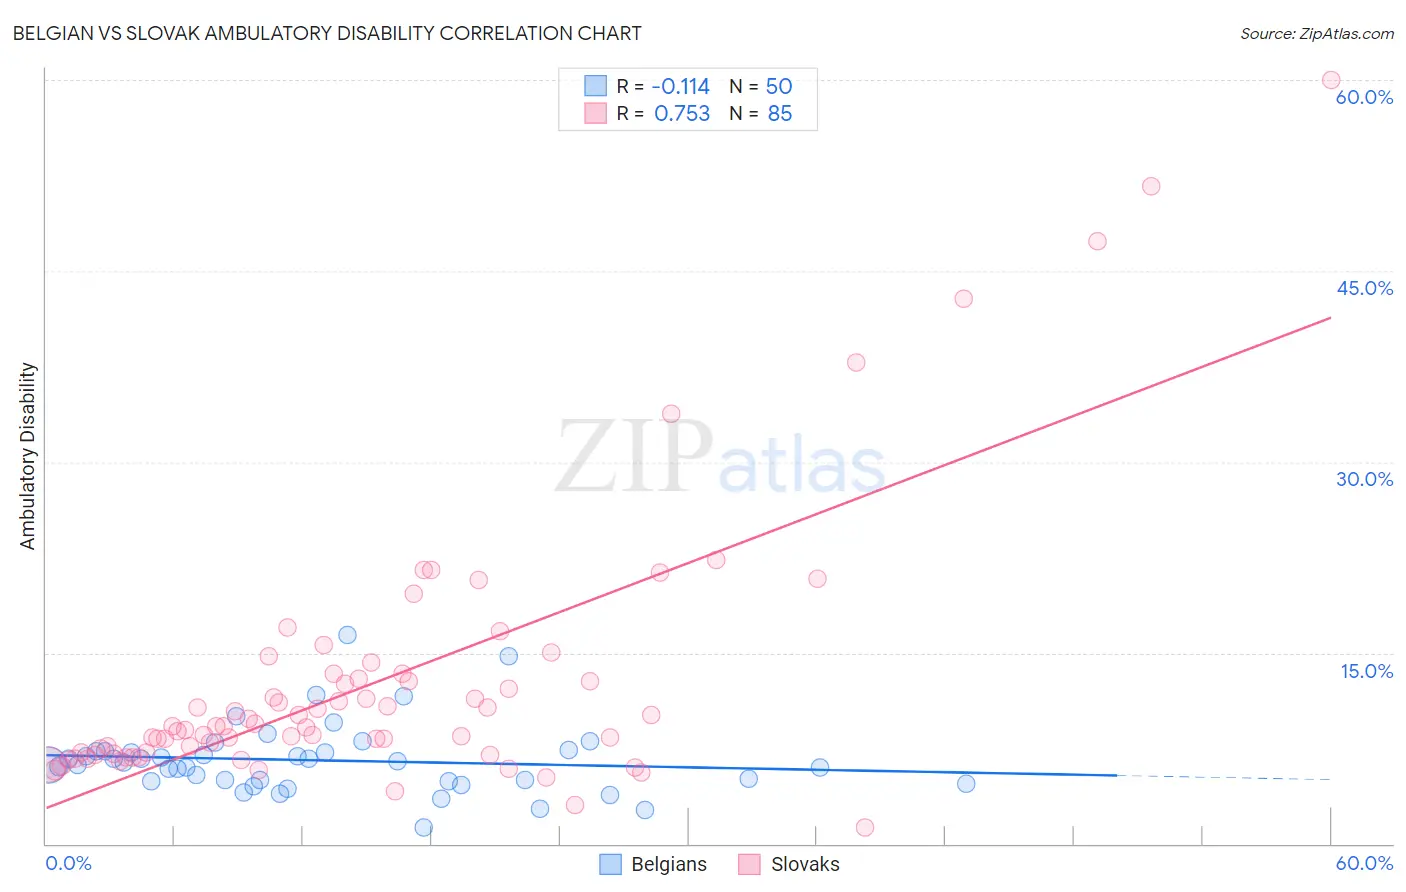
Belgian vs Slovak Ambulatory Disability Correlation Chart
The statistical analysis conducted on geographies consisting of 355,928,519 people shows a poor negative correlation between the proportion of Belgians and percentage of population with ambulatory disability in the United States with a correlation coefficient (R) of -0.114 and weighted average of 6.2%. Similarly, the statistical analysis conducted on geographies consisting of 397,780,873 people shows a strong positive correlation between the proportion of Slovaks and percentage of population with ambulatory disability in the United States with a correlation coefficient (R) of 0.753 and weighted average of 6.7%, a difference of 7.5%.
Ambulatory Disability Correlation Summary
| Measurement | Belgian | Slovak |
| Minimum | 1.3% | 1.3% |
| Maximum | 16.4% | 60.0% |
| Range | 15.1% | 58.7% |
| Mean | 6.6% | 12.6% |
| Median | 6.3% | 9.2% |
| Interquartile 25% (IQ1) | 4.9% | 7.0% |
| Interquartile 75% (IQ3) | 7.2% | 13.2% |
| Interquartile Range (IQR) | 2.3% | 6.1% |
| Standard Deviation (Sample) | 2.8% | 10.4% |
| Standard Deviation (Population) | 2.7% | 10.3% |
Similar Demographics by Ambulatory Disability
Demographics Similar to Belgians by Ambulatory Disability
In terms of ambulatory disability, the demographic groups most similar to Belgians are Malaysian (6.2%, a difference of 0.030%), Guatemalan (6.2%, a difference of 0.080%), Alaska Native (6.2%, a difference of 0.080%), Polish (6.2%, a difference of 0.15%), and Immigrants from Western Europe (6.2%, a difference of 0.19%).
| Demographics | Rating | Rank | Ambulatory Disability |
| British | 34.3 /100 | #188 | Fair 6.2% |
| Ukrainians | 34.0 /100 | #189 | Fair 6.2% |
| Immigrants | Western Africa | 33.4 /100 | #190 | Fair 6.2% |
| Immigrants | Guatemala | 31.9 /100 | #191 | Fair 6.2% |
| Immigrants | Western Europe | 31.6 /100 | #192 | Fair 6.2% |
| Guatemalans | 30.0 /100 | #193 | Fair 6.2% |
| Alaska Natives | 29.8 /100 | #194 | Fair 6.2% |
| Belgians | 28.6 /100 | #195 | Fair 6.2% |
| Malaysians | 28.2 /100 | #196 | Fair 6.2% |
| Poles | 26.3 /100 | #197 | Fair 6.2% |
| Immigrants | Bangladesh | 24.6 /100 | #198 | Fair 6.2% |
| Italians | 22.6 /100 | #199 | Fair 6.2% |
| Immigrants | Cambodia | 21.5 /100 | #200 | Fair 6.2% |
| Immigrants | Central America | 20.1 /100 | #201 | Fair 6.2% |
| Albanians | 19.7 /100 | #202 | Poor 6.2% |
Demographics Similar to Slovaks by Ambulatory Disability
In terms of ambulatory disability, the demographic groups most similar to Slovaks are Immigrants from Trinidad and Tobago (6.7%, a difference of 0.10%), French (6.6%, a difference of 0.16%), French Canadian (6.7%, a difference of 0.46%), Spanish (6.6%, a difference of 0.47%), and Trinidadian and Tobagonian (6.6%, a difference of 0.48%).
| Demographics | Rating | Rank | Ambulatory Disability |
| Hmong | 0.3 /100 | #263 | Tragic 6.6% |
| Nepalese | 0.2 /100 | #264 | Tragic 6.6% |
| Bahamians | 0.2 /100 | #265 | Tragic 6.6% |
| Guyanese | 0.2 /100 | #266 | Tragic 6.6% |
| Trinidadians and Tobagonians | 0.2 /100 | #267 | Tragic 6.6% |
| Spanish | 0.2 /100 | #268 | Tragic 6.6% |
| French | 0.1 /100 | #269 | Tragic 6.6% |
| Slovaks | 0.1 /100 | #270 | Tragic 6.7% |
| Immigrants | Trinidad and Tobago | 0.1 /100 | #271 | Tragic 6.7% |
| French Canadians | 0.1 /100 | #272 | Tragic 6.7% |
| Whites/Caucasians | 0.1 /100 | #273 | Tragic 6.7% |
| Sioux | 0.1 /100 | #274 | Tragic 6.7% |
| Immigrants | Guyana | 0.1 /100 | #275 | Tragic 6.7% |
| Celtics | 0.1 /100 | #276 | Tragic 6.7% |
| Jamaicans | 0.1 /100 | #277 | Tragic 6.7% |