Arab vs Paiute Self-Care Disability
COMPARE
Arab
Paiute
Self-Care Disability
Self-Care Disability Comparison
Arabs
Paiute
2.4%
SELF-CARE DISABILITY
75.7/ 100
METRIC RATING
149th/ 347
METRIC RANK
2.9%
SELF-CARE DISABILITY
0.0/ 100
METRIC RATING
326th/ 347
METRIC RANK
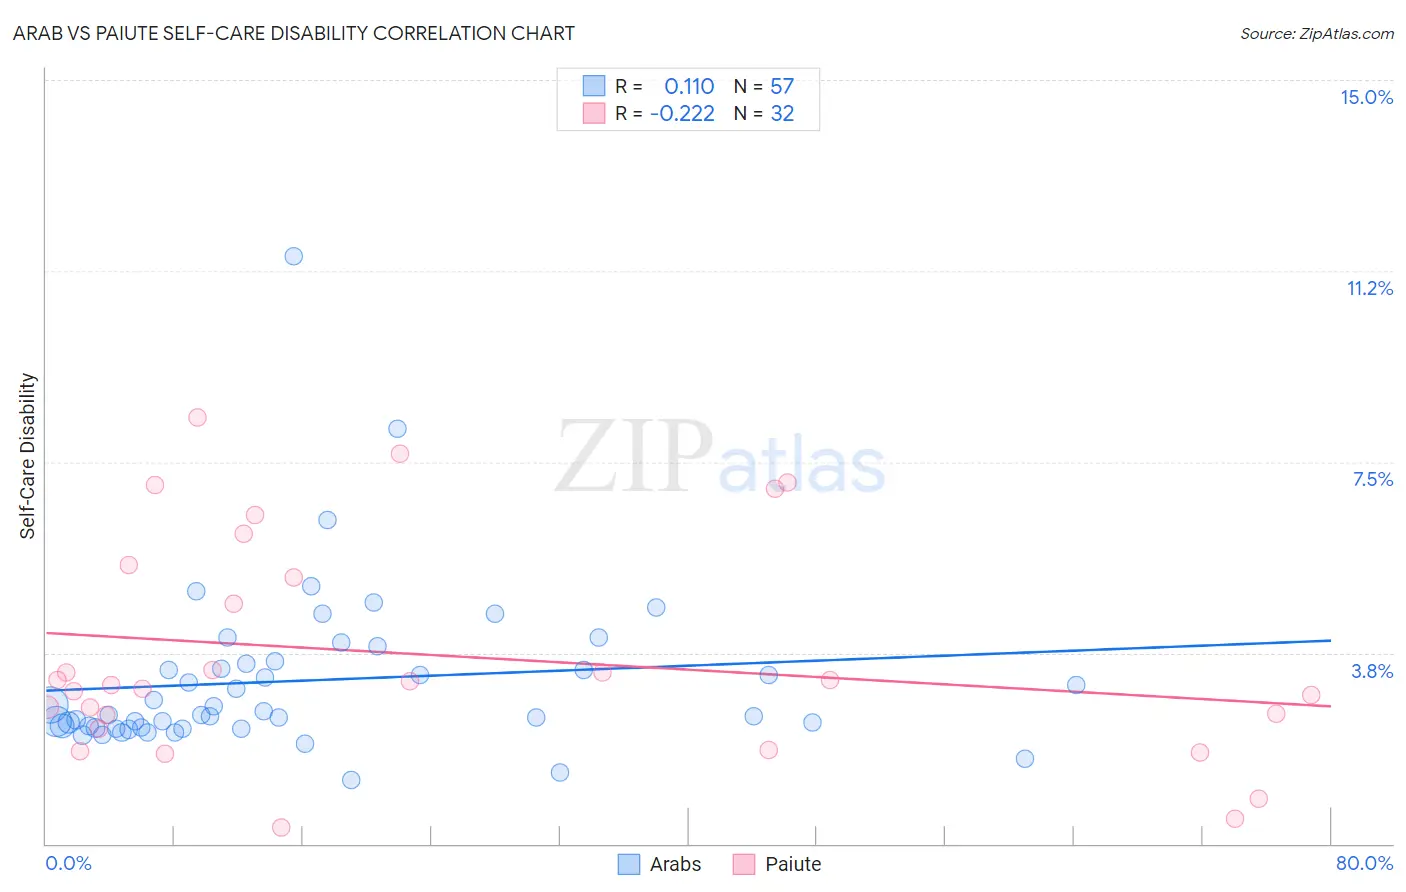
Arab vs Paiute Self-Care Disability Correlation Chart
The statistical analysis conducted on geographies consisting of 485,999,863 people shows a poor positive correlation between the proportion of Arabs and percentage of population with self-care disability in the United States with a correlation coefficient (R) of 0.110 and weighted average of 2.4%. Similarly, the statistical analysis conducted on geographies consisting of 58,381,143 people shows a weak negative correlation between the proportion of Paiute and percentage of population with self-care disability in the United States with a correlation coefficient (R) of -0.222 and weighted average of 2.9%, a difference of 20.1%.
Self-Care Disability Correlation Summary
| Measurement | Arab | Paiute |
| Minimum | 1.3% | 0.31% |
| Maximum | 11.5% | 8.4% |
| Range | 10.3% | 8.1% |
| Mean | 3.2% | 3.7% |
| Median | 2.5% | 3.2% |
| Interquartile 25% (IQ1) | 2.3% | 2.4% |
| Interquartile 75% (IQ3) | 3.6% | 5.4% |
| Interquartile Range (IQR) | 1.3% | 3.0% |
| Standard Deviation (Sample) | 1.6% | 2.2% |
| Standard Deviation (Population) | 1.6% | 2.1% |
Similar Demographics by Self-Care Disability
Demographics Similar to Arabs by Self-Care Disability
In terms of self-care disability, the demographic groups most similar to Arabs are Romanian (2.4%, a difference of 0.010%), Immigrants from Costa Rica (2.4%, a difference of 0.040%), Basque (2.4%, a difference of 0.11%), Dutch (2.4%, a difference of 0.12%), and Tlingit-Haida (2.4%, a difference of 0.14%).
| Demographics | Rating | Rank | Self-Care Disability |
| Immigrants | Peru | 83.2 /100 | #142 | Excellent 2.4% |
| Afghans | 82.3 /100 | #143 | Excellent 2.4% |
| Costa Ricans | 80.8 /100 | #144 | Excellent 2.4% |
| Germans | 80.1 /100 | #145 | Excellent 2.4% |
| Israelis | 80.0 /100 | #146 | Good 2.4% |
| Dutch | 77.5 /100 | #147 | Good 2.4% |
| Romanians | 75.8 /100 | #148 | Good 2.4% |
| Arabs | 75.7 /100 | #149 | Good 2.4% |
| Immigrants | Costa Rica | 75.1 /100 | #150 | Good 2.4% |
| Basques | 74.0 /100 | #151 | Good 2.4% |
| Tlingit-Haida | 73.5 /100 | #152 | Good 2.4% |
| Immigrants | England | 73.5 /100 | #153 | Good 2.4% |
| Italians | 72.2 /100 | #154 | Good 2.4% |
| Pakistanis | 71.4 /100 | #155 | Good 2.4% |
| Nigerians | 70.6 /100 | #156 | Good 2.4% |
Demographics Similar to Paiute by Self-Care Disability
In terms of self-care disability, the demographic groups most similar to Paiute are Black/African American (2.9%, a difference of 0.070%), Hopi (2.9%, a difference of 0.45%), Cajun (2.9%, a difference of 0.67%), Immigrants from Uzbekistan (2.9%, a difference of 0.94%), and Nepalese (3.0%, a difference of 1.4%).
| Demographics | Rating | Rank | Self-Care Disability |
| Spanish American Indians | 0.0 /100 | #319 | Tragic 2.9% |
| Chickasaw | 0.0 /100 | #320 | Tragic 2.9% |
| Navajo | 0.0 /100 | #321 | Tragic 2.9% |
| Comanche | 0.0 /100 | #322 | Tragic 2.9% |
| Seminole | 0.0 /100 | #323 | Tragic 2.9% |
| Cherokee | 0.0 /100 | #324 | Tragic 2.9% |
| Immigrants | Uzbekistan | 0.0 /100 | #325 | Tragic 2.9% |
| Paiute | 0.0 /100 | #326 | Tragic 2.9% |
| Blacks/African Americans | 0.0 /100 | #327 | Tragic 2.9% |
| Hopi | 0.0 /100 | #328 | Tragic 2.9% |
| Cajuns | 0.0 /100 | #329 | Tragic 2.9% |
| Nepalese | 0.0 /100 | #330 | Tragic 3.0% |
| Lumbee | 0.0 /100 | #331 | Tragic 3.0% |
| Kiowa | 0.0 /100 | #332 | Tragic 3.0% |
| Dutch West Indians | 0.0 /100 | #333 | Tragic 3.0% |