Arab vs Paiute Births to Unmarried Women
COMPARE
Arab
Paiute
Births to Unmarried Women
Births to Unmarried Women Comparison
Arabs
Paiute
29.2%
BIRTHS TO UNMARRIED WOMEN
96.5/ 100
METRIC RATING
92nd/ 347
METRIC RANK
42.5%
BIRTHS TO UNMARRIED WOMEN
0.0/ 100
METRIC RATING
329th/ 347
METRIC RANK
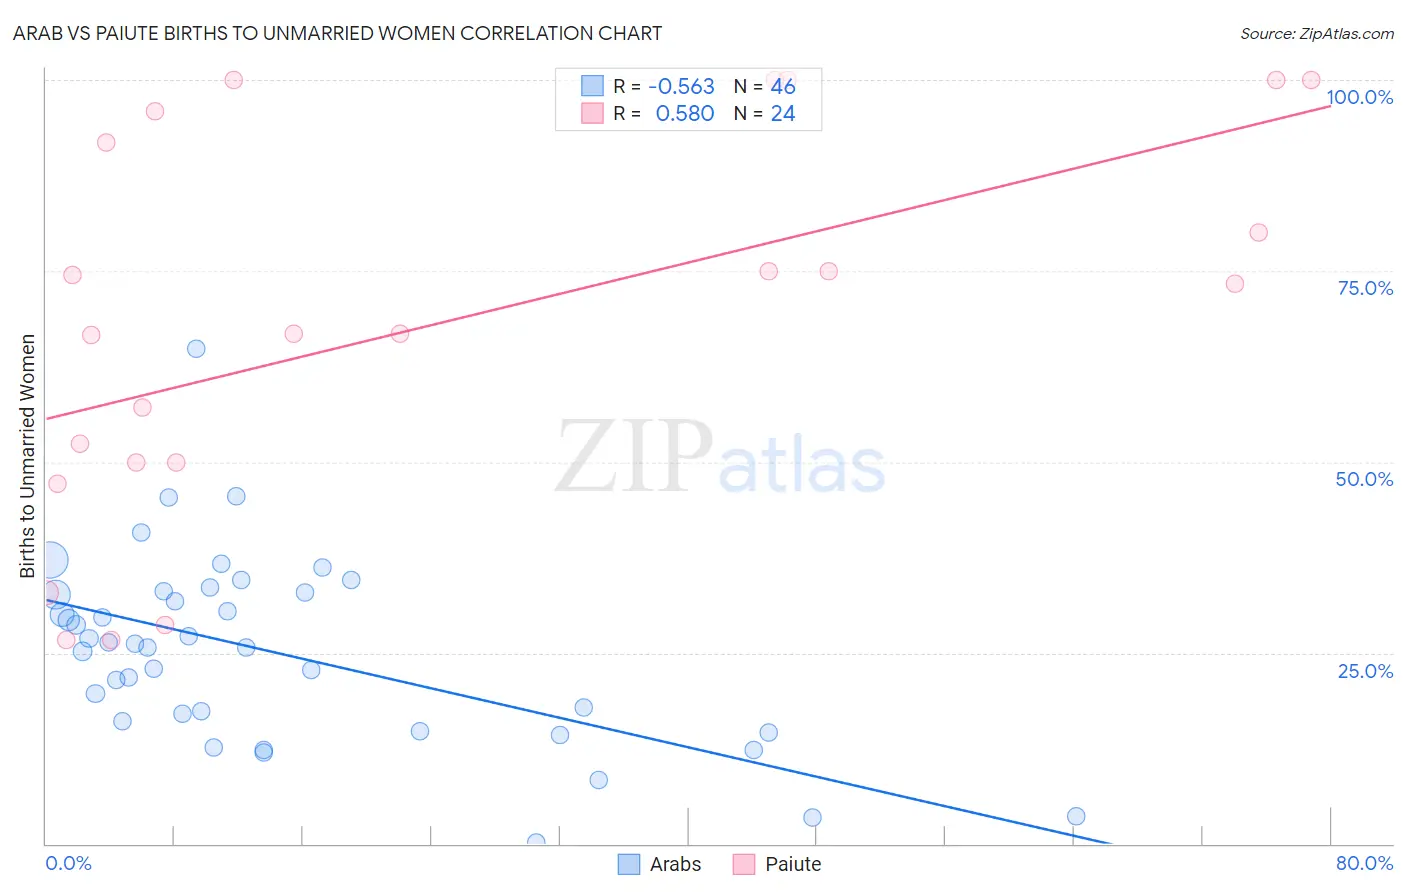
Arab vs Paiute Births to Unmarried Women Correlation Chart
The statistical analysis conducted on geographies consisting of 447,045,945 people shows a substantial negative correlation between the proportion of Arabs and percentage of births to unmarried women in the United States with a correlation coefficient (R) of -0.563 and weighted average of 29.2%. Similarly, the statistical analysis conducted on geographies consisting of 57,331,640 people shows a substantial positive correlation between the proportion of Paiute and percentage of births to unmarried women in the United States with a correlation coefficient (R) of 0.580 and weighted average of 42.5%, a difference of 45.5%.
Births to Unmarried Women Correlation Summary
| Measurement | Arab | Paiute |
| Minimum | 0.20% | 26.6% |
| Maximum | 64.9% | 100.0% |
| Range | 64.7% | 73.4% |
| Mean | 25.1% | 68.2% |
| Median | 26.0% | 70.0% |
| Interquartile 25% (IQ1) | 16.0% | 50.0% |
| Interquartile 75% (IQ3) | 32.9% | 93.9% |
| Interquartile Range (IQR) | 16.9% | 43.9% |
| Standard Deviation (Sample) | 12.3% | 25.1% |
| Standard Deviation (Population) | 12.2% | 24.5% |
Similar Demographics by Births to Unmarried Women
Demographics Similar to Arabs by Births to Unmarried Women
In terms of births to unmarried women, the demographic groups most similar to Arabs are Immigrants from Fiji (29.2%, a difference of 0.040%), Estonian (29.2%, a difference of 0.040%), Ukrainian (29.2%, a difference of 0.16%), Immigrants from Latvia (29.1%, a difference of 0.25%), and Immigrants from Vietnam (29.3%, a difference of 0.30%).
| Demographics | Rating | Rank | Births to Unmarried Women |
| Sri Lankans | 97.5 /100 | #85 | Exceptional 28.9% |
| Immigrants | Jordan | 97.4 /100 | #86 | Exceptional 29.0% |
| Taiwanese | 97.3 /100 | #87 | Exceptional 29.0% |
| Immigrants | France | 97.3 /100 | #88 | Exceptional 29.0% |
| Immigrants | Saudi Arabia | 97.0 /100 | #89 | Exceptional 29.1% |
| Immigrants | Latvia | 96.8 /100 | #90 | Exceptional 29.1% |
| Immigrants | Fiji | 96.6 /100 | #91 | Exceptional 29.2% |
| Arabs | 96.5 /100 | #92 | Exceptional 29.2% |
| Estonians | 96.5 /100 | #93 | Exceptional 29.2% |
| Ukrainians | 96.3 /100 | #94 | Exceptional 29.2% |
| Immigrants | Vietnam | 96.1 /100 | #95 | Exceptional 29.3% |
| Norwegians | 95.8 /100 | #96 | Exceptional 29.3% |
| Immigrants | South Africa | 95.7 /100 | #97 | Exceptional 29.3% |
| Immigrants | Syria | 95.7 /100 | #98 | Exceptional 29.4% |
| Immigrants | Denmark | 95.3 /100 | #99 | Exceptional 29.4% |
Demographics Similar to Paiute by Births to Unmarried Women
In terms of births to unmarried women, the demographic groups most similar to Paiute are Chippewa (42.6%, a difference of 0.40%), Immigrants from Cabo Verde (42.2%, a difference of 0.60%), Tsimshian (42.2%, a difference of 0.74%), Native/Alaskan (43.0%, a difference of 1.2%), and Kiowa (43.1%, a difference of 1.6%).
| Demographics | Rating | Rank | Births to Unmarried Women |
| Cajuns | 0.0 /100 | #322 | Tragic 41.0% |
| Sioux | 0.0 /100 | #323 | Tragic 41.0% |
| Cape Verdeans | 0.0 /100 | #324 | Tragic 41.3% |
| Cheyenne | 0.0 /100 | #325 | Tragic 41.3% |
| Immigrants | Cuba | 0.0 /100 | #326 | Tragic 41.5% |
| Tsimshian | 0.0 /100 | #327 | Tragic 42.2% |
| Immigrants | Cabo Verde | 0.0 /100 | #328 | Tragic 42.2% |
| Paiute | 0.0 /100 | #329 | Tragic 42.5% |
| Chippewa | 0.0 /100 | #330 | Tragic 42.6% |
| Natives/Alaskans | 0.0 /100 | #331 | Tragic 43.0% |
| Kiowa | 0.0 /100 | #332 | Tragic 43.1% |
| Blacks/African Americans | 0.0 /100 | #333 | Tragic 44.3% |
| Yuman | 0.0 /100 | #334 | Tragic 44.4% |
| Colville | 0.0 /100 | #335 | Tragic 45.3% |
| Puerto Ricans | 0.0 /100 | #336 | Tragic 45.7% |