Arab vs Immigrants from Venezuela Disability Age Over 75
COMPARE
Arab
Immigrants from Venezuela
Disability Age Over 75
Disability Age Over 75 Comparison
Arabs
Immigrants from Venezuela
47.1%
DISABILITY AGE OVER 75
73.3/ 100
METRIC RATING
156th/ 347
METRIC RANK
46.8%
DISABILITY AGE OVER 75
88.6/ 100
METRIC RATING
136th/ 347
METRIC RANK
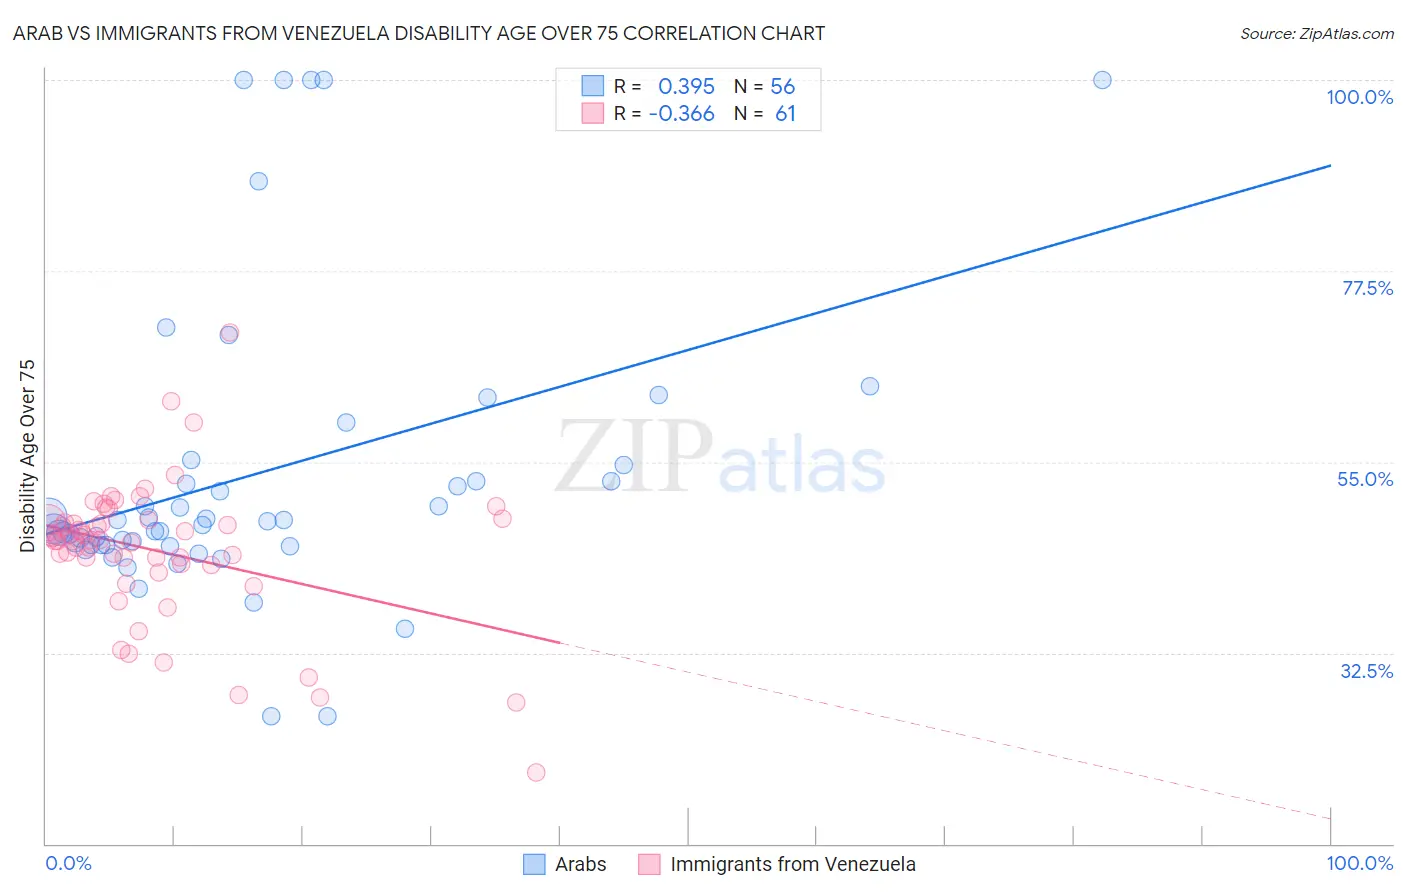
Arab vs Immigrants from Venezuela Disability Age Over 75 Correlation Chart
The statistical analysis conducted on geographies consisting of 485,582,526 people shows a mild positive correlation between the proportion of Arabs and percentage of population with a disability over the age of 75 in the United States with a correlation coefficient (R) of 0.395 and weighted average of 47.1%. Similarly, the statistical analysis conducted on geographies consisting of 287,644,311 people shows a mild negative correlation between the proportion of Immigrants from Venezuela and percentage of population with a disability over the age of 75 in the United States with a correlation coefficient (R) of -0.366 and weighted average of 46.8%, a difference of 0.59%.
Disability Age Over 75 Correlation Summary
| Measurement | Arab | Immigrants from Venezuela |
| Minimum | 25.0% | 18.4% |
| Maximum | 100.0% | 70.3% |
| Range | 75.0% | 51.9% |
| Mean | 53.5% | 44.5% |
| Median | 47.8% | 45.8% |
| Interquartile 25% (IQ1) | 45.2% | 42.9% |
| Interquartile 75% (IQ3) | 53.7% | 48.0% |
| Interquartile Range (IQR) | 8.5% | 5.1% |
| Standard Deviation (Sample) | 17.6% | 8.4% |
| Standard Deviation (Population) | 17.4% | 8.3% |
Demographics Similar to Arabs and Immigrants from Venezuela by Disability Age Over 75
In terms of disability age over 75, the demographic groups most similar to Arabs are Immigrants from Zaire (47.1%, a difference of 0.040%), Immigrants from Belarus (47.1%, a difference of 0.040%), Immigrants from Iran (47.1%, a difference of 0.040%), Immigrants from Asia (47.0%, a difference of 0.090%), and French Canadian (47.0%, a difference of 0.18%). Similarly, the demographic groups most similar to Immigrants from Venezuela are Immigrants from Uganda (46.8%, a difference of 0.0%), Immigrants from Bosnia and Herzegovina (46.8%, a difference of 0.010%), Yugoslavian (46.8%, a difference of 0.010%), Immigrants from Costa Rica (46.8%, a difference of 0.060%), and Lebanese (46.8%, a difference of 0.090%).
| Demographics | Rating | Rank | Disability Age Over 75 |
| Immigrants | Venezuela | 88.6 /100 | #136 | Excellent 46.8% |
| Immigrants | Uganda | 88.5 /100 | #137 | Excellent 46.8% |
| Immigrants | Bosnia and Herzegovina | 88.5 /100 | #138 | Excellent 46.8% |
| Yugoslavians | 88.5 /100 | #139 | Excellent 46.8% |
| Immigrants | Costa Rica | 87.4 /100 | #140 | Excellent 46.8% |
| Lebanese | 87.0 /100 | #141 | Excellent 46.8% |
| Peruvians | 86.5 /100 | #142 | Excellent 46.8% |
| Bermudans | 85.6 /100 | #143 | Excellent 46.9% |
| Venezuelans | 85.0 /100 | #144 | Excellent 46.9% |
| Costa Ricans | 84.5 /100 | #145 | Excellent 46.9% |
| Guyanese | 84.3 /100 | #146 | Excellent 46.9% |
| Immigrants | Peru | 84.1 /100 | #147 | Excellent 46.9% |
| Asians | 81.6 /100 | #148 | Excellent 46.9% |
| Welsh | 81.3 /100 | #149 | Excellent 47.0% |
| Immigrants | Russia | 79.3 /100 | #150 | Good 47.0% |
| French Canadians | 79.0 /100 | #151 | Good 47.0% |
| Immigrants | Asia | 76.5 /100 | #152 | Good 47.0% |
| Immigrants | Zaire | 74.8 /100 | #153 | Good 47.1% |
| Immigrants | Belarus | 74.8 /100 | #154 | Good 47.1% |
| Immigrants | Iran | 74.7 /100 | #155 | Good 47.1% |
| Arabs | 73.3 /100 | #156 | Good 47.1% |