Arab vs Immigrants from Uzbekistan Unemployment Among Ages 55 to 59 years
COMPARE
Arab
Immigrants from Uzbekistan
Unemployment Among Ages 55 to 59 years
Unemployment Among Ages 55 to 59 years Comparison
Arabs
Immigrants from Uzbekistan
4.8%
UNEMPLOYMENT AMONG AGES 55 TO 59 YEARS
44.7/ 100
METRIC RATING
178th/ 347
METRIC RANK
5.3%
UNEMPLOYMENT AMONG AGES 55 TO 59 YEARS
0.0/ 100
METRIC RATING
280th/ 347
METRIC RANK
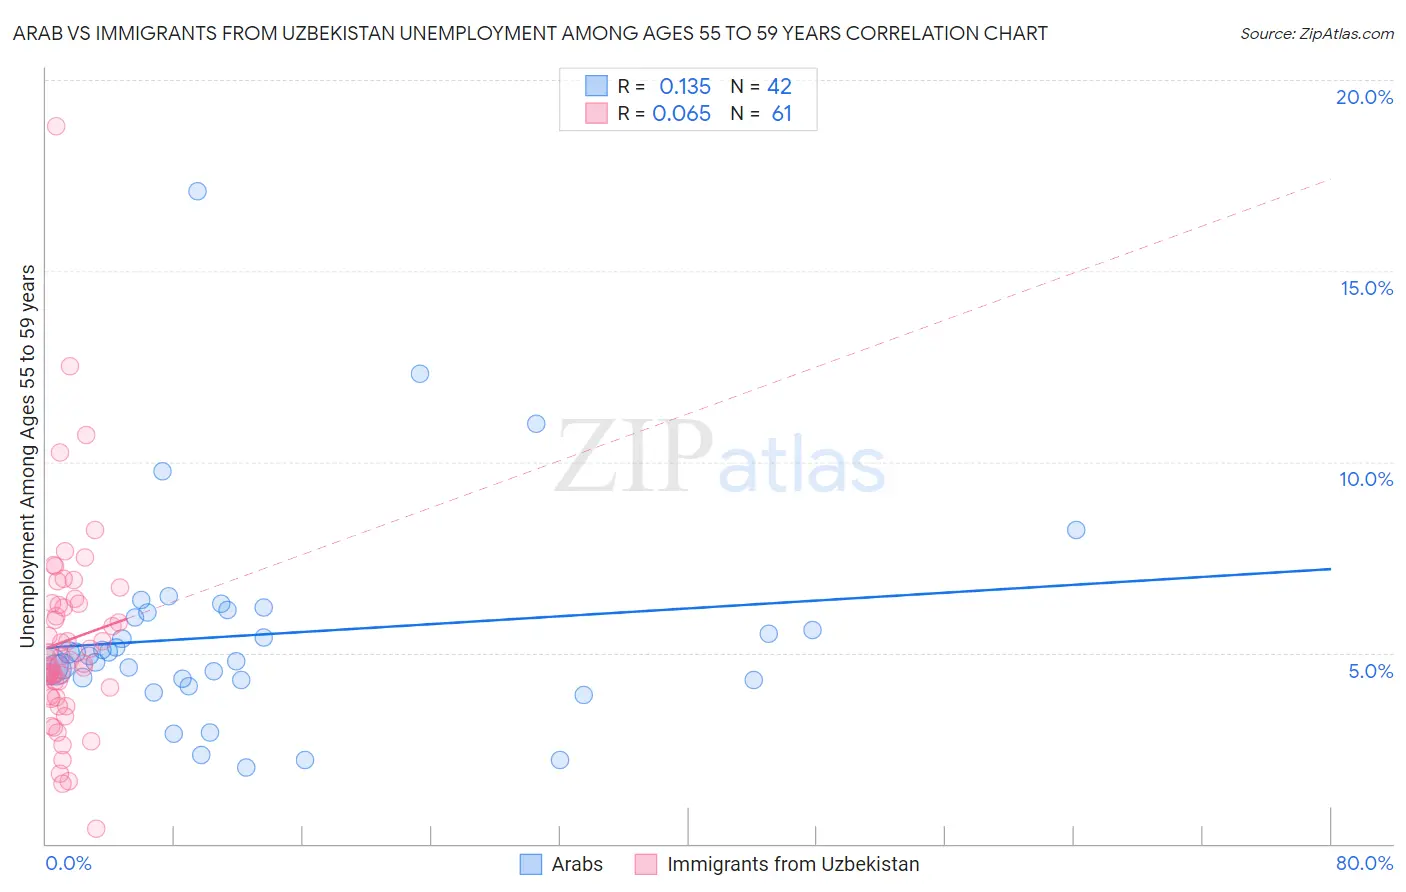
Arab vs Immigrants from Uzbekistan Unemployment Among Ages 55 to 59 years Correlation Chart
The statistical analysis conducted on geographies consisting of 441,814,241 people shows a poor positive correlation between the proportion of Arabs and unemployment rate among population between the ages 55 and 59 in the United States with a correlation coefficient (R) of 0.135 and weighted average of 4.8%. Similarly, the statistical analysis conducted on geographies consisting of 116,438,612 people shows a slight positive correlation between the proportion of Immigrants from Uzbekistan and unemployment rate among population between the ages 55 and 59 in the United States with a correlation coefficient (R) of 0.065 and weighted average of 5.3%, a difference of 8.8%.
Unemployment Among Ages 55 to 59 years Correlation Summary
| Measurement | Arab | Immigrants from Uzbekistan |
| Minimum | 2.0% | 0.40% |
| Maximum | 17.1% | 18.8% |
| Range | 15.1% | 18.4% |
| Mean | 5.5% | 5.3% |
| Median | 5.0% | 4.8% |
| Interquartile 25% (IQ1) | 4.3% | 3.8% |
| Interquartile 75% (IQ3) | 6.1% | 6.3% |
| Interquartile Range (IQR) | 1.8% | 2.5% |
| Standard Deviation (Sample) | 2.8% | 2.8% |
| Standard Deviation (Population) | 2.7% | 2.7% |
Similar Demographics by Unemployment Among Ages 55 to 59 years
Demographics Similar to Arabs by Unemployment Among Ages 55 to 59 years
In terms of unemployment among ages 55 to 59 years, the demographic groups most similar to Arabs are Hungarian (4.8%, a difference of 0.020%), South American (4.8%, a difference of 0.030%), Immigrants from Sri Lanka (4.8%, a difference of 0.090%), Samoan (4.8%, a difference of 0.10%), and Australian (4.8%, a difference of 0.16%).
| Demographics | Rating | Rank | Unemployment Among Ages 55 to 59 years |
| Japanese | 54.5 /100 | #171 | Average 4.8% |
| Nicaraguans | 54.0 /100 | #172 | Average 4.8% |
| Immigrants | Eastern Europe | 52.2 /100 | #173 | Average 4.8% |
| Immigrants | Croatia | 50.0 /100 | #174 | Average 4.8% |
| Australians | 48.6 /100 | #175 | Average 4.8% |
| Samoans | 47.1 /100 | #176 | Average 4.8% |
| Immigrants | Sri Lanka | 46.8 /100 | #177 | Average 4.8% |
| Arabs | 44.7 /100 | #178 | Average 4.8% |
| Hungarians | 44.3 /100 | #179 | Average 4.8% |
| South Americans | 44.0 /100 | #180 | Average 4.8% |
| Immigrants | Hungary | 40.4 /100 | #181 | Average 4.8% |
| Immigrants | Europe | 40.4 /100 | #182 | Average 4.8% |
| Immigrants | Peru | 38.6 /100 | #183 | Fair 4.8% |
| Immigrants | Czechoslovakia | 38.0 /100 | #184 | Fair 4.8% |
| Peruvians | 37.0 /100 | #185 | Fair 4.8% |
Demographics Similar to Immigrants from Uzbekistan by Unemployment Among Ages 55 to 59 years
In terms of unemployment among ages 55 to 59 years, the demographic groups most similar to Immigrants from Uzbekistan are Guatemalan (5.3%, a difference of 0.15%), Alsatian (5.2%, a difference of 0.21%), Immigrants from Barbados (5.2%, a difference of 0.32%), Immigrants from Trinidad and Tobago (5.3%, a difference of 0.41%), and Apache (5.3%, a difference of 0.45%).
| Demographics | Rating | Rank | Unemployment Among Ages 55 to 59 years |
| Ottawa | 0.0 /100 | #273 | Tragic 5.2% |
| Mexican American Indians | 0.0 /100 | #274 | Tragic 5.2% |
| Israelis | 0.0 /100 | #275 | Tragic 5.2% |
| West Indians | 0.0 /100 | #276 | Tragic 5.2% |
| Immigrants | Latin America | 0.0 /100 | #277 | Tragic 5.2% |
| Immigrants | Barbados | 0.0 /100 | #278 | Tragic 5.2% |
| Alsatians | 0.0 /100 | #279 | Tragic 5.2% |
| Immigrants | Uzbekistan | 0.0 /100 | #280 | Tragic 5.3% |
| Guatemalans | 0.0 /100 | #281 | Tragic 5.3% |
| Immigrants | Trinidad and Tobago | 0.0 /100 | #282 | Tragic 5.3% |
| Apache | 0.0 /100 | #283 | Tragic 5.3% |
| Ghanaians | 0.0 /100 | #284 | Tragic 5.3% |
| Armenians | 0.0 /100 | #285 | Tragic 5.3% |
| Immigrants | Ghana | 0.0 /100 | #286 | Tragic 5.3% |
| Immigrants | Guatemala | 0.0 /100 | #287 | Tragic 5.3% |