Arab vs Immigrants from Peru Disability Age Over 75
COMPARE
Arab
Immigrants from Peru
Disability Age Over 75
Disability Age Over 75 Comparison
Arabs
Immigrants from Peru
47.1%
DISABILITY AGE OVER 75
73.3/ 100
METRIC RATING
156th/ 347
METRIC RANK
46.9%
DISABILITY AGE OVER 75
84.1/ 100
METRIC RATING
147th/ 347
METRIC RANK
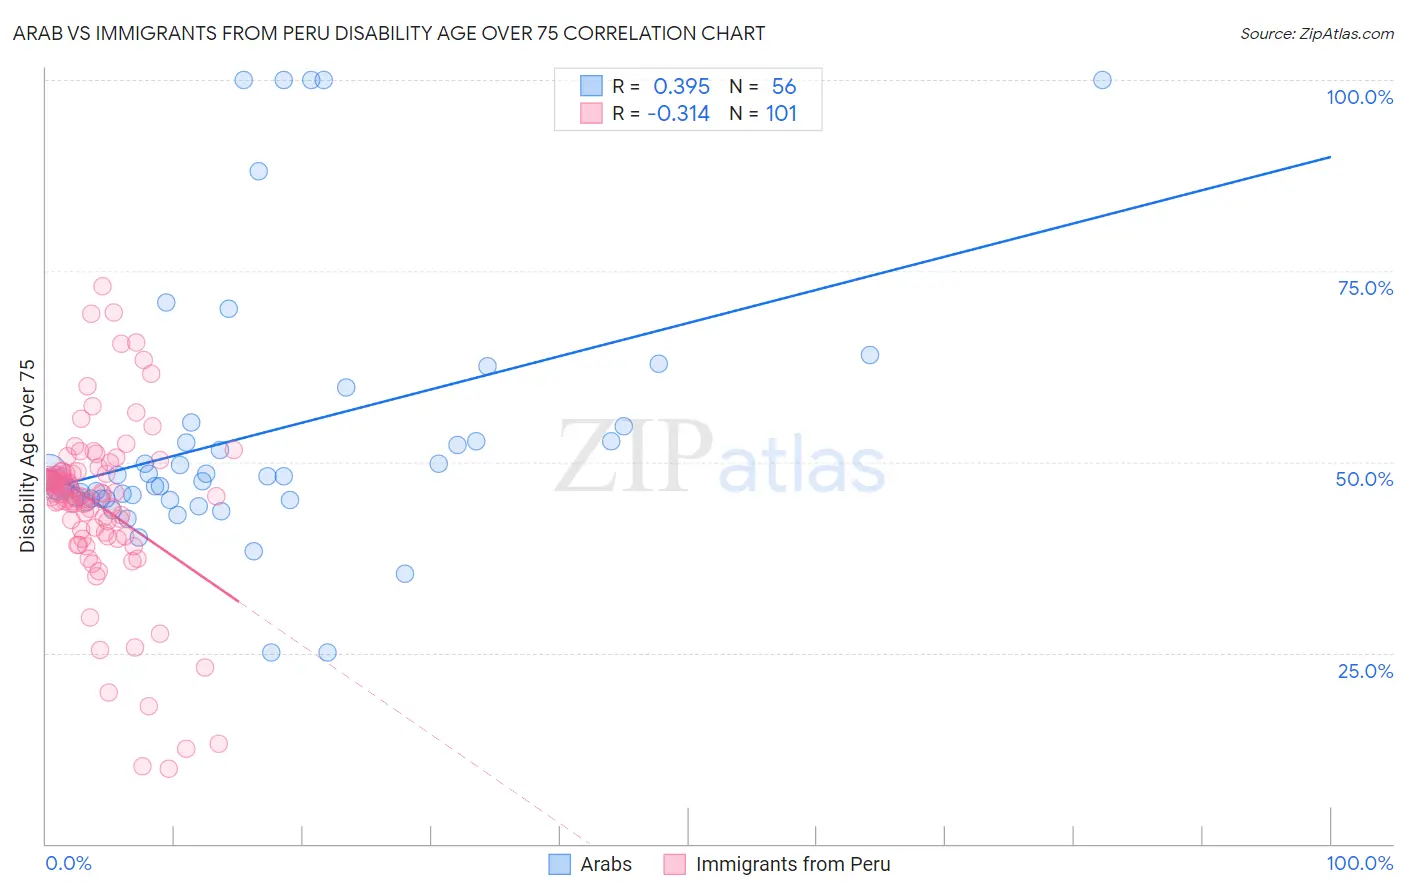
Arab vs Immigrants from Peru Disability Age Over 75 Correlation Chart
The statistical analysis conducted on geographies consisting of 485,582,526 people shows a mild positive correlation between the proportion of Arabs and percentage of population with a disability over the age of 75 in the United States with a correlation coefficient (R) of 0.395 and weighted average of 47.1%. Similarly, the statistical analysis conducted on geographies consisting of 328,503,391 people shows a mild negative correlation between the proportion of Immigrants from Peru and percentage of population with a disability over the age of 75 in the United States with a correlation coefficient (R) of -0.314 and weighted average of 46.9%, a difference of 0.37%.
Disability Age Over 75 Correlation Summary
| Measurement | Arab | Immigrants from Peru |
| Minimum | 25.0% | 9.9% |
| Maximum | 100.0% | 73.0% |
| Range | 75.0% | 63.1% |
| Mean | 53.5% | 44.5% |
| Median | 47.8% | 45.8% |
| Interquartile 25% (IQ1) | 45.2% | 40.6% |
| Interquartile 75% (IQ3) | 53.7% | 48.7% |
| Interquartile Range (IQR) | 8.5% | 8.1% |
| Standard Deviation (Sample) | 17.6% | 11.5% |
| Standard Deviation (Population) | 17.4% | 11.4% |
Demographics Similar to Arabs and Immigrants from Peru by Disability Age Over 75
In terms of disability age over 75, the demographic groups most similar to Arabs are Bhutanese (47.1%, a difference of 0.020%), Immigrants from Zaire (47.1%, a difference of 0.040%), Immigrants from Belarus (47.1%, a difference of 0.040%), Immigrants from Iran (47.1%, a difference of 0.040%), and Immigrants from Guyana (47.1%, a difference of 0.040%). Similarly, the demographic groups most similar to Immigrants from Peru are Guyanese (46.9%, a difference of 0.010%), Costa Rican (46.9%, a difference of 0.020%), Venezuelan (46.9%, a difference of 0.040%), Bermudan (46.9%, a difference of 0.070%), and Asian (46.9%, a difference of 0.10%).
| Demographics | Rating | Rank | Disability Age Over 75 |
| Lebanese | 87.0 /100 | #141 | Excellent 46.8% |
| Peruvians | 86.5 /100 | #142 | Excellent 46.8% |
| Bermudans | 85.6 /100 | #143 | Excellent 46.9% |
| Venezuelans | 85.0 /100 | #144 | Excellent 46.9% |
| Costa Ricans | 84.5 /100 | #145 | Excellent 46.9% |
| Guyanese | 84.3 /100 | #146 | Excellent 46.9% |
| Immigrants | Peru | 84.1 /100 | #147 | Excellent 46.9% |
| Asians | 81.6 /100 | #148 | Excellent 46.9% |
| Welsh | 81.3 /100 | #149 | Excellent 47.0% |
| Immigrants | Russia | 79.3 /100 | #150 | Good 47.0% |
| French Canadians | 79.0 /100 | #151 | Good 47.0% |
| Immigrants | Asia | 76.5 /100 | #152 | Good 47.0% |
| Immigrants | Zaire | 74.8 /100 | #153 | Good 47.1% |
| Immigrants | Belarus | 74.8 /100 | #154 | Good 47.1% |
| Immigrants | Iran | 74.7 /100 | #155 | Good 47.1% |
| Arabs | 73.3 /100 | #156 | Good 47.1% |
| Bhutanese | 72.6 /100 | #157 | Good 47.1% |
| Immigrants | Guyana | 71.9 /100 | #158 | Good 47.1% |
| Immigrants | Morocco | 71.4 /100 | #159 | Good 47.1% |
| Immigrants | Middle Africa | 68.3 /100 | #160 | Good 47.1% |
| South American Indians | 68.1 /100 | #161 | Good 47.1% |