Apache vs Immigrants from North America Disability Age Under 5
COMPARE
Apache
Immigrants from North America
Disability Age Under 5
Disability Age Under 5 Comparison
Apache
Immigrants from North America
2.0%
DISABILITY AGE UNDER 5
0.0/ 100
METRIC RATING
337th/ 347
METRIC RANK
1.4%
DISABILITY AGE UNDER 5
0.1/ 100
METRIC RATING
270th/ 347
METRIC RANK
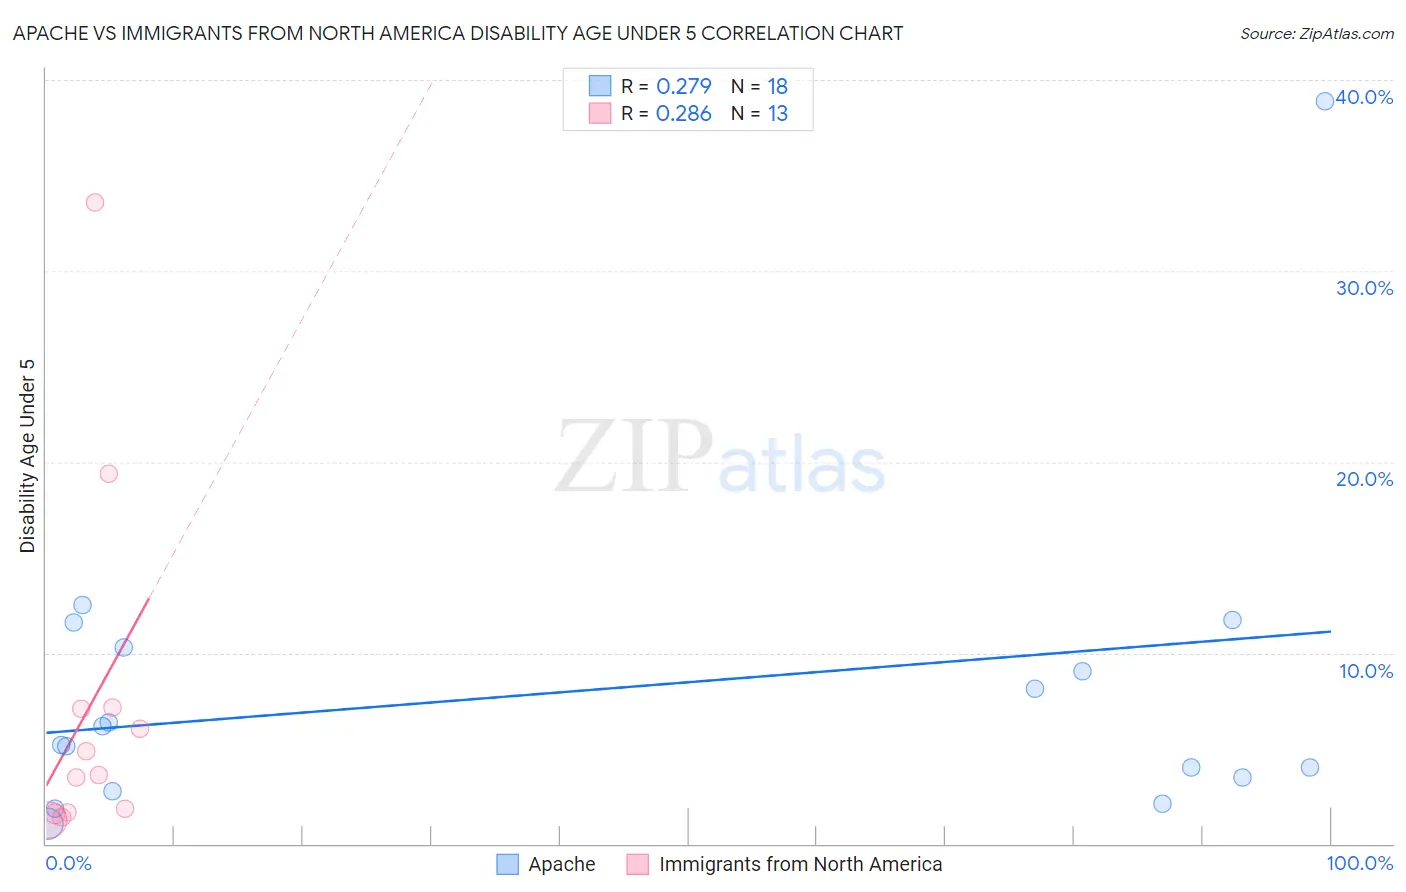
Apache vs Immigrants from North America Disability Age Under 5 Correlation Chart
The statistical analysis conducted on geographies consisting of 152,093,425 people shows a weak positive correlation between the proportion of Apache and percentage of population with a disability under the age of 5 in the United States with a correlation coefficient (R) of 0.279 and weighted average of 2.0%. Similarly, the statistical analysis conducted on geographies consisting of 235,432,695 people shows a weak positive correlation between the proportion of Immigrants from North America and percentage of population with a disability under the age of 5 in the United States with a correlation coefficient (R) of 0.286 and weighted average of 1.4%, a difference of 40.8%.
Disability Age Under 5 Correlation Summary
| Measurement | Apache | Immigrants from North America |
| Minimum | 1.1% | 1.3% |
| Maximum | 38.9% | 33.6% |
| Range | 37.8% | 32.3% |
| Mean | 8.0% | 7.1% |
| Median | 5.7% | 3.6% |
| Interquartile 25% (IQ1) | 3.5% | 1.6% |
| Interquartile 75% (IQ3) | 10.3% | 7.1% |
| Interquartile Range (IQR) | 6.8% | 5.5% |
| Standard Deviation (Sample) | 8.5% | 9.3% |
| Standard Deviation (Population) | 8.3% | 8.9% |
Similar Demographics by Disability Age Under 5
Demographics Similar to Apache by Disability Age Under 5
In terms of disability age under 5, the demographic groups most similar to Apache are Paraguayan (2.0%, a difference of 2.9%), Pennsylvania German (1.9%, a difference of 4.2%), Native/Alaskan (1.9%, a difference of 4.6%), Dutch West Indian (1.9%, a difference of 5.0%), and Tohono O'odham (2.2%, a difference of 7.6%).
| Demographics | Rating | Rank | Disability Age Under 5 |
| Choctaw | 0.0 /100 | #330 | Tragic 1.9% |
| French Canadians | 0.0 /100 | #331 | Tragic 1.9% |
| Chippewa | 0.0 /100 | #332 | Tragic 1.9% |
| Dutch West Indians | 0.0 /100 | #333 | Tragic 1.9% |
| Natives/Alaskans | 0.0 /100 | #334 | Tragic 1.9% |
| Pennsylvania Germans | 0.0 /100 | #335 | Tragic 1.9% |
| Paraguayans | 0.0 /100 | #336 | Tragic 2.0% |
| Apache | 0.0 /100 | #337 | Tragic 2.0% |
| Tohono O'odham | 0.0 /100 | #338 | Tragic 2.2% |
| Immigrants | Azores | 0.0 /100 | #339 | Tragic 2.2% |
| Menominee | 0.0 /100 | #340 | Tragic 2.3% |
| Tsimshian | 0.0 /100 | #341 | Tragic 2.4% |
| Alaska Natives | 0.0 /100 | #342 | Tragic 2.9% |
| Colville | 0.0 /100 | #343 | Tragic 3.3% |
| Inupiat | 0.0 /100 | #344 | Tragic 3.7% |
Demographics Similar to Immigrants from North America by Disability Age Under 5
In terms of disability age under 5, the demographic groups most similar to Immigrants from North America are Immigrants from Canada (1.4%, a difference of 0.040%), Austrian (1.4%, a difference of 0.13%), Black/African American (1.4%, a difference of 0.20%), Belgian (1.4%, a difference of 0.31%), and Alaskan Athabascan (1.5%, a difference of 0.50%).
| Demographics | Rating | Rank | Disability Age Under 5 |
| Spanish | 0.2 /100 | #263 | Tragic 1.4% |
| Yugoslavians | 0.1 /100 | #264 | Tragic 1.4% |
| Carpatho Rusyns | 0.1 /100 | #265 | Tragic 1.4% |
| Immigrants | Germany | 0.1 /100 | #266 | Tragic 1.4% |
| Cree | 0.1 /100 | #267 | Tragic 1.4% |
| Belgians | 0.1 /100 | #268 | Tragic 1.4% |
| Austrians | 0.1 /100 | #269 | Tragic 1.4% |
| Immigrants | North America | 0.1 /100 | #270 | Tragic 1.4% |
| Immigrants | Canada | 0.1 /100 | #271 | Tragic 1.4% |
| Blacks/African Americans | 0.1 /100 | #272 | Tragic 1.4% |
| Alaskan Athabascans | 0.1 /100 | #273 | Tragic 1.5% |
| Iroquois | 0.0 /100 | #274 | Tragic 1.5% |
| Brazilians | 0.0 /100 | #275 | Tragic 1.5% |
| Greeks | 0.0 /100 | #276 | Tragic 1.5% |
| Canadians | 0.0 /100 | #277 | Tragic 1.5% |