Apache vs Immigrants from Bosnia and Herzegovina Vision Disability
COMPARE
Apache
Immigrants from Bosnia and Herzegovina
Vision Disability
Vision Disability Comparison
Apache
Immigrants from Bosnia and Herzegovina
3.0%
VISION DISABILITY
0.0/ 100
METRIC RATING
329th/ 347
METRIC RANK
2.1%
VISION DISABILITY
81.5/ 100
METRIC RATING
145th/ 347
METRIC RANK
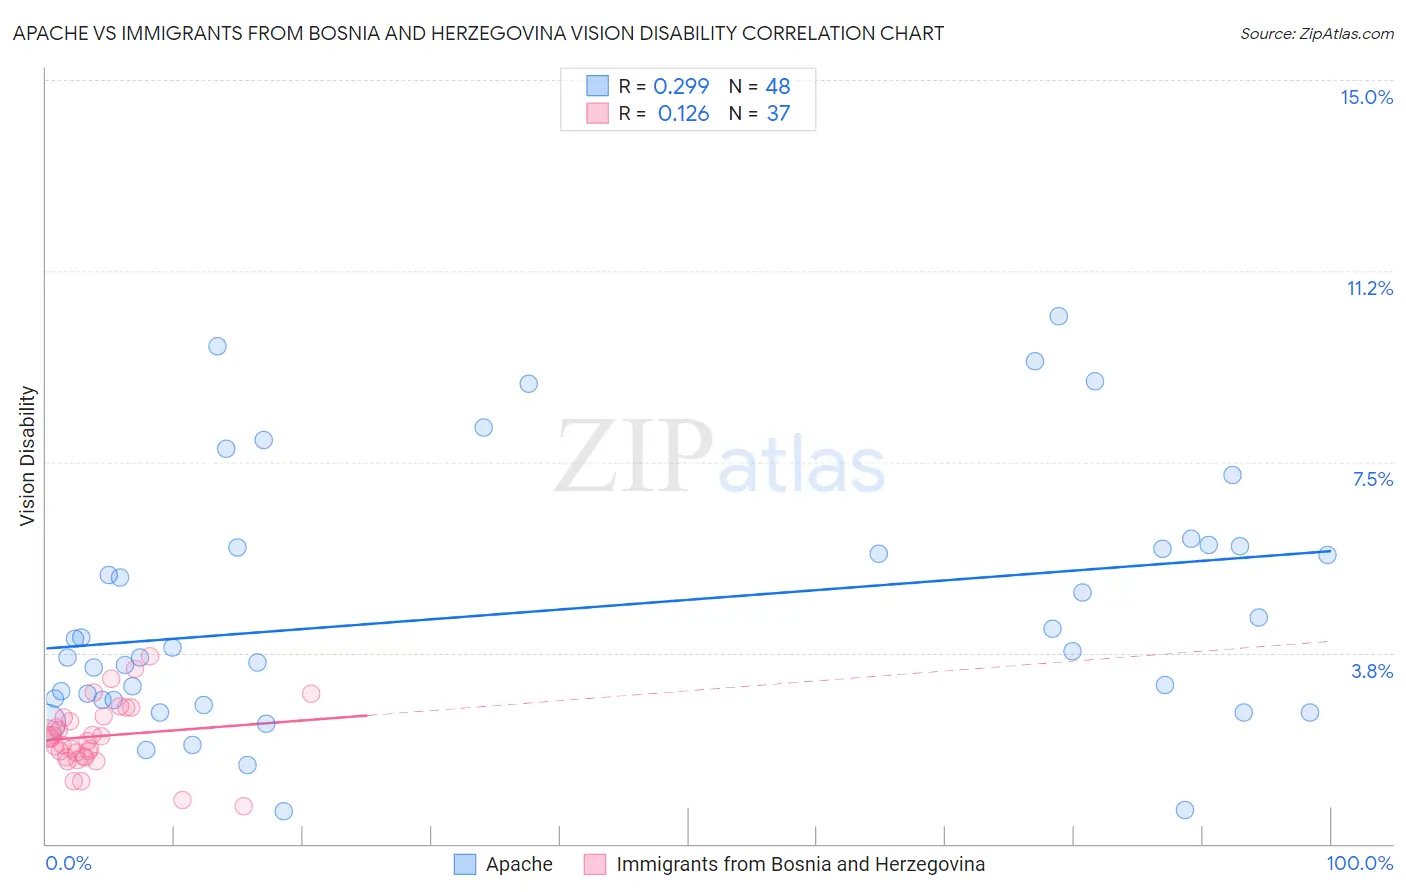
Apache vs Immigrants from Bosnia and Herzegovina Vision Disability Correlation Chart
The statistical analysis conducted on geographies consisting of 231,003,425 people shows a weak positive correlation between the proportion of Apache and percentage of population with vision disability in the United States with a correlation coefficient (R) of 0.299 and weighted average of 3.0%. Similarly, the statistical analysis conducted on geographies consisting of 156,802,362 people shows a poor positive correlation between the proportion of Immigrants from Bosnia and Herzegovina and percentage of population with vision disability in the United States with a correlation coefficient (R) of 0.126 and weighted average of 2.1%, a difference of 41.3%.
Vision Disability Correlation Summary
| Measurement | Apache | Immigrants from Bosnia and Herzegovina |
| Minimum | 0.65% | 0.75% |
| Maximum | 10.4% | 3.7% |
| Range | 9.7% | 2.9% |
| Mean | 4.6% | 2.1% |
| Median | 3.8% | 2.1% |
| Interquartile 25% (IQ1) | 2.8% | 1.7% |
| Interquartile 75% (IQ3) | 5.8% | 2.5% |
| Interquartile Range (IQR) | 3.0% | 0.80% |
| Standard Deviation (Sample) | 2.5% | 0.64% |
| Standard Deviation (Population) | 2.4% | 0.64% |
Similar Demographics by Vision Disability
Demographics Similar to Apache by Vision Disability
In terms of vision disability, the demographic groups most similar to Apache are Yuman (3.0%, a difference of 0.19%), Native/Alaskan (3.0%, a difference of 0.74%), Colville (3.0%, a difference of 1.2%), Spanish American (2.9%, a difference of 1.5%), and Central American Indian (3.0%, a difference of 1.8%).
| Demographics | Rating | Rank | Vision Disability |
| Paiute | 0.0 /100 | #322 | Tragic 2.9% |
| Tlingit-Haida | 0.0 /100 | #323 | Tragic 2.9% |
| Hopi | 0.0 /100 | #324 | Tragic 2.9% |
| Cherokee | 0.0 /100 | #325 | Tragic 2.9% |
| Spanish Americans | 0.0 /100 | #326 | Tragic 2.9% |
| Natives/Alaskans | 0.0 /100 | #327 | Tragic 3.0% |
| Yuman | 0.0 /100 | #328 | Tragic 3.0% |
| Apache | 0.0 /100 | #329 | Tragic 3.0% |
| Colville | 0.0 /100 | #330 | Tragic 3.0% |
| Central American Indians | 0.0 /100 | #331 | Tragic 3.0% |
| Seminole | 0.0 /100 | #332 | Tragic 3.1% |
| Cajuns | 0.0 /100 | #333 | Tragic 3.1% |
| Cheyenne | 0.0 /100 | #334 | Tragic 3.1% |
| Navajo | 0.0 /100 | #335 | Tragic 3.1% |
| Alaskan Athabascans | 0.0 /100 | #336 | Tragic 3.1% |
Demographics Similar to Immigrants from Bosnia and Herzegovina by Vision Disability
In terms of vision disability, the demographic groups most similar to Immigrants from Bosnia and Herzegovina are Ukrainian (2.1%, a difference of 0.040%), South American (2.1%, a difference of 0.15%), Immigrants from Sierra Leone (2.1%, a difference of 0.15%), Italian (2.1%, a difference of 0.18%), and Sierra Leonean (2.1%, a difference of 0.30%).
| Demographics | Rating | Rank | Vision Disability |
| Arabs | 86.3 /100 | #138 | Excellent 2.1% |
| Immigrants | Morocco | 85.2 /100 | #139 | Excellent 2.1% |
| Immigrants | Netherlands | 84.2 /100 | #140 | Excellent 2.1% |
| Sierra Leoneans | 84.1 /100 | #141 | Excellent 2.1% |
| South Americans | 82.8 /100 | #142 | Excellent 2.1% |
| Immigrants | Sierra Leone | 82.8 /100 | #143 | Excellent 2.1% |
| Ukrainians | 81.9 /100 | #144 | Excellent 2.1% |
| Immigrants | Bosnia and Herzegovina | 81.5 /100 | #145 | Excellent 2.1% |
| Italians | 79.7 /100 | #146 | Good 2.1% |
| Immigrants | Sudan | 78.4 /100 | #147 | Good 2.1% |
| Finns | 78.3 /100 | #148 | Good 2.1% |
| Colombians | 76.2 /100 | #149 | Good 2.1% |
| Belgians | 75.9 /100 | #150 | Good 2.1% |
| Immigrants | Norway | 75.5 /100 | #151 | Good 2.1% |
| Immigrants | Southern Europe | 74.6 /100 | #152 | Good 2.1% |