Apache vs Guyanese Vision Disability
COMPARE
Apache
Guyanese
Vision Disability
Vision Disability Comparison
Apache
Guyanese
3.0%
VISION DISABILITY
0.0/ 100
METRIC RATING
329th/ 347
METRIC RANK
2.2%
VISION DISABILITY
28.9/ 100
METRIC RATING
188th/ 347
METRIC RANK
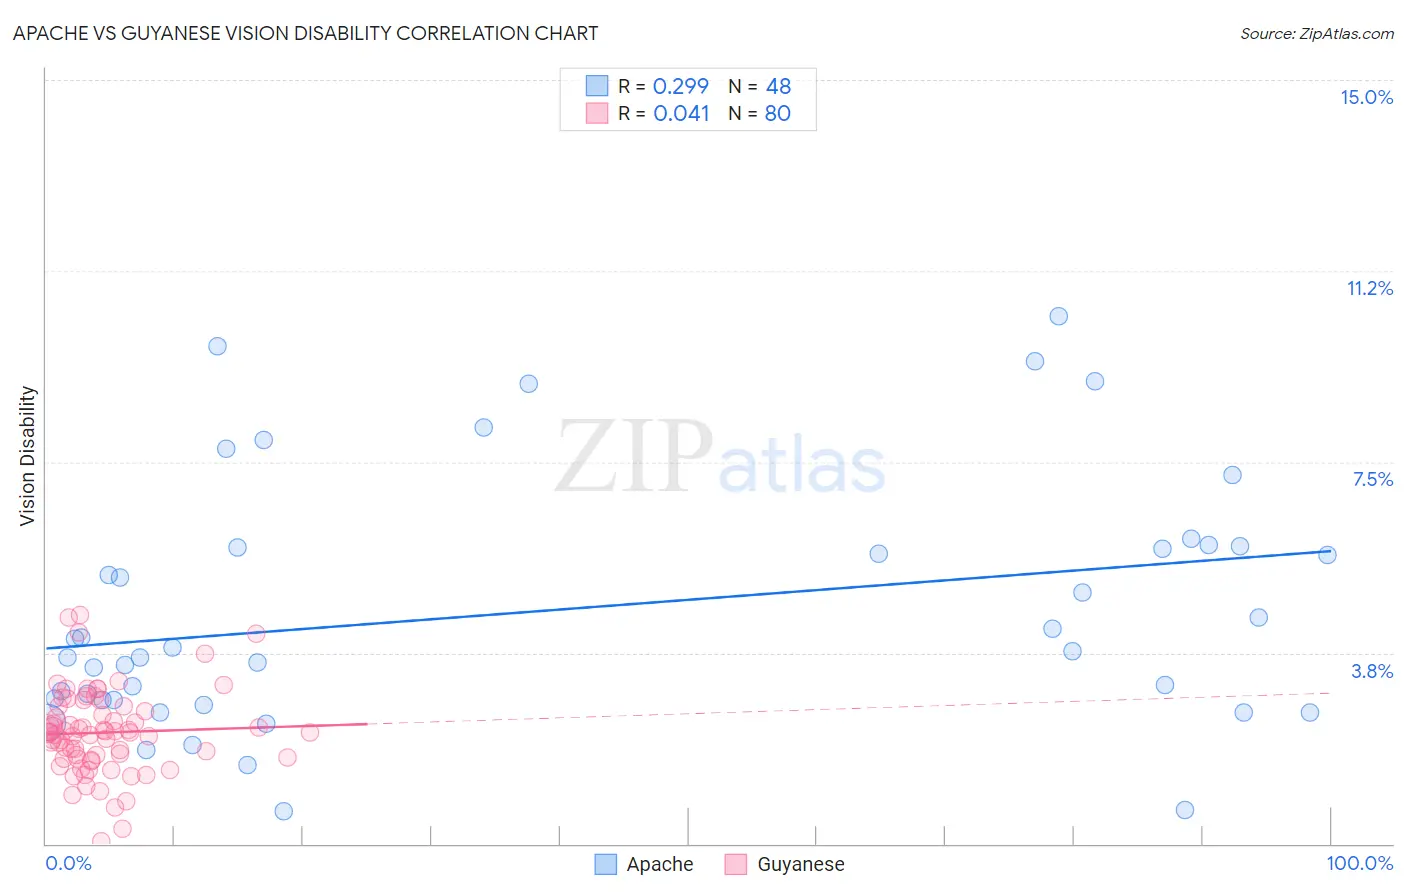
Apache vs Guyanese Vision Disability Correlation Chart
The statistical analysis conducted on geographies consisting of 231,003,425 people shows a weak positive correlation between the proportion of Apache and percentage of population with vision disability in the United States with a correlation coefficient (R) of 0.299 and weighted average of 3.0%. Similarly, the statistical analysis conducted on geographies consisting of 176,846,662 people shows no correlation between the proportion of Guyanese and percentage of population with vision disability in the United States with a correlation coefficient (R) of 0.041 and weighted average of 2.2%, a difference of 36.1%.
Vision Disability Correlation Summary
| Measurement | Apache | Guyanese |
| Minimum | 0.65% | 0.061% |
| Maximum | 10.4% | 4.5% |
| Range | 9.7% | 4.4% |
| Mean | 4.6% | 2.2% |
| Median | 3.8% | 2.2% |
| Interquartile 25% (IQ1) | 2.8% | 1.7% |
| Interquartile 75% (IQ3) | 5.8% | 2.6% |
| Interquartile Range (IQR) | 3.0% | 0.97% |
| Standard Deviation (Sample) | 2.5% | 0.83% |
| Standard Deviation (Population) | 2.4% | 0.82% |
Similar Demographics by Vision Disability
Demographics Similar to Apache by Vision Disability
In terms of vision disability, the demographic groups most similar to Apache are Yuman (3.0%, a difference of 0.19%), Native/Alaskan (3.0%, a difference of 0.74%), Colville (3.0%, a difference of 1.2%), Spanish American (2.9%, a difference of 1.5%), and Central American Indian (3.0%, a difference of 1.8%).
| Demographics | Rating | Rank | Vision Disability |
| Paiute | 0.0 /100 | #322 | Tragic 2.9% |
| Tlingit-Haida | 0.0 /100 | #323 | Tragic 2.9% |
| Hopi | 0.0 /100 | #324 | Tragic 2.9% |
| Cherokee | 0.0 /100 | #325 | Tragic 2.9% |
| Spanish Americans | 0.0 /100 | #326 | Tragic 2.9% |
| Natives/Alaskans | 0.0 /100 | #327 | Tragic 3.0% |
| Yuman | 0.0 /100 | #328 | Tragic 3.0% |
| Apache | 0.0 /100 | #329 | Tragic 3.0% |
| Colville | 0.0 /100 | #330 | Tragic 3.0% |
| Central American Indians | 0.0 /100 | #331 | Tragic 3.0% |
| Seminole | 0.0 /100 | #332 | Tragic 3.1% |
| Cajuns | 0.0 /100 | #333 | Tragic 3.1% |
| Cheyenne | 0.0 /100 | #334 | Tragic 3.1% |
| Navajo | 0.0 /100 | #335 | Tragic 3.1% |
| Alaskan Athabascans | 0.0 /100 | #336 | Tragic 3.1% |
Demographics Similar to Guyanese by Vision Disability
In terms of vision disability, the demographic groups most similar to Guyanese are Immigrants from St. Vincent and the Grenadines (2.2%, a difference of 0.11%), Salvadoran (2.2%, a difference of 0.11%), Immigrants from Costa Rica (2.2%, a difference of 0.22%), Canadian (2.2%, a difference of 0.24%), and European (2.2%, a difference of 0.24%).
| Demographics | Rating | Rank | Vision Disability |
| Immigrants | Western Europe | 41.1 /100 | #181 | Average 2.2% |
| Costa Ricans | 40.7 /100 | #182 | Average 2.2% |
| Immigrants | Burma/Myanmar | 37.9 /100 | #183 | Fair 2.2% |
| Moroccans | 35.4 /100 | #184 | Fair 2.2% |
| Immigrants | Middle Africa | 33.5 /100 | #185 | Fair 2.2% |
| Native Hawaiians | 33.3 /100 | #186 | Fair 2.2% |
| Immigrants | St. Vincent and the Grenadines | 30.3 /100 | #187 | Fair 2.2% |
| Guyanese | 28.9 /100 | #188 | Fair 2.2% |
| Salvadorans | 27.4 /100 | #189 | Fair 2.2% |
| Immigrants | Costa Rica | 26.1 /100 | #190 | Fair 2.2% |
| Canadians | 25.8 /100 | #191 | Fair 2.2% |
| Europeans | 25.7 /100 | #192 | Fair 2.2% |
| British | 25.1 /100 | #193 | Fair 2.2% |
| Immigrants | Barbados | 24.0 /100 | #194 | Fair 2.2% |
| Immigrants | Immigrants | 23.7 /100 | #195 | Fair 2.2% |