Apache vs Sudanese Vision Disability
COMPARE
Apache
Sudanese
Vision Disability
Vision Disability Comparison
Apache
Sudanese
3.0%
VISION DISABILITY
0.0/ 100
METRIC RATING
329th/ 347
METRIC RANK
2.1%
VISION DISABILITY
89.2/ 100
METRIC RATING
127th/ 347
METRIC RANK
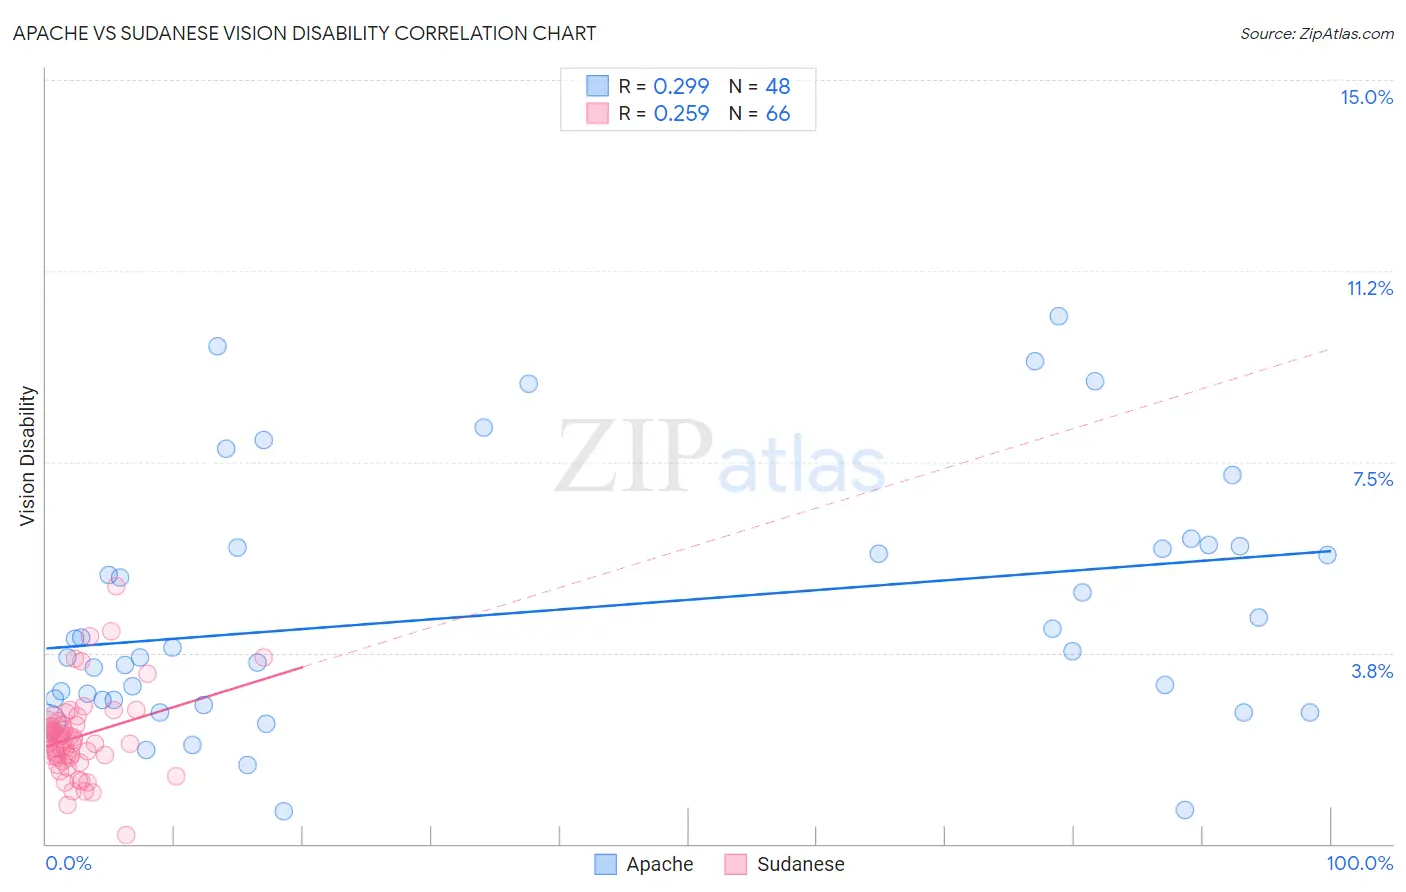
Apache vs Sudanese Vision Disability Correlation Chart
The statistical analysis conducted on geographies consisting of 231,003,425 people shows a weak positive correlation between the proportion of Apache and percentage of population with vision disability in the United States with a correlation coefficient (R) of 0.299 and weighted average of 3.0%. Similarly, the statistical analysis conducted on geographies consisting of 110,115,679 people shows a weak positive correlation between the proportion of Sudanese and percentage of population with vision disability in the United States with a correlation coefficient (R) of 0.259 and weighted average of 2.1%, a difference of 42.8%.
Vision Disability Correlation Summary
| Measurement | Apache | Sudanese |
| Minimum | 0.65% | 0.17% |
| Maximum | 10.4% | 5.1% |
| Range | 9.7% | 4.9% |
| Mean | 4.6% | 2.1% |
| Median | 3.8% | 2.0% |
| Interquartile 25% (IQ1) | 2.8% | 1.7% |
| Interquartile 75% (IQ3) | 5.8% | 2.3% |
| Interquartile Range (IQR) | 3.0% | 0.64% |
| Standard Deviation (Sample) | 2.5% | 0.82% |
| Standard Deviation (Population) | 2.4% | 0.81% |
Similar Demographics by Vision Disability
Demographics Similar to Apache by Vision Disability
In terms of vision disability, the demographic groups most similar to Apache are Yuman (3.0%, a difference of 0.19%), Native/Alaskan (3.0%, a difference of 0.74%), Colville (3.0%, a difference of 1.2%), Spanish American (2.9%, a difference of 1.5%), and Central American Indian (3.0%, a difference of 1.8%).
| Demographics | Rating | Rank | Vision Disability |
| Paiute | 0.0 /100 | #322 | Tragic 2.9% |
| Tlingit-Haida | 0.0 /100 | #323 | Tragic 2.9% |
| Hopi | 0.0 /100 | #324 | Tragic 2.9% |
| Cherokee | 0.0 /100 | #325 | Tragic 2.9% |
| Spanish Americans | 0.0 /100 | #326 | Tragic 2.9% |
| Natives/Alaskans | 0.0 /100 | #327 | Tragic 3.0% |
| Yuman | 0.0 /100 | #328 | Tragic 3.0% |
| Apache | 0.0 /100 | #329 | Tragic 3.0% |
| Colville | 0.0 /100 | #330 | Tragic 3.0% |
| Central American Indians | 0.0 /100 | #331 | Tragic 3.0% |
| Seminole | 0.0 /100 | #332 | Tragic 3.1% |
| Cajuns | 0.0 /100 | #333 | Tragic 3.1% |
| Cheyenne | 0.0 /100 | #334 | Tragic 3.1% |
| Navajo | 0.0 /100 | #335 | Tragic 3.1% |
| Alaskan Athabascans | 0.0 /100 | #336 | Tragic 3.1% |
Demographics Similar to Sudanese by Vision Disability
In terms of vision disability, the demographic groups most similar to Sudanese are Immigrants from Chile (2.1%, a difference of 0.030%), Immigrants from Peru (2.1%, a difference of 0.060%), Immigrants from Cameroon (2.1%, a difference of 0.070%), Immigrants from Kenya (2.1%, a difference of 0.070%), and Immigrants from Hungary (2.1%, a difference of 0.090%).
| Demographics | Rating | Rank | Vision Disability |
| Immigrants | Zimbabwe | 91.0 /100 | #120 | Exceptional 2.1% |
| Immigrants | Scotland | 90.4 /100 | #121 | Exceptional 2.1% |
| Immigrants | Ukraine | 90.4 /100 | #122 | Exceptional 2.1% |
| Immigrants | Albania | 90.4 /100 | #123 | Exceptional 2.1% |
| Immigrants | Spain | 89.8 /100 | #124 | Excellent 2.1% |
| Immigrants | Venezuela | 89.8 /100 | #125 | Excellent 2.1% |
| Immigrants | Peru | 89.5 /100 | #126 | Excellent 2.1% |
| Sudanese | 89.2 /100 | #127 | Excellent 2.1% |
| Immigrants | Chile | 89.0 /100 | #128 | Excellent 2.1% |
| Immigrants | Cameroon | 88.8 /100 | #129 | Excellent 2.1% |
| Immigrants | Kenya | 88.7 /100 | #130 | Excellent 2.1% |
| Immigrants | Hungary | 88.7 /100 | #131 | Excellent 2.1% |
| New Zealanders | 88.2 /100 | #132 | Excellent 2.1% |
| Syrians | 87.5 /100 | #133 | Excellent 2.1% |
| Venezuelans | 87.2 /100 | #134 | Excellent 2.1% |