Peruvian vs English Vision Disability
COMPARE
Peruvian
English
Vision Disability
Vision Disability Comparison
Peruvians
English
2.1%
VISION DISABILITY
93.5/ 100
METRIC RATING
111th/ 347
METRIC RANK
2.3%
VISION DISABILITY
1.1/ 100
METRIC RATING
239th/ 347
METRIC RANK
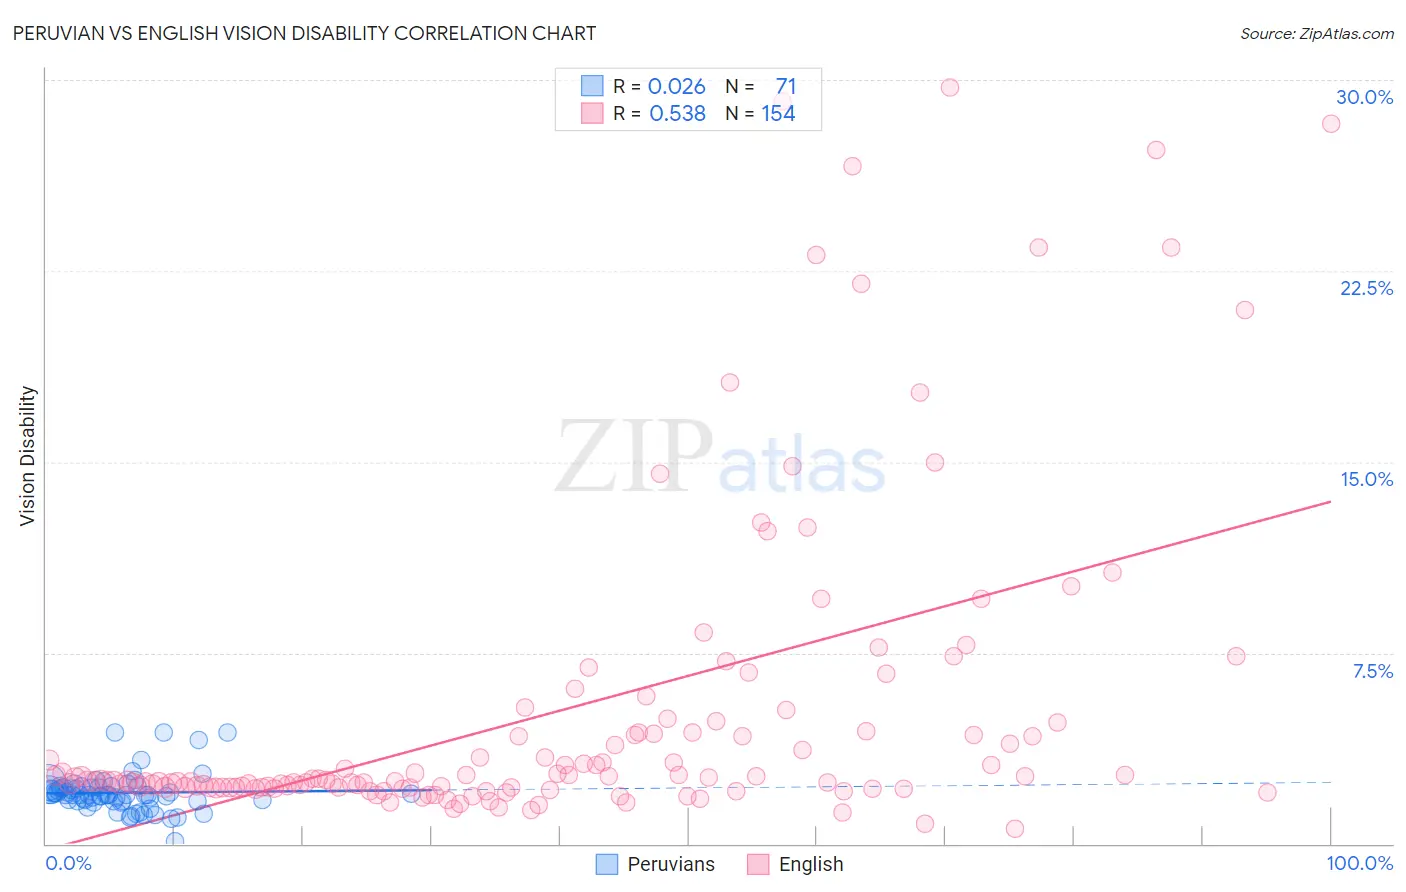
Peruvian vs English Vision Disability Correlation Chart
The statistical analysis conducted on geographies consisting of 363,040,425 people shows no correlation between the proportion of Peruvians and percentage of population with vision disability in the United States with a correlation coefficient (R) of 0.026 and weighted average of 2.1%. Similarly, the statistical analysis conducted on geographies consisting of 576,976,464 people shows a substantial positive correlation between the proportion of English and percentage of population with vision disability in the United States with a correlation coefficient (R) of 0.538 and weighted average of 2.3%, a difference of 11.8%.
Vision Disability Correlation Summary
| Measurement | Peruvian | English |
| Minimum | 0.11% | 0.59% |
| Maximum | 4.4% | 29.7% |
| Range | 4.3% | 29.1% |
| Mean | 2.0% | 5.2% |
| Median | 1.9% | 2.5% |
| Interquartile 25% (IQ1) | 1.7% | 2.2% |
| Interquartile 75% (IQ3) | 2.2% | 4.4% |
| Interquartile Range (IQR) | 0.56% | 2.2% |
| Standard Deviation (Sample) | 0.75% | 6.3% |
| Standard Deviation (Population) | 0.74% | 6.2% |
Similar Demographics by Vision Disability
Demographics Similar to Peruvians by Vision Disability
In terms of vision disability, the demographic groups most similar to Peruvians are Immigrants from Armenia (2.1%, a difference of 0.060%), Chilean (2.1%, a difference of 0.13%), Korean (2.1%, a difference of 0.15%), Immigrants from Denmark (2.1%, a difference of 0.16%), and Danish (2.1%, a difference of 0.17%).
| Demographics | Rating | Rank | Vision Disability |
| Immigrants | Italy | 94.4 /100 | #104 | Exceptional 2.1% |
| Carpatho Rusyns | 94.3 /100 | #105 | Exceptional 2.1% |
| Swedes | 94.2 /100 | #106 | Exceptional 2.1% |
| Danes | 94.2 /100 | #107 | Exceptional 2.1% |
| Koreans | 94.1 /100 | #108 | Exceptional 2.1% |
| Chileans | 94.0 /100 | #109 | Exceptional 2.1% |
| Immigrants | Armenia | 93.8 /100 | #110 | Exceptional 2.1% |
| Peruvians | 93.5 /100 | #111 | Exceptional 2.1% |
| Immigrants | Denmark | 92.9 /100 | #112 | Exceptional 2.1% |
| Kenyans | 92.5 /100 | #113 | Exceptional 2.1% |
| Croatians | 92.3 /100 | #114 | Exceptional 2.1% |
| Immigrants | Vietnam | 92.2 /100 | #115 | Exceptional 2.1% |
| Ugandans | 92.2 /100 | #116 | Exceptional 2.1% |
| Poles | 92.0 /100 | #117 | Exceptional 2.1% |
| Immigrants | Philippines | 91.4 /100 | #118 | Exceptional 2.1% |
Demographics Similar to English by Vision Disability
In terms of vision disability, the demographic groups most similar to English are Immigrants from Cambodia (2.3%, a difference of 0.020%), Panamanian (2.3%, a difference of 0.25%), Immigrants from Portugal (2.3%, a difference of 0.29%), Malaysian (2.3%, a difference of 0.29%), and Immigrants from Congo (2.3%, a difference of 0.34%).
| Demographics | Rating | Rank | Vision Disability |
| German Russians | 1.8 /100 | #232 | Tragic 2.3% |
| Central Americans | 1.8 /100 | #233 | Tragic 2.3% |
| Scottish | 1.6 /100 | #234 | Tragic 2.3% |
| Marshallese | 1.5 /100 | #235 | Tragic 2.3% |
| Immigrants | Congo | 1.4 /100 | #236 | Tragic 2.3% |
| Immigrants | Portugal | 1.4 /100 | #237 | Tragic 2.3% |
| Immigrants | Cambodia | 1.1 /100 | #238 | Tragic 2.3% |
| English | 1.1 /100 | #239 | Tragic 2.3% |
| Panamanians | 0.9 /100 | #240 | Tragic 2.3% |
| Malaysians | 0.9 /100 | #241 | Tragic 2.3% |
| Immigrants | Panama | 0.8 /100 | #242 | Tragic 2.3% |
| Immigrants | Nicaragua | 0.6 /100 | #243 | Tragic 2.3% |
| Immigrants | West Indies | 0.6 /100 | #244 | Tragic 2.3% |
| Alsatians | 0.6 /100 | #245 | Tragic 2.3% |
| French | 0.5 /100 | #246 | Tragic 2.3% |