Hmong vs English Vision Disability
COMPARE
Hmong
English
Vision Disability
Vision Disability Comparison
Hmong
English
2.3%
VISION DISABILITY
2.5/ 100
METRIC RATING
228th/ 347
METRIC RANK
2.3%
VISION DISABILITY
1.1/ 100
METRIC RATING
239th/ 347
METRIC RANK
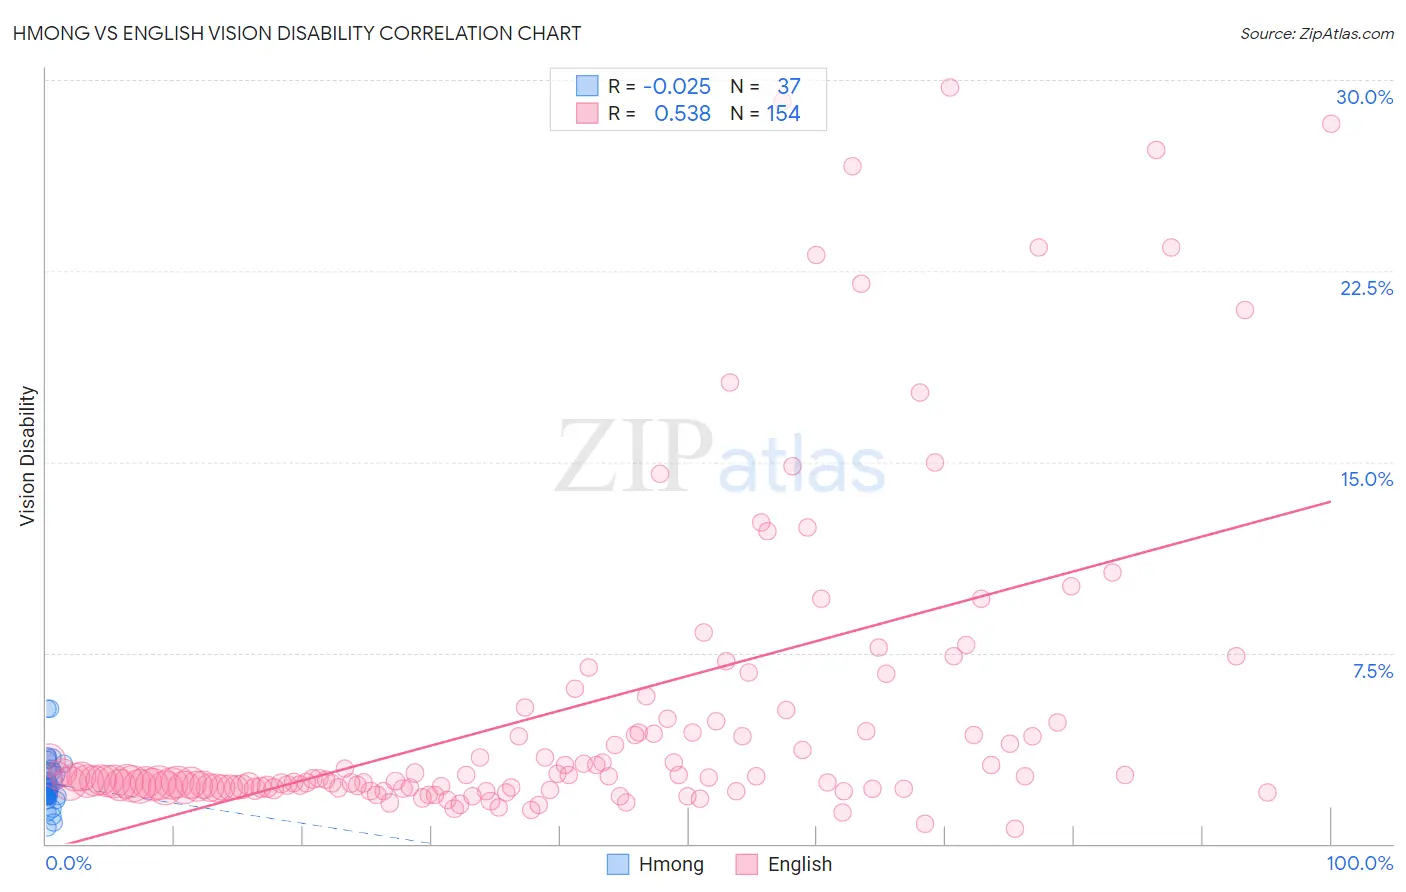
Hmong vs English Vision Disability Correlation Chart
The statistical analysis conducted on geographies consisting of 24,669,236 people shows no correlation between the proportion of Hmong and percentage of population with vision disability in the United States with a correlation coefficient (R) of -0.025 and weighted average of 2.3%. Similarly, the statistical analysis conducted on geographies consisting of 576,976,464 people shows a substantial positive correlation between the proportion of English and percentage of population with vision disability in the United States with a correlation coefficient (R) of 0.538 and weighted average of 2.3%, a difference of 1.2%.
Vision Disability Correlation Summary
| Measurement | Hmong | English |
| Minimum | 0.63% | 0.59% |
| Maximum | 5.3% | 29.7% |
| Range | 4.7% | 29.1% |
| Mean | 2.4% | 5.2% |
| Median | 2.2% | 2.5% |
| Interquartile 25% (IQ1) | 1.9% | 2.2% |
| Interquartile 75% (IQ3) | 2.8% | 4.4% |
| Interquartile Range (IQR) | 0.96% | 2.2% |
| Standard Deviation (Sample) | 0.98% | 6.3% |
| Standard Deviation (Population) | 0.97% | 6.2% |
Demographics Similar to Hmong and English by Vision Disability
In terms of vision disability, the demographic groups most similar to Hmong are Welsh (2.3%, a difference of 0.080%), Nicaraguan (2.3%, a difference of 0.15%), Hawaiian (2.3%, a difference of 0.24%), Immigrants from Germany (2.3%, a difference of 0.29%), and Immigrants from Ecuador (2.3%, a difference of 0.31%). Similarly, the demographic groups most similar to English are Immigrants from Cambodia (2.3%, a difference of 0.020%), Panamanian (2.3%, a difference of 0.25%), Immigrants from Portugal (2.3%, a difference of 0.29%), Malaysian (2.3%, a difference of 0.29%), and Immigrants from Congo (2.3%, a difference of 0.34%).
| Demographics | Rating | Rank | Vision Disability |
| Basques | 3.5 /100 | #223 | Tragic 2.3% |
| Irish | 3.4 /100 | #224 | Tragic 2.3% |
| Immigrants | Western Africa | 3.4 /100 | #225 | Tragic 2.3% |
| Immigrants | Germany | 3.0 /100 | #226 | Tragic 2.3% |
| Hawaiians | 2.9 /100 | #227 | Tragic 2.3% |
| Hmong | 2.5 /100 | #228 | Tragic 2.3% |
| Welsh | 2.3 /100 | #229 | Tragic 2.3% |
| Nicaraguans | 2.2 /100 | #230 | Tragic 2.3% |
| Immigrants | Ecuador | 2.0 /100 | #231 | Tragic 2.3% |
| German Russians | 1.8 /100 | #232 | Tragic 2.3% |
| Central Americans | 1.8 /100 | #233 | Tragic 2.3% |
| Scottish | 1.6 /100 | #234 | Tragic 2.3% |
| Marshallese | 1.5 /100 | #235 | Tragic 2.3% |
| Immigrants | Congo | 1.4 /100 | #236 | Tragic 2.3% |
| Immigrants | Portugal | 1.4 /100 | #237 | Tragic 2.3% |
| Immigrants | Cambodia | 1.1 /100 | #238 | Tragic 2.3% |
| English | 1.1 /100 | #239 | Tragic 2.3% |
| Panamanians | 0.9 /100 | #240 | Tragic 2.3% |
| Malaysians | 0.9 /100 | #241 | Tragic 2.3% |
| Immigrants | Panama | 0.8 /100 | #242 | Tragic 2.3% |
| Immigrants | Nicaragua | 0.6 /100 | #243 | Tragic 2.3% |