Immigrants from Netherlands vs Icelander Male Disability
COMPARE
Immigrants from Netherlands
Icelander
Male Disability
Male Disability Comparison
Immigrants from Netherlands
Icelanders
11.4%
MALE DISABILITY
25.9/ 100
METRIC RATING
189th/ 347
METRIC RANK
11.6%
MALE DISABILITY
10.1/ 100
METRIC RATING
208th/ 347
METRIC RANK
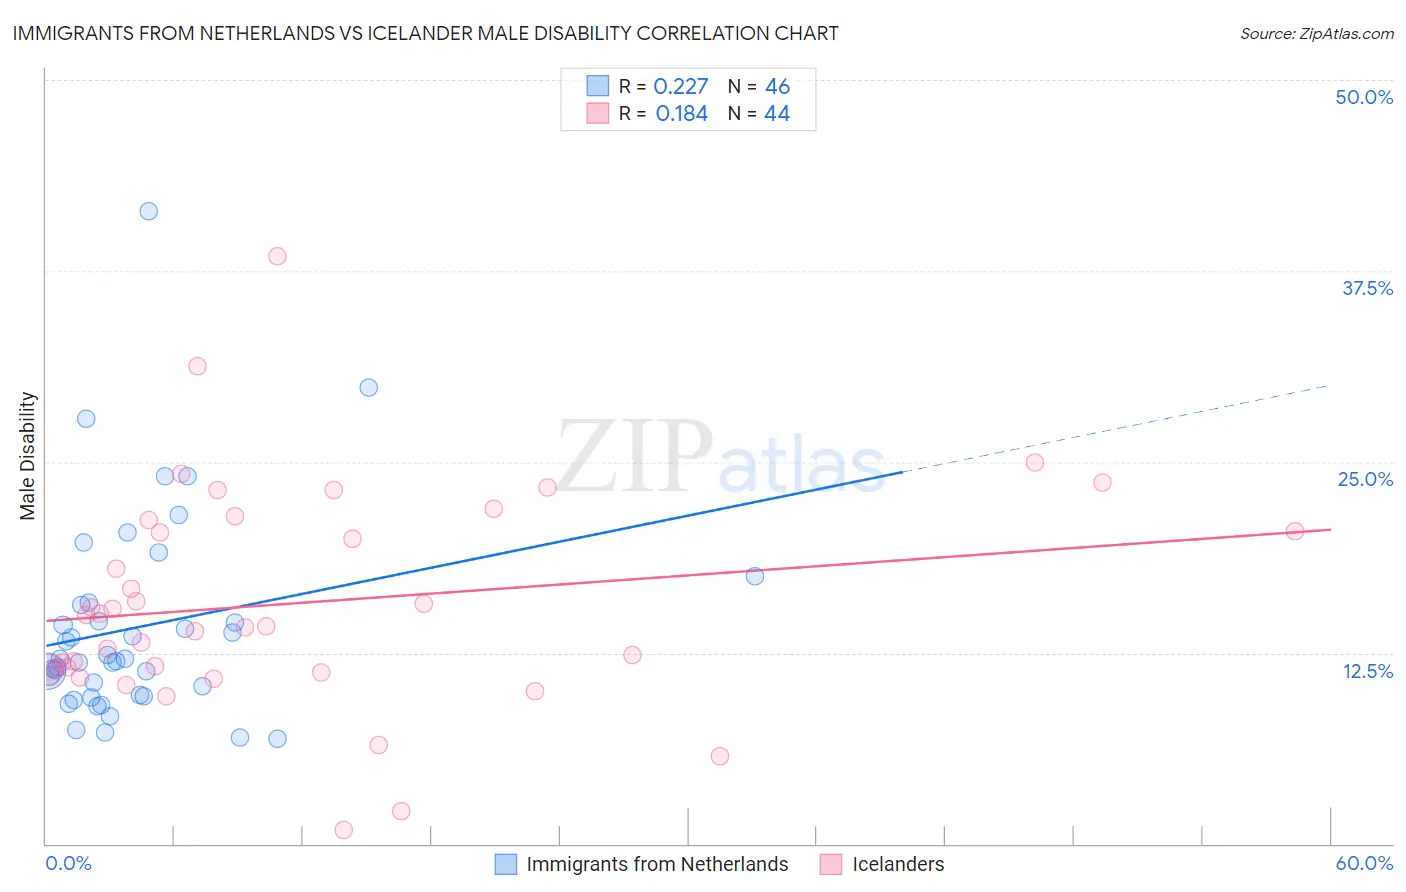
Immigrants from Netherlands vs Icelander Male Disability Correlation Chart
The statistical analysis conducted on geographies consisting of 237,879,390 people shows a weak positive correlation between the proportion of Immigrants from Netherlands and percentage of males with a disability in the United States with a correlation coefficient (R) of 0.227 and weighted average of 11.4%. Similarly, the statistical analysis conducted on geographies consisting of 159,644,082 people shows a poor positive correlation between the proportion of Icelanders and percentage of males with a disability in the United States with a correlation coefficient (R) of 0.184 and weighted average of 11.6%, a difference of 1.5%.
Male Disability Correlation Summary
| Measurement | Immigrants from Netherlands | Icelander |
| Minimum | 6.9% | 0.92% |
| Maximum | 41.4% | 38.5% |
| Range | 34.5% | 37.5% |
| Mean | 14.2% | 15.8% |
| Median | 12.0% | 14.6% |
| Interquartile 25% (IQ1) | 9.8% | 11.4% |
| Interquartile 75% (IQ3) | 15.6% | 20.8% |
| Interquartile Range (IQR) | 5.8% | 9.4% |
| Standard Deviation (Sample) | 6.7% | 7.2% |
| Standard Deviation (Population) | 6.6% | 7.1% |
Demographics Similar to Immigrants from Netherlands and Icelanders by Male Disability
In terms of male disability, the demographic groups most similar to Immigrants from Netherlands are Immigrants from Bosnia and Herzegovina (11.4%, a difference of 0.040%), Estonian (11.4%, a difference of 0.060%), Senegalese (11.4%, a difference of 0.20%), Assyrian/Chaldean/Syriac (11.4%, a difference of 0.20%), and Greek (11.4%, a difference of 0.28%). Similarly, the demographic groups most similar to Icelanders are Immigrants from Somalia (11.5%, a difference of 0.040%), Ukrainian (11.5%, a difference of 0.070%), Serbian (11.5%, a difference of 0.080%), Immigrants from Cambodia (11.5%, a difference of 0.090%), and Jamaican (11.5%, a difference of 0.10%).
| Demographics | Rating | Rank | Male Disability |
| Estonians | 26.8 /100 | #188 | Fair 11.4% |
| Immigrants | Netherlands | 25.9 /100 | #189 | Fair 11.4% |
| Immigrants | Bosnia and Herzegovina | 25.4 /100 | #190 | Fair 11.4% |
| Senegalese | 23.2 /100 | #191 | Fair 11.4% |
| Assyrians/Chaldeans/Syriacs | 23.2 /100 | #192 | Fair 11.4% |
| Greeks | 22.2 /100 | #193 | Fair 11.4% |
| Belizeans | 21.2 /100 | #194 | Fair 11.4% |
| Immigrants | Oceania | 20.9 /100 | #195 | Fair 11.4% |
| West Indians | 18.4 /100 | #196 | Poor 11.4% |
| Somalis | 18.2 /100 | #197 | Poor 11.4% |
| Immigrants | Jamaica | 16.3 /100 | #198 | Poor 11.5% |
| Lebanese | 15.4 /100 | #199 | Poor 11.5% |
| Immigrants | Iraq | 13.0 /100 | #200 | Poor 11.5% |
| Immigrants | Panama | 13.0 /100 | #201 | Poor 11.5% |
| Immigrants | Mexico | 12.6 /100 | #202 | Poor 11.5% |
| Jamaicans | 10.9 /100 | #203 | Poor 11.5% |
| Immigrants | Cambodia | 10.8 /100 | #204 | Poor 11.5% |
| Serbians | 10.7 /100 | #205 | Poor 11.5% |
| Ukrainians | 10.6 /100 | #206 | Poor 11.5% |
| Immigrants | Somalia | 10.4 /100 | #207 | Poor 11.5% |
| Icelanders | 10.1 /100 | #208 | Poor 11.6% |