American vs Immigrants from Turkey Disability Age Under 5
COMPARE
American
Immigrants from Turkey
Disability Age Under 5
Disability Age Under 5 Comparison
Americans
Immigrants from Turkey
1.9%
DISABILITY AGE UNDER 5
0.0/ 100
METRIC RATING
328th/ 347
METRIC RANK
1.1%
DISABILITY AGE UNDER 5
99.8/ 100
METRIC RATING
45th/ 347
METRIC RANK
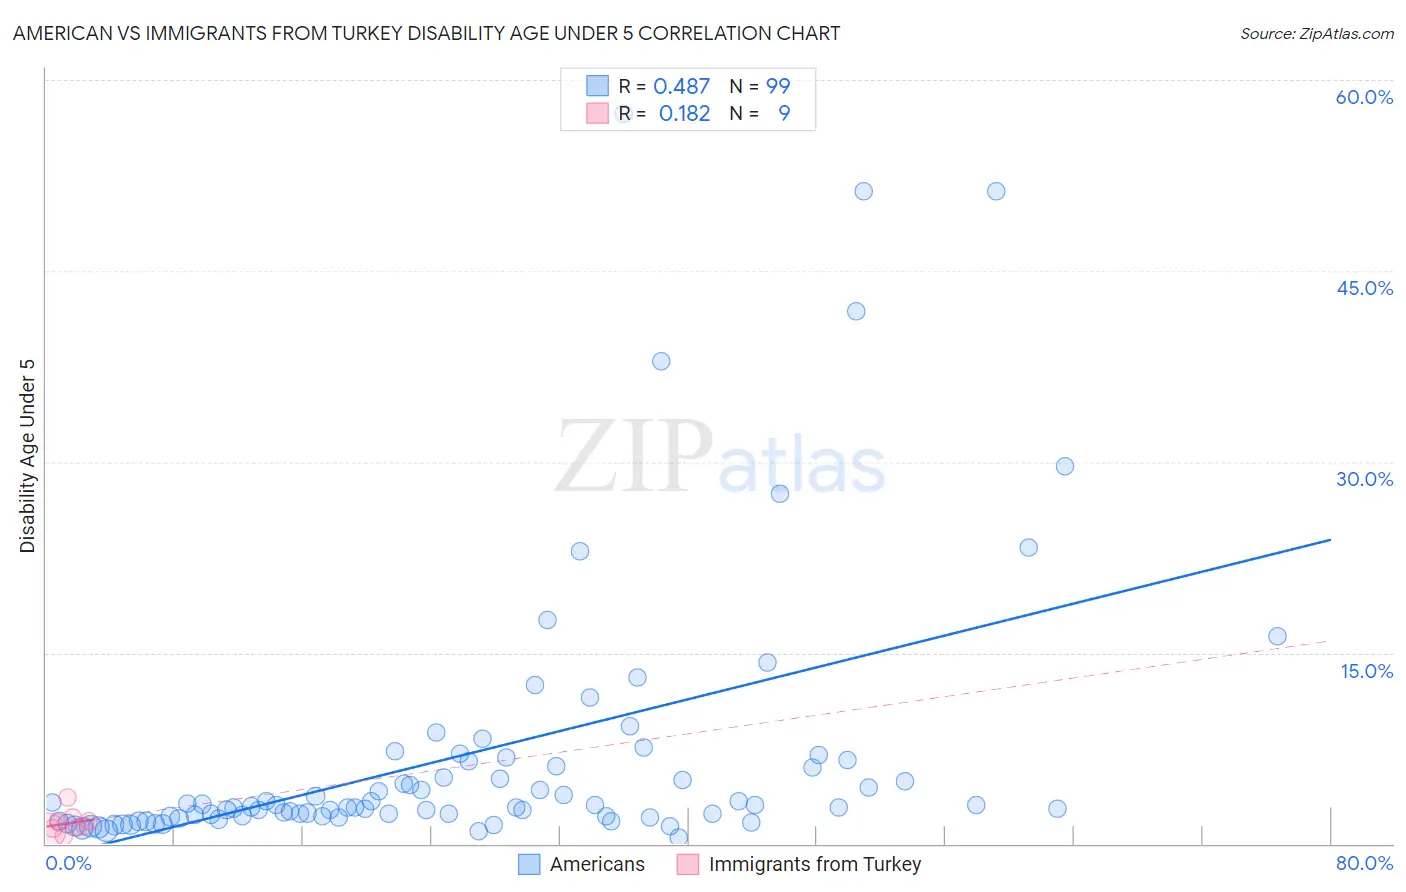
American vs Immigrants from Turkey Disability Age Under 5 Correlation Chart
The statistical analysis conducted on geographies consisting of 262,372,368 people shows a moderate positive correlation between the proportion of Americans and percentage of population with a disability under the age of 5 in the United States with a correlation coefficient (R) of 0.487 and weighted average of 1.9%. Similarly, the statistical analysis conducted on geographies consisting of 138,836,268 people shows a poor positive correlation between the proportion of Immigrants from Turkey and percentage of population with a disability under the age of 5 in the United States with a correlation coefficient (R) of 0.182 and weighted average of 1.1%, a difference of 74.6%.
Disability Age Under 5 Correlation Summary
| Measurement | American | Immigrants from Turkey |
| Minimum | 0.45% | 0.57% |
| Maximum | 57.3% | 3.7% |
| Range | 56.8% | 3.1% |
| Mean | 7.1% | 1.6% |
| Median | 2.9% | 1.4% |
| Interquartile 25% (IQ1) | 2.1% | 1.1% |
| Interquartile 75% (IQ3) | 6.5% | 1.9% |
| Interquartile Range (IQR) | 4.3% | 0.79% |
| Standard Deviation (Sample) | 11.0% | 0.89% |
| Standard Deviation (Population) | 11.0% | 0.83% |
Similar Demographics by Disability Age Under 5
Demographics Similar to Americans by Disability Age Under 5
In terms of disability age under 5, the demographic groups most similar to Americans are Houma (1.9%, a difference of 0.47%), Choctaw (1.9%, a difference of 0.80%), French Canadian (1.9%, a difference of 1.1%), Chippewa (1.9%, a difference of 1.2%), and Osage (1.8%, a difference of 1.7%).
| Demographics | Rating | Rank | Disability Age Under 5 |
| Ottawa | 0.0 /100 | #321 | Tragic 1.7% |
| Germans | 0.0 /100 | #322 | Tragic 1.7% |
| Chickasaw | 0.0 /100 | #323 | Tragic 1.7% |
| Cherokee | 0.0 /100 | #324 | Tragic 1.8% |
| Immigrants | Portugal | 0.0 /100 | #325 | Tragic 1.8% |
| Sioux | 0.0 /100 | #326 | Tragic 1.8% |
| Osage | 0.0 /100 | #327 | Tragic 1.8% |
| Americans | 0.0 /100 | #328 | Tragic 1.9% |
| Houma | 0.0 /100 | #329 | Tragic 1.9% |
| Choctaw | 0.0 /100 | #330 | Tragic 1.9% |
| French Canadians | 0.0 /100 | #331 | Tragic 1.9% |
| Chippewa | 0.0 /100 | #332 | Tragic 1.9% |
| Dutch West Indians | 0.0 /100 | #333 | Tragic 1.9% |
| Natives/Alaskans | 0.0 /100 | #334 | Tragic 1.9% |
| Pennsylvania Germans | 0.0 /100 | #335 | Tragic 1.9% |
Demographics Similar to Immigrants from Turkey by Disability Age Under 5
In terms of disability age under 5, the demographic groups most similar to Immigrants from Turkey are Immigrants from Asia (1.1%, a difference of 0.22%), Pima (1.1%, a difference of 0.32%), Immigrants from Bulgaria (1.1%, a difference of 0.33%), Immigrants from Congo (1.1%, a difference of 0.40%), and Thai (1.1%, a difference of 0.43%).
| Demographics | Rating | Rank | Disability Age Under 5 |
| Immigrants | Guyana | 99.9 /100 | #38 | Exceptional 1.0% |
| Filipinos | 99.9 /100 | #39 | Exceptional 1.1% |
| Immigrants | Albania | 99.9 /100 | #40 | Exceptional 1.1% |
| Thais | 99.8 /100 | #41 | Exceptional 1.1% |
| Immigrants | Bulgaria | 99.8 /100 | #42 | Exceptional 1.1% |
| Pima | 99.8 /100 | #43 | Exceptional 1.1% |
| Immigrants | Asia | 99.8 /100 | #44 | Exceptional 1.1% |
| Immigrants | Turkey | 99.8 /100 | #45 | Exceptional 1.1% |
| Immigrants | Congo | 99.8 /100 | #46 | Exceptional 1.1% |
| Immigrants | Sweden | 99.8 /100 | #47 | Exceptional 1.1% |
| Immigrants | Singapore | 99.7 /100 | #48 | Exceptional 1.1% |
| Immigrants | Russia | 99.7 /100 | #49 | Exceptional 1.1% |
| Immigrants | Japan | 99.7 /100 | #50 | Exceptional 1.1% |
| Immigrants | Kazakhstan | 99.7 /100 | #51 | Exceptional 1.1% |
| Immigrants | Bolivia | 99.6 /100 | #52 | Exceptional 1.1% |