Slovene vs Immigrants from Syria Disability Age Under 5
COMPARE
Slovene
Immigrants from Syria
Disability Age Under 5
Disability Age Under 5 Comparison
Slovenes
Immigrants from Syria
1.4%
DISABILITY AGE UNDER 5
0.3/ 100
METRIC RATING
257th/ 347
METRIC RANK
1.1%
DISABILITY AGE UNDER 5
97.9/ 100
METRIC RATING
83rd/ 347
METRIC RANK
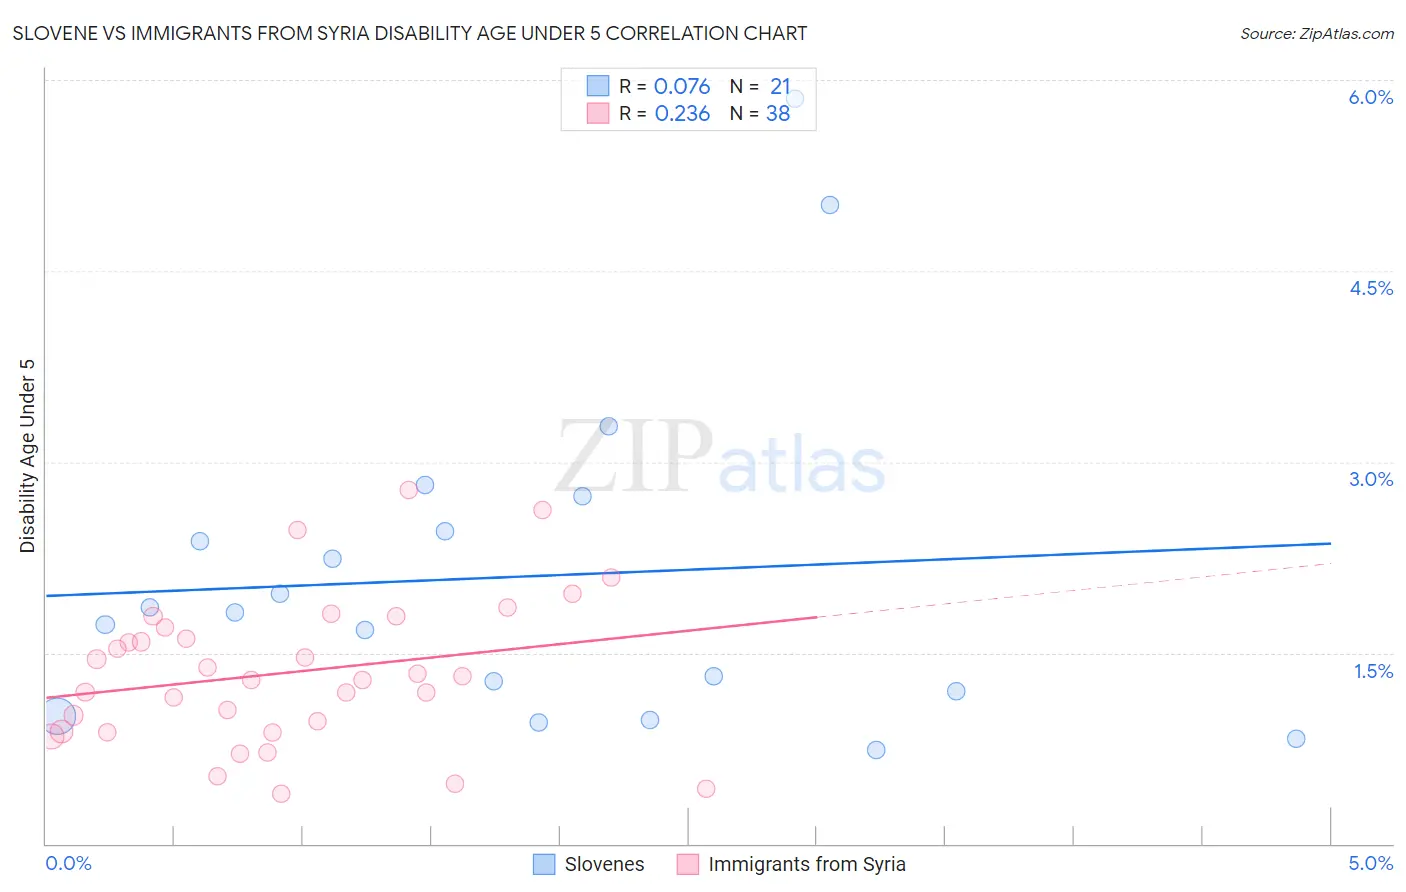
Slovene vs Immigrants from Syria Disability Age Under 5 Correlation Chart
The statistical analysis conducted on geographies consisting of 155,245,072 people shows a slight positive correlation between the proportion of Slovenes and percentage of population with a disability under the age of 5 in the United States with a correlation coefficient (R) of 0.076 and weighted average of 1.4%. Similarly, the statistical analysis conducted on geographies consisting of 121,605,651 people shows a weak positive correlation between the proportion of Immigrants from Syria and percentage of population with a disability under the age of 5 in the United States with a correlation coefficient (R) of 0.236 and weighted average of 1.1%, a difference of 23.6%.
Disability Age Under 5 Correlation Summary
| Measurement | Slovene | Immigrants from Syria |
| Minimum | 0.73% | 0.39% |
| Maximum | 5.9% | 2.8% |
| Range | 5.1% | 2.4% |
| Mean | 2.1% | 1.3% |
| Median | 1.8% | 1.3% |
| Interquartile 25% (IQ1) | 1.1% | 0.88% |
| Interquartile 75% (IQ3) | 2.6% | 1.7% |
| Interquartile Range (IQR) | 1.5% | 0.81% |
| Standard Deviation (Sample) | 1.3% | 0.58% |
| Standard Deviation (Population) | 1.3% | 0.57% |
Similar Demographics by Disability Age Under 5
Demographics Similar to Slovenes by Disability Age Under 5
In terms of disability age under 5, the demographic groups most similar to Slovenes are Costa Rican (1.4%, a difference of 0.19%), Immigrants from Southern Europe (1.4%, a difference of 0.34%), Slavic (1.4%, a difference of 0.55%), Immigrants from Western Europe (1.4%, a difference of 0.89%), and Immigrants from Netherlands (1.4%, a difference of 1.2%).
| Demographics | Rating | Rank | Disability Age Under 5 |
| Africans | 1.0 /100 | #250 | Tragic 1.4% |
| Immigrants | Hungary | 1.0 /100 | #251 | Tragic 1.4% |
| Immigrants | Scotland | 0.9 /100 | #252 | Tragic 1.4% |
| Australians | 0.7 /100 | #253 | Tragic 1.4% |
| Immigrants | Brazil | 0.7 /100 | #254 | Tragic 1.4% |
| Immigrants | Liberia | 0.6 /100 | #255 | Tragic 1.4% |
| Immigrants | Western Europe | 0.5 /100 | #256 | Tragic 1.4% |
| Slovenes | 0.3 /100 | #257 | Tragic 1.4% |
| Costa Ricans | 0.3 /100 | #258 | Tragic 1.4% |
| Immigrants | Southern Europe | 0.3 /100 | #259 | Tragic 1.4% |
| Slavs | 0.3 /100 | #260 | Tragic 1.4% |
| Immigrants | Netherlands | 0.2 /100 | #261 | Tragic 1.4% |
| Immigrants | Dominica | 0.2 /100 | #262 | Tragic 1.4% |
| Spanish | 0.2 /100 | #263 | Tragic 1.4% |
| Yugoslavians | 0.1 /100 | #264 | Tragic 1.4% |
Demographics Similar to Immigrants from Syria by Disability Age Under 5
In terms of disability age under 5, the demographic groups most similar to Immigrants from Syria are Immigrants from Jordan (1.1%, a difference of 0.010%), Turkish (1.1%, a difference of 0.12%), Immigrants from Trinidad and Tobago (1.1%, a difference of 0.14%), Immigrants from Zaire (1.1%, a difference of 0.15%), and Hmong (1.1%, a difference of 0.16%).
| Demographics | Rating | Rank | Disability Age Under 5 |
| Immigrants | Burma/Myanmar | 98.2 /100 | #76 | Exceptional 1.1% |
| Immigrants | Denmark | 98.1 /100 | #77 | Exceptional 1.1% |
| West Indians | 98.0 /100 | #78 | Exceptional 1.1% |
| Hmong | 98.0 /100 | #79 | Exceptional 1.1% |
| Immigrants | Trinidad and Tobago | 98.0 /100 | #80 | Exceptional 1.1% |
| Turks | 98.0 /100 | #81 | Exceptional 1.1% |
| Immigrants | Jordan | 97.9 /100 | #82 | Exceptional 1.1% |
| Immigrants | Syria | 97.9 /100 | #83 | Exceptional 1.1% |
| Immigrants | Zaire | 97.8 /100 | #84 | Exceptional 1.1% |
| Sudanese | 97.7 /100 | #85 | Exceptional 1.1% |
| Okinawans | 97.6 /100 | #86 | Exceptional 1.1% |
| Ugandans | 97.5 /100 | #87 | Exceptional 1.1% |
| Immigrants | Dominican Republic | 97.5 /100 | #88 | Exceptional 1.1% |
| Ethiopians | 97.2 /100 | #89 | Exceptional 1.1% |
| Chinese | 97.2 /100 | #90 | Exceptional 1.1% |