Ukrainian vs Immigrants from Syria Disability Age Under 5
COMPARE
Ukrainian
Immigrants from Syria
Disability Age Under 5
Disability Age Under 5 Comparison
Ukrainians
Immigrants from Syria
1.3%
DISABILITY AGE UNDER 5
8.3/ 100
METRIC RATING
222nd/ 347
METRIC RANK
1.1%
DISABILITY AGE UNDER 5
97.9/ 100
METRIC RATING
83rd/ 347
METRIC RANK
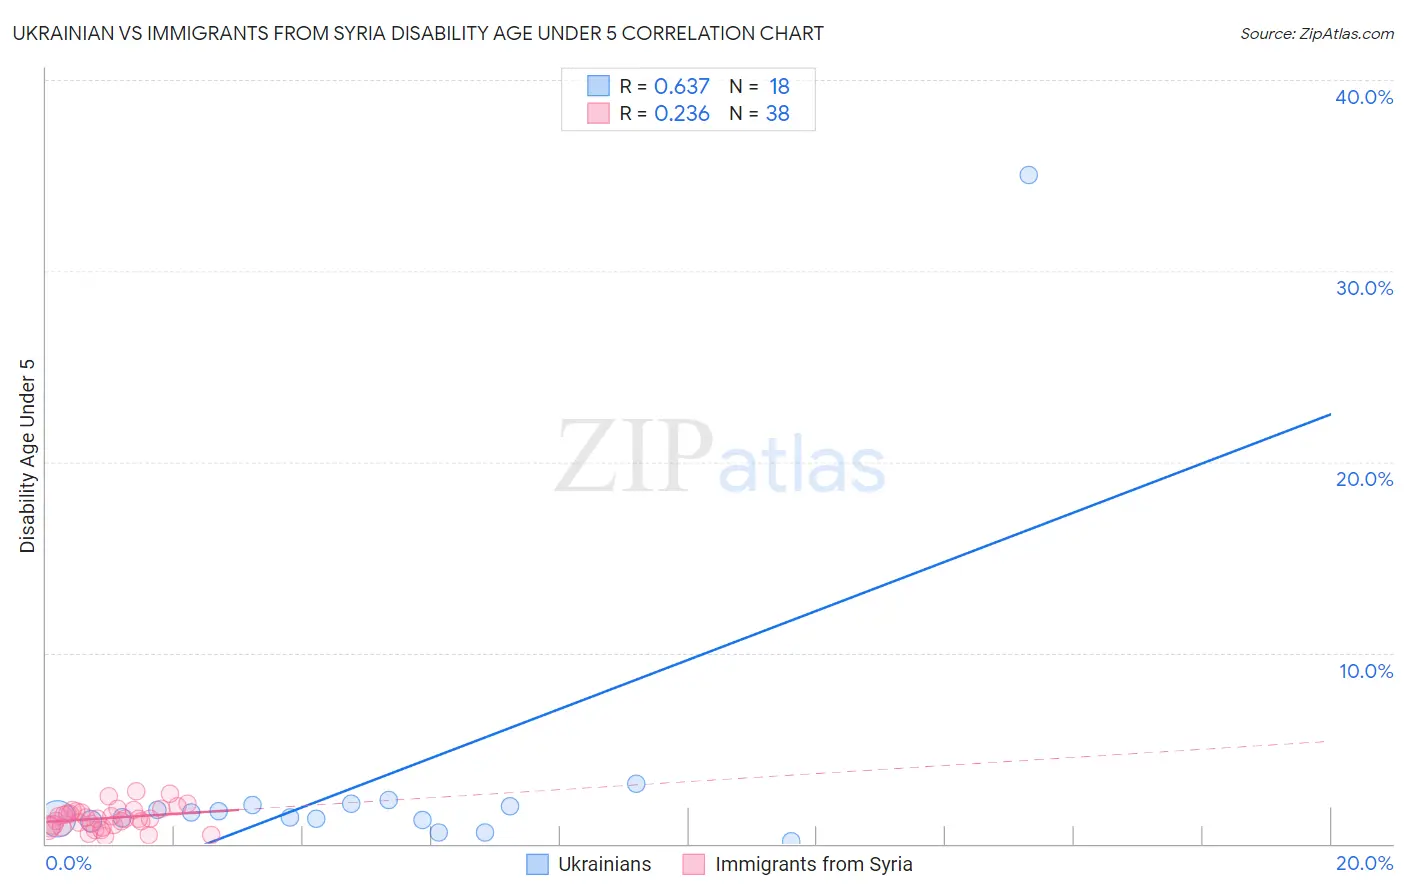
Ukrainian vs Immigrants from Syria Disability Age Under 5 Correlation Chart
The statistical analysis conducted on geographies consisting of 227,368,617 people shows a significant positive correlation between the proportion of Ukrainians and percentage of population with a disability under the age of 5 in the United States with a correlation coefficient (R) of 0.637 and weighted average of 1.3%. Similarly, the statistical analysis conducted on geographies consisting of 121,605,651 people shows a weak positive correlation between the proportion of Immigrants from Syria and percentage of population with a disability under the age of 5 in the United States with a correlation coefficient (R) of 0.236 and weighted average of 1.1%, a difference of 15.4%.
Disability Age Under 5 Correlation Summary
| Measurement | Ukrainian | Immigrants from Syria |
| Minimum | 0.14% | 0.39% |
| Maximum | 35.0% | 2.8% |
| Range | 34.9% | 2.4% |
| Mean | 3.4% | 1.3% |
| Median | 1.5% | 1.3% |
| Interquartile 25% (IQ1) | 1.2% | 0.88% |
| Interquartile 75% (IQ3) | 2.0% | 1.7% |
| Interquartile Range (IQR) | 0.82% | 0.81% |
| Standard Deviation (Sample) | 7.9% | 0.58% |
| Standard Deviation (Population) | 7.7% | 0.57% |
Similar Demographics by Disability Age Under 5
Demographics Similar to Ukrainians by Disability Age Under 5
In terms of disability age under 5, the demographic groups most similar to Ukrainians are Subsaharan African (1.3%, a difference of 0.0%), Hispanic or Latino (1.3%, a difference of 0.19%), Serbian (1.3%, a difference of 0.34%), Latvian (1.3%, a difference of 0.35%), and Panamanian (1.3%, a difference of 0.37%).
| Demographics | Rating | Rank | Disability Age Under 5 |
| Syrians | 16.1 /100 | #215 | Poor 1.3% |
| Bangladeshis | 15.5 /100 | #216 | Poor 1.3% |
| Cypriots | 14.9 /100 | #217 | Poor 1.3% |
| Malaysians | 13.2 /100 | #218 | Poor 1.3% |
| Immigrants | Croatia | 11.2 /100 | #219 | Poor 1.3% |
| Serbians | 9.6 /100 | #220 | Tragic 1.3% |
| Sub-Saharan Africans | 8.3 /100 | #221 | Tragic 1.3% |
| Ukrainians | 8.3 /100 | #222 | Tragic 1.3% |
| Hispanics or Latinos | 7.7 /100 | #223 | Tragic 1.3% |
| Latvians | 7.1 /100 | #224 | Tragic 1.3% |
| Panamanians | 7.1 /100 | #225 | Tragic 1.3% |
| Bahamians | 7.1 /100 | #226 | Tragic 1.3% |
| Taiwanese | 6.1 /100 | #227 | Tragic 1.3% |
| Luxembourgers | 6.1 /100 | #228 | Tragic 1.3% |
| Immigrants | Costa Rica | 5.5 /100 | #229 | Tragic 1.3% |
Demographics Similar to Immigrants from Syria by Disability Age Under 5
In terms of disability age under 5, the demographic groups most similar to Immigrants from Syria are Immigrants from Jordan (1.1%, a difference of 0.010%), Turkish (1.1%, a difference of 0.12%), Immigrants from Trinidad and Tobago (1.1%, a difference of 0.14%), Immigrants from Zaire (1.1%, a difference of 0.15%), and Hmong (1.1%, a difference of 0.16%).
| Demographics | Rating | Rank | Disability Age Under 5 |
| Immigrants | Burma/Myanmar | 98.2 /100 | #76 | Exceptional 1.1% |
| Immigrants | Denmark | 98.1 /100 | #77 | Exceptional 1.1% |
| West Indians | 98.0 /100 | #78 | Exceptional 1.1% |
| Hmong | 98.0 /100 | #79 | Exceptional 1.1% |
| Immigrants | Trinidad and Tobago | 98.0 /100 | #80 | Exceptional 1.1% |
| Turks | 98.0 /100 | #81 | Exceptional 1.1% |
| Immigrants | Jordan | 97.9 /100 | #82 | Exceptional 1.1% |
| Immigrants | Syria | 97.9 /100 | #83 | Exceptional 1.1% |
| Immigrants | Zaire | 97.8 /100 | #84 | Exceptional 1.1% |
| Sudanese | 97.7 /100 | #85 | Exceptional 1.1% |
| Okinawans | 97.6 /100 | #86 | Exceptional 1.1% |
| Ugandans | 97.5 /100 | #87 | Exceptional 1.1% |
| Immigrants | Dominican Republic | 97.5 /100 | #88 | Exceptional 1.1% |
| Ethiopians | 97.2 /100 | #89 | Exceptional 1.1% |
| Chinese | 97.2 /100 | #90 | Exceptional 1.1% |