Alsatian vs Cypriot Self-Care Disability
COMPARE
Alsatian
Cypriot
Self-Care Disability
Self-Care Disability Comparison
Alsatians
Cypriots
2.4%
SELF-CARE DISABILITY
94.9/ 100
METRIC RATING
103rd/ 347
METRIC RANK
2.2%
SELF-CARE DISABILITY
100.0/ 100
METRIC RATING
24th/ 347
METRIC RANK
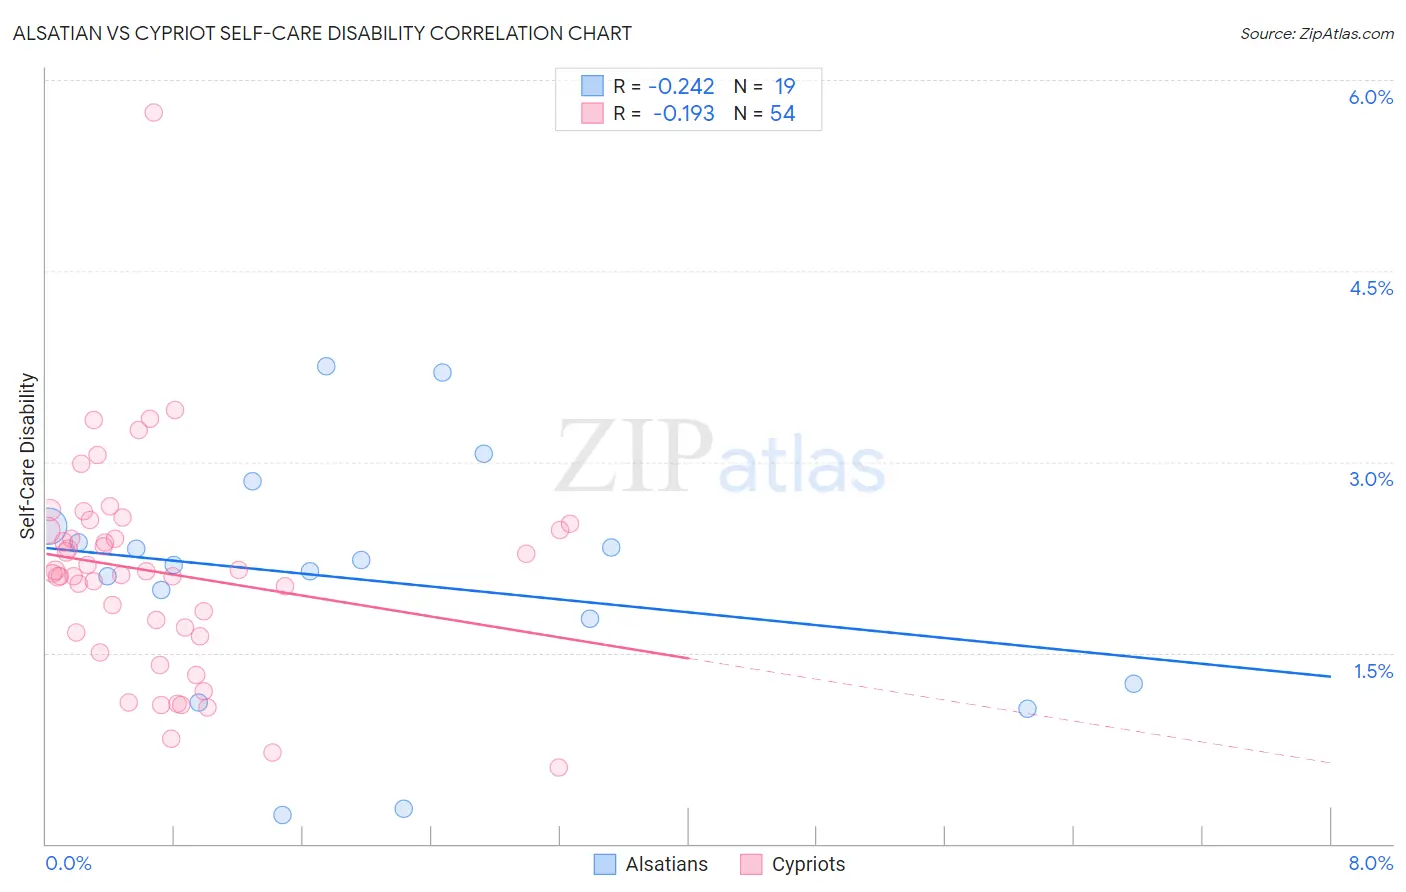
Alsatian vs Cypriot Self-Care Disability Correlation Chart
The statistical analysis conducted on geographies consisting of 82,671,639 people shows a weak negative correlation between the proportion of Alsatians and percentage of population with self-care disability in the United States with a correlation coefficient (R) of -0.242 and weighted average of 2.4%. Similarly, the statistical analysis conducted on geographies consisting of 61,833,470 people shows a poor negative correlation between the proportion of Cypriots and percentage of population with self-care disability in the United States with a correlation coefficient (R) of -0.193 and weighted average of 2.2%, a difference of 6.3%.
Self-Care Disability Correlation Summary
| Measurement | Alsatian | Cypriot |
| Minimum | 0.22% | 0.60% |
| Maximum | 3.7% | 5.7% |
| Range | 3.5% | 5.1% |
| Mean | 2.1% | 2.1% |
| Median | 2.2% | 2.1% |
| Interquartile 25% (IQ1) | 1.3% | 1.7% |
| Interquartile 75% (IQ3) | 2.5% | 2.5% |
| Interquartile Range (IQR) | 1.2% | 0.80% |
| Standard Deviation (Sample) | 0.97% | 0.84% |
| Standard Deviation (Population) | 0.94% | 0.83% |
Similar Demographics by Self-Care Disability
Demographics Similar to Alsatians by Self-Care Disability
In terms of self-care disability, the demographic groups most similar to Alsatians are Croatian (2.4%, a difference of 0.030%), Bhutanese (2.4%, a difference of 0.10%), Carpatho Rusyn (2.4%, a difference of 0.13%), Immigrants from Indonesia (2.4%, a difference of 0.14%), and British (2.4%, a difference of 0.15%).
| Demographics | Rating | Rank | Self-Care Disability |
| Immigrants | Chile | 96.7 /100 | #96 | Exceptional 2.4% |
| Swiss | 96.6 /100 | #97 | Exceptional 2.4% |
| Immigrants | Poland | 96.4 /100 | #98 | Exceptional 2.4% |
| Immigrants | Israel | 96.1 /100 | #99 | Exceptional 2.4% |
| Europeans | 95.8 /100 | #100 | Exceptional 2.4% |
| Immigrants | Scotland | 95.7 /100 | #101 | Exceptional 2.4% |
| Croatians | 95.0 /100 | #102 | Exceptional 2.4% |
| Alsatians | 94.9 /100 | #103 | Exceptional 2.4% |
| Bhutanese | 94.5 /100 | #104 | Exceptional 2.4% |
| Carpatho Rusyns | 94.4 /100 | #105 | Exceptional 2.4% |
| Immigrants | Indonesia | 94.3 /100 | #106 | Exceptional 2.4% |
| British | 94.3 /100 | #107 | Exceptional 2.4% |
| Greeks | 94.1 /100 | #108 | Exceptional 2.4% |
| Slovenes | 94.1 /100 | #109 | Exceptional 2.4% |
| Immigrants | Africa | 93.7 /100 | #110 | Exceptional 2.4% |
Demographics Similar to Cypriots by Self-Care Disability
In terms of self-care disability, the demographic groups most similar to Cypriots are Turkish (2.2%, a difference of 0.11%), Immigrants from Sri Lanka (2.2%, a difference of 0.18%), Venezuelan (2.2%, a difference of 0.19%), Cambodian (2.2%, a difference of 0.30%), and Inupiat (2.2%, a difference of 0.35%).
| Demographics | Rating | Rank | Self-Care Disability |
| Immigrants | Saudi Arabia | 100.0 /100 | #17 | Exceptional 2.2% |
| Immigrants | Taiwan | 100.0 /100 | #18 | Exceptional 2.2% |
| Immigrants | Eritrea | 100.0 /100 | #19 | Exceptional 2.2% |
| Tongans | 100.0 /100 | #20 | Exceptional 2.2% |
| Bulgarians | 100.0 /100 | #21 | Exceptional 2.2% |
| Immigrants | Venezuela | 100.0 /100 | #22 | Exceptional 2.2% |
| Cambodians | 100.0 /100 | #23 | Exceptional 2.2% |
| Cypriots | 100.0 /100 | #24 | Exceptional 2.2% |
| Turks | 100.0 /100 | #25 | Exceptional 2.2% |
| Immigrants | Sri Lanka | 99.9 /100 | #26 | Exceptional 2.2% |
| Venezuelans | 99.9 /100 | #27 | Exceptional 2.2% |
| Inupiat | 99.9 /100 | #28 | Exceptional 2.2% |
| Immigrants | Zimbabwe | 99.9 /100 | #29 | Exceptional 2.3% |
| Paraguayans | 99.9 /100 | #30 | Exceptional 2.3% |
| Danes | 99.9 /100 | #31 | Exceptional 2.3% |