Aleut vs Iranian Female Disability
COMPARE
Aleut
Iranian
Female Disability
Female Disability Comparison
Aleuts
Iranians
12.7%
FEMALE DISABILITY
1.1/ 100
METRIC RATING
258th/ 347
METRIC RANK
10.6%
FEMALE DISABILITY
100.0/ 100
METRIC RATING
9th/ 347
METRIC RANK
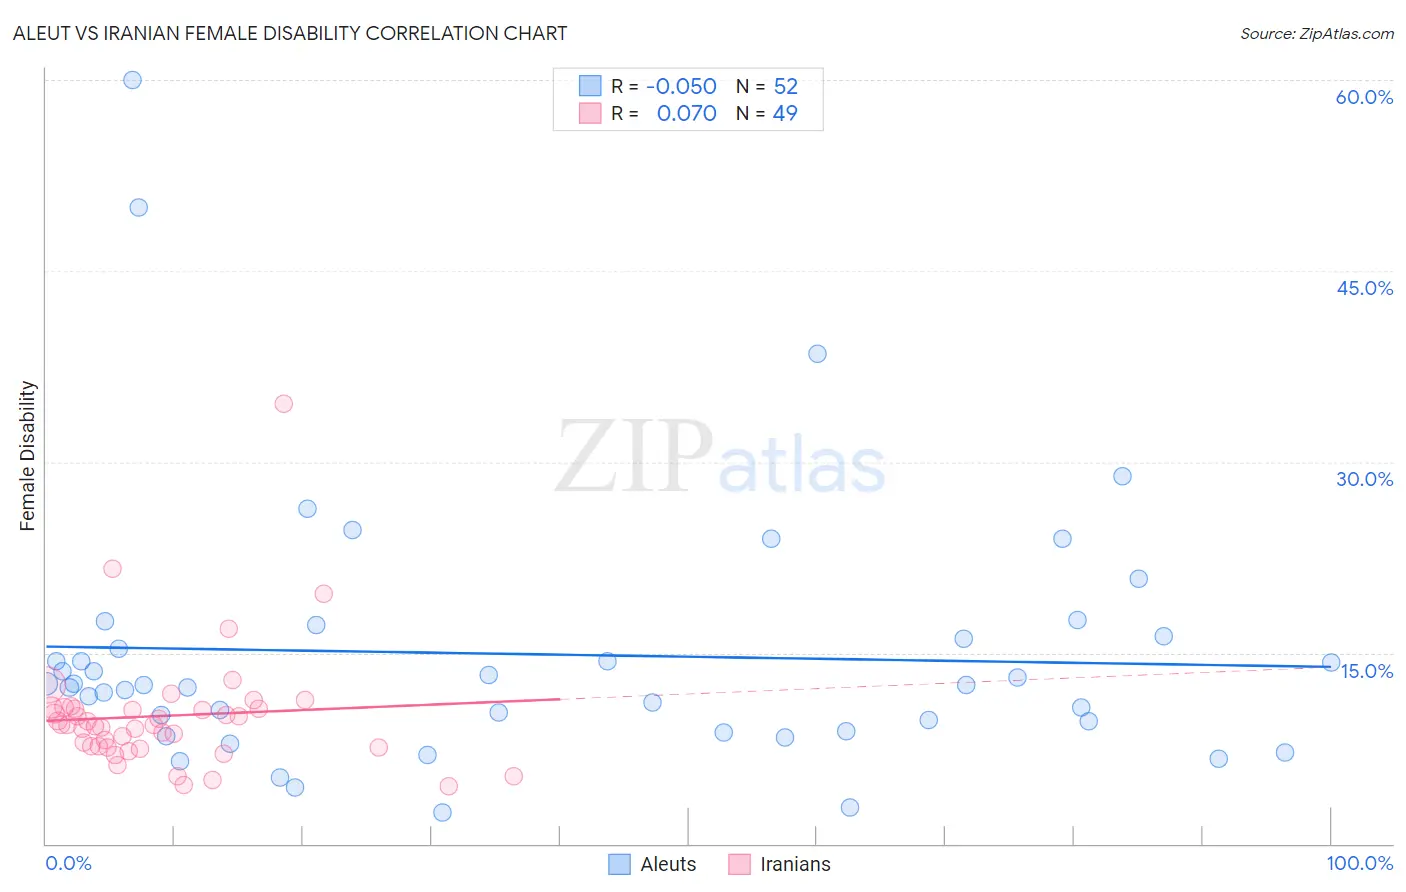
Aleut vs Iranian Female Disability Correlation Chart
The statistical analysis conducted on geographies consisting of 61,781,040 people shows no correlation between the proportion of Aleuts and percentage of females with a disability in the United States with a correlation coefficient (R) of -0.050 and weighted average of 12.7%. Similarly, the statistical analysis conducted on geographies consisting of 316,876,376 people shows a slight positive correlation between the proportion of Iranians and percentage of females with a disability in the United States with a correlation coefficient (R) of 0.070 and weighted average of 10.6%, a difference of 20.4%.
Female Disability Correlation Summary
| Measurement | Aleut | Iranian |
| Minimum | 2.5% | 4.5% |
| Maximum | 60.0% | 34.6% |
| Range | 57.5% | 30.1% |
| Mean | 14.9% | 10.0% |
| Median | 12.5% | 9.3% |
| Interquartile 25% (IQ1) | 9.2% | 7.6% |
| Interquartile 75% (IQ3) | 16.2% | 10.6% |
| Interquartile Range (IQR) | 7.0% | 3.1% |
| Standard Deviation (Sample) | 10.5% | 4.8% |
| Standard Deviation (Population) | 10.4% | 4.8% |
Similar Demographics by Female Disability
Demographics Similar to Aleuts by Female Disability
In terms of female disability, the demographic groups most similar to Aleuts are Liberian (12.7%, a difference of 0.0%), British West Indian (12.7%, a difference of 0.030%), Immigrants from Armenia (12.7%, a difference of 0.080%), Subsaharan African (12.7%, a difference of 0.090%), and Immigrants from Germany (12.7%, a difference of 0.10%).
| Demographics | Rating | Rank | Female Disability |
| Crow | 1.6 /100 | #251 | Tragic 12.7% |
| Immigrants | Caribbean | 1.4 /100 | #252 | Tragic 12.7% |
| Jamaicans | 1.4 /100 | #253 | Tragic 12.7% |
| Hawaiians | 1.4 /100 | #254 | Tragic 12.7% |
| Immigrants | Germany | 1.3 /100 | #255 | Tragic 12.7% |
| British West Indians | 1.2 /100 | #256 | Tragic 12.7% |
| Liberians | 1.1 /100 | #257 | Tragic 12.7% |
| Aleuts | 1.1 /100 | #258 | Tragic 12.7% |
| Immigrants | Armenia | 1.0 /100 | #259 | Tragic 12.7% |
| Sub-Saharan Africans | 1.0 /100 | #260 | Tragic 12.7% |
| Bermudans | 1.0 /100 | #261 | Tragic 12.7% |
| Czechoslovakians | 0.9 /100 | #262 | Tragic 12.7% |
| Spaniards | 0.7 /100 | #263 | Tragic 12.8% |
| Alaska Natives | 0.6 /100 | #264 | Tragic 12.8% |
| West Indians | 0.5 /100 | #265 | Tragic 12.8% |
Demographics Similar to Iranians by Female Disability
In terms of female disability, the demographic groups most similar to Iranians are Immigrants from Hong Kong (10.6%, a difference of 0.65%), Immigrants from Korea (10.6%, a difference of 0.82%), Immigrants from South Central Asia (10.5%, a difference of 0.91%), Immigrants from Singapore (10.4%, a difference of 1.1%), and Immigrants from Israel (10.7%, a difference of 1.2%).
| Demographics | Rating | Rank | Female Disability |
| Filipinos | 100.0 /100 | #2 | Exceptional 10.1% |
| Immigrants | Taiwan | 100.0 /100 | #3 | Exceptional 10.1% |
| Thais | 100.0 /100 | #4 | Exceptional 10.2% |
| Immigrants | Bolivia | 100.0 /100 | #5 | Exceptional 10.3% |
| Bolivians | 100.0 /100 | #6 | Exceptional 10.4% |
| Immigrants | Singapore | 100.0 /100 | #7 | Exceptional 10.4% |
| Immigrants | South Central Asia | 100.0 /100 | #8 | Exceptional 10.5% |
| Iranians | 100.0 /100 | #9 | Exceptional 10.6% |
| Immigrants | Hong Kong | 100.0 /100 | #10 | Exceptional 10.6% |
| Immigrants | Korea | 100.0 /100 | #11 | Exceptional 10.6% |
| Immigrants | Israel | 100.0 /100 | #12 | Exceptional 10.7% |
| Immigrants | Eastern Asia | 100.0 /100 | #13 | Exceptional 10.7% |
| Immigrants | China | 100.0 /100 | #14 | Exceptional 10.7% |
| Burmese | 100.0 /100 | #15 | Exceptional 10.7% |
| Okinawans | 100.0 /100 | #16 | Exceptional 10.8% |