Eastern European vs British West Indian Male Disability
COMPARE
Eastern European
British West Indian
Male Disability
Male Disability Comparison
Eastern Europeans
British West Indians
10.9%
MALE DISABILITY
90.6/ 100
METRIC RATING
117th/ 347
METRIC RANK
11.1%
MALE DISABILITY
62.8/ 100
METRIC RATING
164th/ 347
METRIC RANK
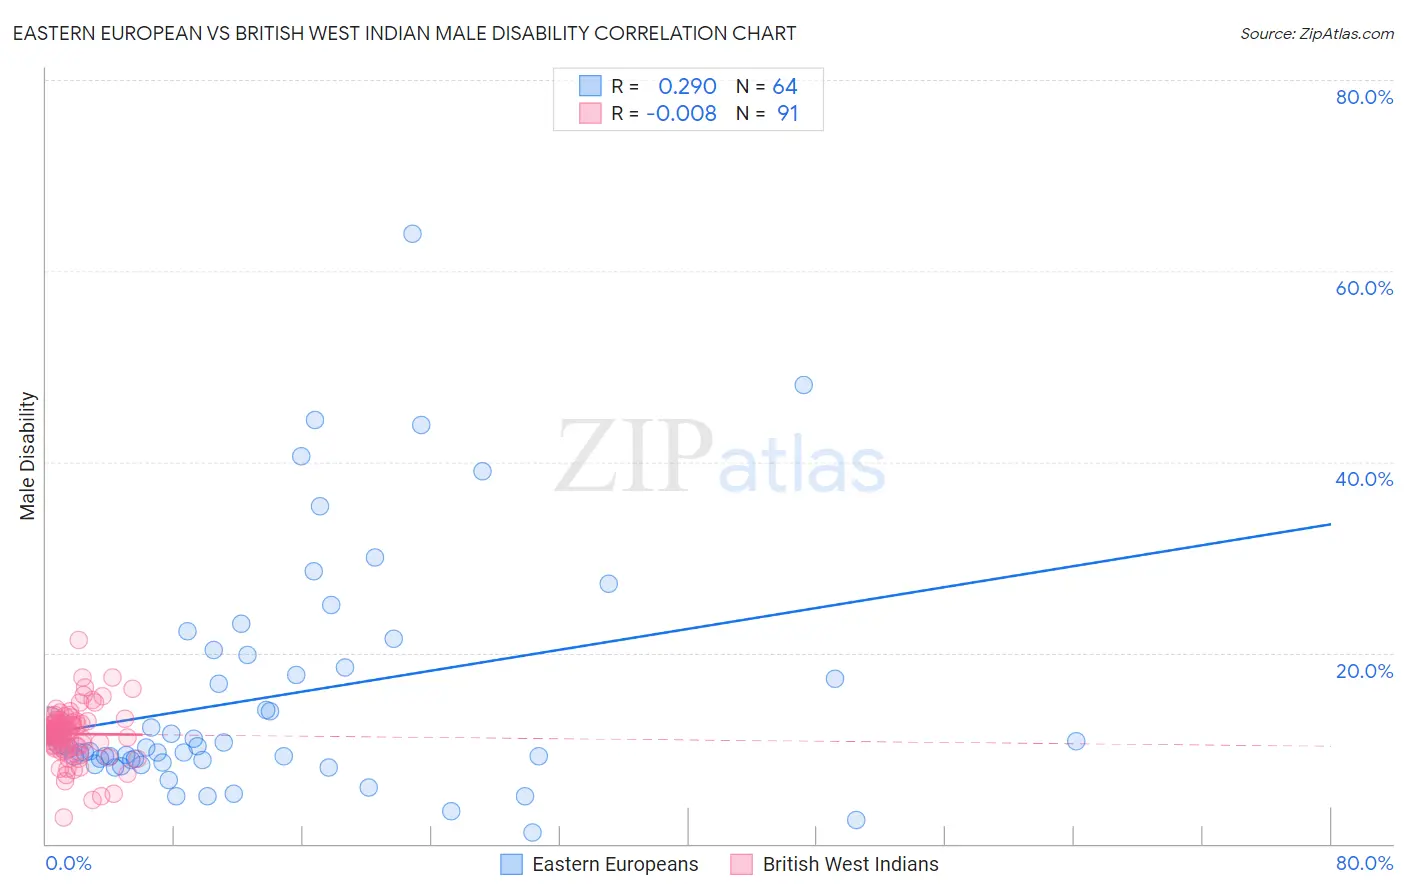
Eastern European vs British West Indian Male Disability Correlation Chart
The statistical analysis conducted on geographies consisting of 461,169,070 people shows a weak positive correlation between the proportion of Eastern Europeans and percentage of males with a disability in the United States with a correlation coefficient (R) of 0.290 and weighted average of 10.9%. Similarly, the statistical analysis conducted on geographies consisting of 152,682,334 people shows no correlation between the proportion of British West Indians and percentage of males with a disability in the United States with a correlation coefficient (R) of -0.008 and weighted average of 11.1%, a difference of 2.5%.
Male Disability Correlation Summary
| Measurement | Eastern European | British West Indian |
| Minimum | 1.2% | 2.8% |
| Maximum | 63.9% | 21.3% |
| Range | 62.7% | 18.5% |
| Mean | 15.5% | 11.5% |
| Median | 10.1% | 11.7% |
| Interquartile 25% (IQ1) | 8.8% | 10.2% |
| Interquartile 75% (IQ3) | 19.1% | 12.8% |
| Interquartile Range (IQR) | 10.3% | 2.6% |
| Standard Deviation (Sample) | 12.4% | 2.8% |
| Standard Deviation (Population) | 12.3% | 2.8% |
Similar Demographics by Male Disability
Demographics Similar to Eastern Europeans by Male Disability
In terms of male disability, the demographic groups most similar to Eastern Europeans are Immigrants from Cuba (10.9%, a difference of 0.080%), Armenian (10.9%, a difference of 0.080%), Immigrants from Africa (10.9%, a difference of 0.19%), Immigrants from South Africa (10.8%, a difference of 0.21%), and Immigrants from South Eastern Asia (10.9%, a difference of 0.23%).
| Demographics | Rating | Rank | Male Disability |
| Immigrants | Immigrants | 93.9 /100 | #110 | Exceptional 10.8% |
| Immigrants | Uruguay | 93.8 /100 | #111 | Exceptional 10.8% |
| Ghanaians | 93.4 /100 | #112 | Exceptional 10.8% |
| Immigrants | Zimbabwe | 93.0 /100 | #113 | Exceptional 10.8% |
| Central Americans | 92.7 /100 | #114 | Exceptional 10.8% |
| Immigrants | Barbados | 92.2 /100 | #115 | Exceptional 10.8% |
| Immigrants | South Africa | 91.8 /100 | #116 | Exceptional 10.8% |
| Eastern Europeans | 90.6 /100 | #117 | Exceptional 10.9% |
| Immigrants | Cuba | 90.2 /100 | #118 | Exceptional 10.9% |
| Armenians | 90.1 /100 | #119 | Exceptional 10.9% |
| Immigrants | Africa | 89.4 /100 | #120 | Excellent 10.9% |
| Immigrants | South Eastern Asia | 89.2 /100 | #121 | Excellent 10.9% |
| Immigrants | Ghana | 89.0 /100 | #122 | Excellent 10.9% |
| Immigrants | Czechoslovakia | 88.4 /100 | #123 | Excellent 10.9% |
| South American Indians | 88.1 /100 | #124 | Excellent 10.9% |
Demographics Similar to British West Indians by Male Disability
In terms of male disability, the demographic groups most similar to British West Indians are Luxembourger (11.1%, a difference of 0.050%), Immigrants from Kenya (11.1%, a difference of 0.060%), Immigrants from Hungary (11.1%, a difference of 0.090%), Immigrants from Haiti (11.1%, a difference of 0.15%), and Immigrants from West Indies (11.1%, a difference of 0.18%).
| Demographics | Rating | Rank | Male Disability |
| Immigrants | Western Africa | 69.2 /100 | #157 | Good 11.1% |
| Latvians | 68.1 /100 | #158 | Good 11.1% |
| Guatemalans | 67.2 /100 | #159 | Good 11.1% |
| Albanians | 66.5 /100 | #160 | Good 11.1% |
| Immigrants | West Indies | 65.7 /100 | #161 | Good 11.1% |
| Immigrants | Haiti | 65.3 /100 | #162 | Good 11.1% |
| Immigrants | Kenya | 63.8 /100 | #163 | Good 11.1% |
| British West Indians | 62.8 /100 | #164 | Good 11.1% |
| Luxembourgers | 61.9 /100 | #165 | Good 11.1% |
| Immigrants | Hungary | 61.2 /100 | #166 | Good 11.1% |
| Immigrants | Southern Europe | 54.4 /100 | #167 | Average 11.2% |
| Immigrants | Latin America | 54.0 /100 | #168 | Average 11.2% |
| Barbadians | 53.4 /100 | #169 | Average 11.2% |
| New Zealanders | 52.9 /100 | #170 | Average 11.2% |
| Haitians | 52.5 /100 | #171 | Average 11.2% |