Jordanian vs British West Indian Male Disability
COMPARE
Jordanian
British West Indian
Male Disability
Male Disability Comparison
Jordanians
British West Indians
10.5%
MALE DISABILITY
99.3/ 100
METRIC RATING
64th/ 347
METRIC RANK
11.1%
MALE DISABILITY
62.8/ 100
METRIC RATING
164th/ 347
METRIC RANK
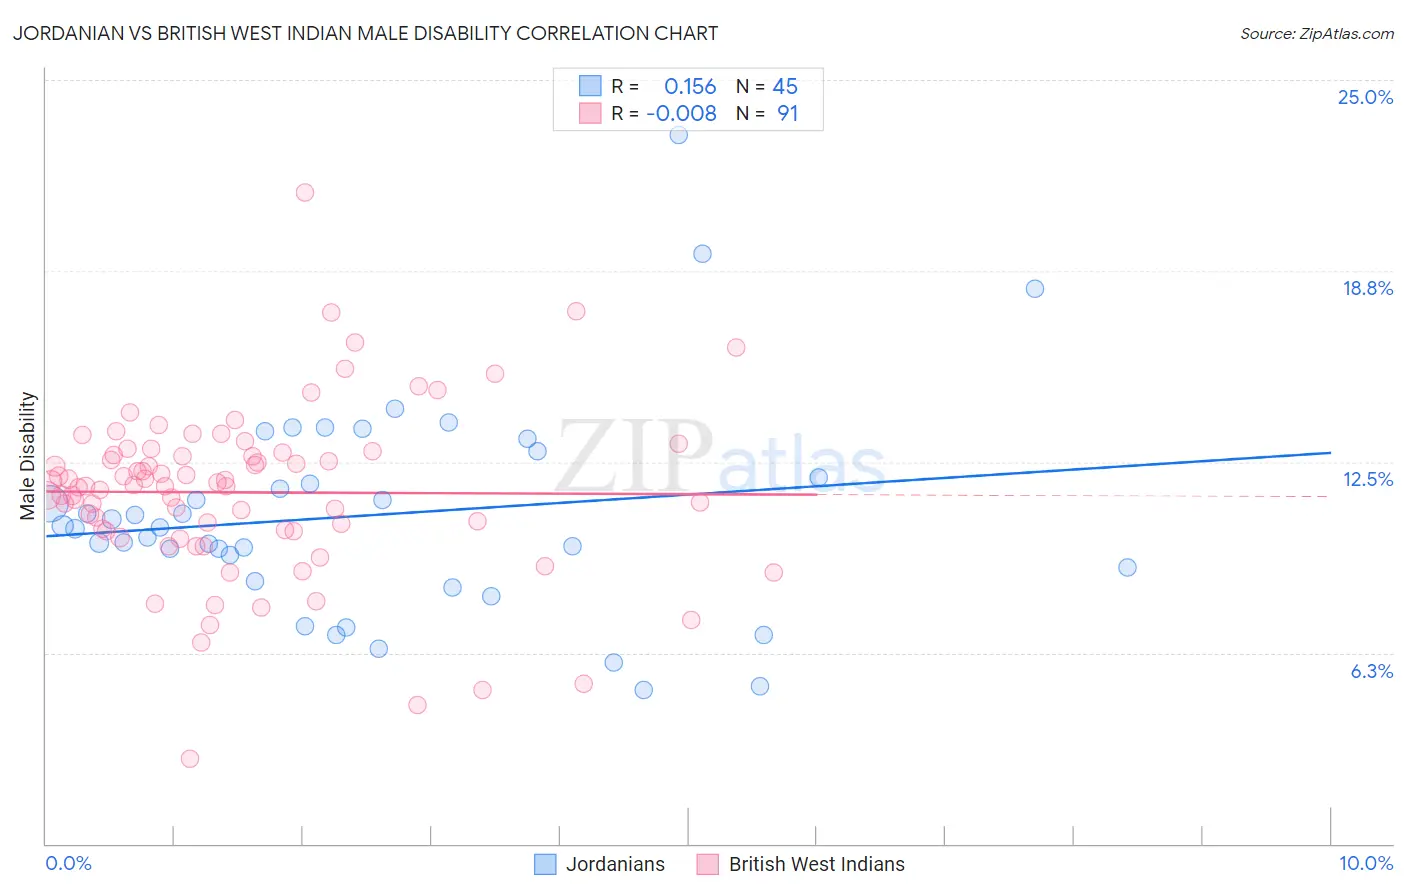
Jordanian vs British West Indian Male Disability Correlation Chart
The statistical analysis conducted on geographies consisting of 166,415,761 people shows a poor positive correlation between the proportion of Jordanians and percentage of males with a disability in the United States with a correlation coefficient (R) of 0.156 and weighted average of 10.5%. Similarly, the statistical analysis conducted on geographies consisting of 152,682,334 people shows no correlation between the proportion of British West Indians and percentage of males with a disability in the United States with a correlation coefficient (R) of -0.008 and weighted average of 11.1%, a difference of 6.5%.
Male Disability Correlation Summary
| Measurement | Jordanian | British West Indian |
| Minimum | 5.0% | 2.8% |
| Maximum | 23.2% | 21.3% |
| Range | 18.1% | 18.5% |
| Mean | 10.8% | 11.5% |
| Median | 10.4% | 11.7% |
| Interquartile 25% (IQ1) | 8.8% | 10.2% |
| Interquartile 75% (IQ3) | 12.4% | 12.8% |
| Interquartile Range (IQR) | 3.6% | 2.6% |
| Standard Deviation (Sample) | 3.5% | 2.8% |
| Standard Deviation (Population) | 3.5% | 2.8% |
Similar Demographics by Male Disability
Demographics Similar to Jordanians by Male Disability
In terms of male disability, the demographic groups most similar to Jordanians are Immigrants from Grenada (10.5%, a difference of 0.020%), Guyanese (10.5%, a difference of 0.030%), Immigrants from Afghanistan (10.5%, a difference of 0.030%), Immigrants from Belarus (10.4%, a difference of 0.12%), and Colombian (10.5%, a difference of 0.13%).
| Demographics | Rating | Rank | Male Disability |
| Immigrants | South America | 99.6 /100 | #57 | Exceptional 10.4% |
| Immigrants | Japan | 99.5 /100 | #58 | Exceptional 10.4% |
| Immigrants | Australia | 99.5 /100 | #59 | Exceptional 10.4% |
| Immigrants | Colombia | 99.5 /100 | #60 | Exceptional 10.4% |
| Immigrants | Northern Africa | 99.4 /100 | #61 | Exceptional 10.4% |
| Immigrants | Ecuador | 99.3 /100 | #62 | Exceptional 10.4% |
| Immigrants | Belarus | 99.3 /100 | #63 | Exceptional 10.4% |
| Jordanians | 99.3 /100 | #64 | Exceptional 10.5% |
| Immigrants | Grenada | 99.2 /100 | #65 | Exceptional 10.5% |
| Guyanese | 99.2 /100 | #66 | Exceptional 10.5% |
| Immigrants | Afghanistan | 99.2 /100 | #67 | Exceptional 10.5% |
| Colombians | 99.2 /100 | #68 | Exceptional 10.5% |
| Ecuadorians | 99.2 /100 | #69 | Exceptional 10.5% |
| Immigrants | Bulgaria | 99.1 /100 | #70 | Exceptional 10.5% |
| Immigrants | Cameroon | 99.0 /100 | #71 | Exceptional 10.5% |
Demographics Similar to British West Indians by Male Disability
In terms of male disability, the demographic groups most similar to British West Indians are Luxembourger (11.1%, a difference of 0.050%), Immigrants from Kenya (11.1%, a difference of 0.060%), Immigrants from Hungary (11.1%, a difference of 0.090%), Immigrants from Haiti (11.1%, a difference of 0.15%), and Immigrants from West Indies (11.1%, a difference of 0.18%).
| Demographics | Rating | Rank | Male Disability |
| Immigrants | Western Africa | 69.2 /100 | #157 | Good 11.1% |
| Latvians | 68.1 /100 | #158 | Good 11.1% |
| Guatemalans | 67.2 /100 | #159 | Good 11.1% |
| Albanians | 66.5 /100 | #160 | Good 11.1% |
| Immigrants | West Indies | 65.7 /100 | #161 | Good 11.1% |
| Immigrants | Haiti | 65.3 /100 | #162 | Good 11.1% |
| Immigrants | Kenya | 63.8 /100 | #163 | Good 11.1% |
| British West Indians | 62.8 /100 | #164 | Good 11.1% |
| Luxembourgers | 61.9 /100 | #165 | Good 11.1% |
| Immigrants | Hungary | 61.2 /100 | #166 | Good 11.1% |
| Immigrants | Southern Europe | 54.4 /100 | #167 | Average 11.2% |
| Immigrants | Latin America | 54.0 /100 | #168 | Average 11.2% |
| Barbadians | 53.4 /100 | #169 | Average 11.2% |
| New Zealanders | 52.9 /100 | #170 | Average 11.2% |
| Haitians | 52.5 /100 | #171 | Average 11.2% |