Alaska Native vs Immigrants from Pakistan Hearing Disability
COMPARE
Alaska Native
Immigrants from Pakistan
Hearing Disability
Hearing Disability Comparison
Alaska Natives
Immigrants from Pakistan
4.5%
HEARING DISABILITY
0.0/ 100
METRIC RATING
338th/ 347
METRIC RANK
2.6%
HEARING DISABILITY
99.6/ 100
METRIC RATING
34th/ 347
METRIC RANK
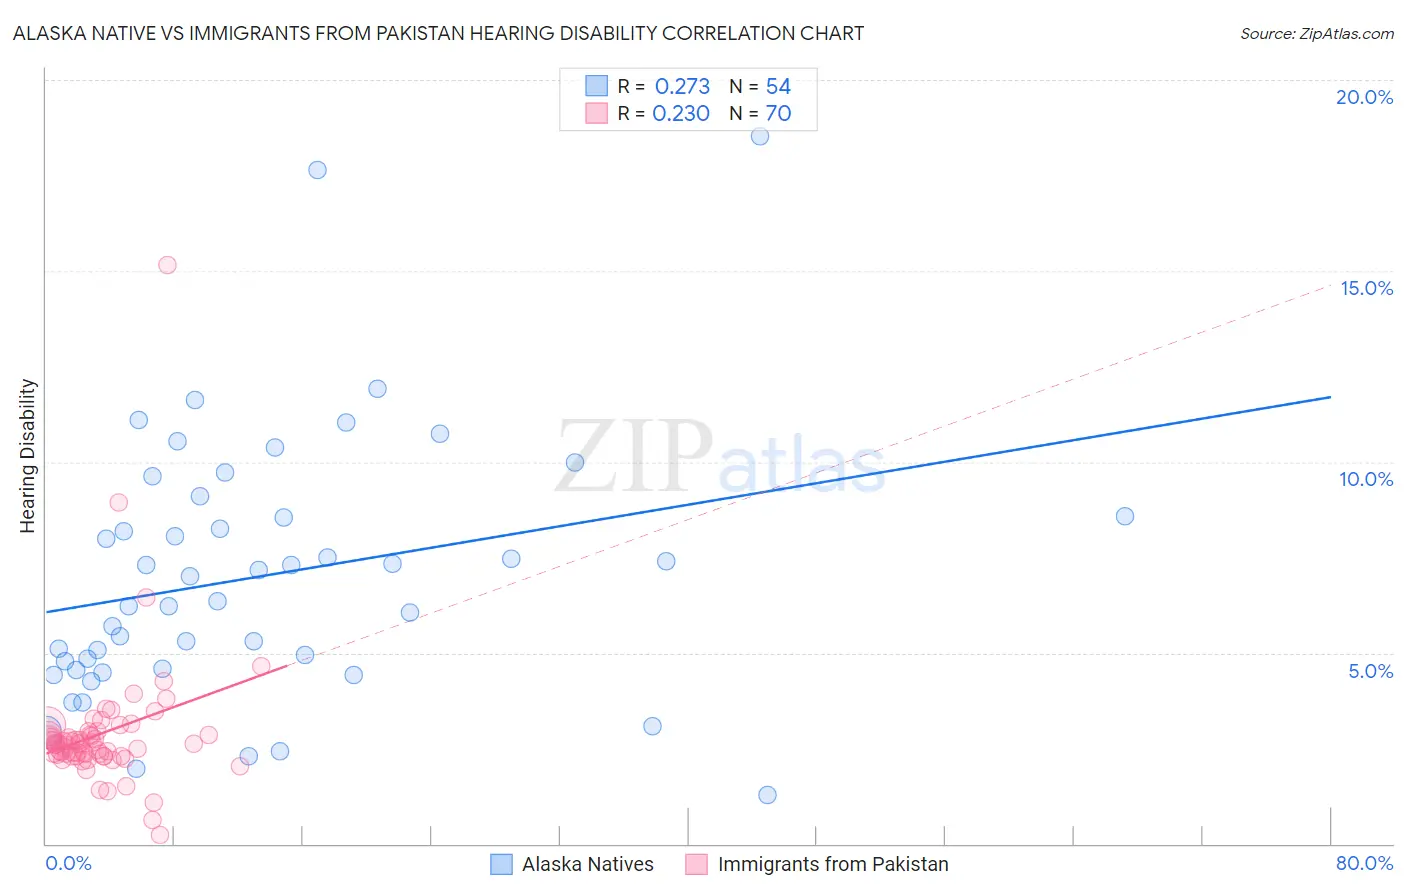
Alaska Native vs Immigrants from Pakistan Hearing Disability Correlation Chart
The statistical analysis conducted on geographies consisting of 76,760,957 people shows a weak positive correlation between the proportion of Alaska Natives and percentage of population with hearing disability in the United States with a correlation coefficient (R) of 0.273 and weighted average of 4.5%. Similarly, the statistical analysis conducted on geographies consisting of 283,855,672 people shows a weak positive correlation between the proportion of Immigrants from Pakistan and percentage of population with hearing disability in the United States with a correlation coefficient (R) of 0.230 and weighted average of 2.6%, a difference of 72.2%.
Hearing Disability Correlation Summary
| Measurement | Alaska Native | Immigrants from Pakistan |
| Minimum | 1.3% | 0.24% |
| Maximum | 18.5% | 15.2% |
| Range | 17.3% | 14.9% |
| Mean | 7.0% | 2.9% |
| Median | 6.7% | 2.6% |
| Interquartile 25% (IQ1) | 4.6% | 2.3% |
| Interquartile 75% (IQ3) | 8.6% | 2.9% |
| Interquartile Range (IQR) | 4.0% | 0.56% |
| Standard Deviation (Sample) | 3.4% | 1.9% |
| Standard Deviation (Population) | 3.4% | 1.9% |
Similar Demographics by Hearing Disability
Demographics Similar to Alaska Natives by Hearing Disability
In terms of hearing disability, the demographic groups most similar to Alaska Natives are Chickasaw (4.5%, a difference of 0.21%), Choctaw (4.5%, a difference of 1.4%), Creek (4.4%, a difference of 2.7%), Pueblo (4.6%, a difference of 2.9%), and Navajo (4.6%, a difference of 3.3%).
| Demographics | Rating | Rank | Hearing Disability |
| Cherokee | 0.0 /100 | #331 | Tragic 4.2% |
| Houma | 0.0 /100 | #332 | Tragic 4.2% |
| Dutch West Indians | 0.0 /100 | #333 | Tragic 4.3% |
| Aleuts | 0.0 /100 | #334 | Tragic 4.3% |
| Kiowa | 0.0 /100 | #335 | Tragic 4.3% |
| Creek | 0.0 /100 | #336 | Tragic 4.4% |
| Chickasaw | 0.0 /100 | #337 | Tragic 4.5% |
| Alaska Natives | 0.0 /100 | #338 | Tragic 4.5% |
| Choctaw | 0.0 /100 | #339 | Tragic 4.5% |
| Pueblo | 0.0 /100 | #340 | Tragic 4.6% |
| Navajo | 0.0 /100 | #341 | Tragic 4.6% |
| Tsimshian | 0.0 /100 | #342 | Tragic 4.7% |
| Inupiat | 0.0 /100 | #343 | Tragic 4.7% |
| Tlingit-Haida | 0.0 /100 | #344 | Tragic 4.8% |
| Alaskan Athabascans | 0.0 /100 | #345 | Tragic 5.3% |
Demographics Similar to Immigrants from Pakistan by Hearing Disability
In terms of hearing disability, the demographic groups most similar to Immigrants from Pakistan are Filipino (2.6%, a difference of 0.040%), Salvadoran (2.6%, a difference of 0.12%), Immigrants from Venezuela (2.6%, a difference of 0.30%), Okinawan (2.6%, a difference of 0.35%), and Immigrants from Western Africa (2.6%, a difference of 0.37%).
| Demographics | Rating | Rank | Hearing Disability |
| Immigrants | South Central Asia | 99.7 /100 | #27 | Exceptional 2.6% |
| Immigrants | Haiti | 99.7 /100 | #28 | Exceptional 2.6% |
| Bolivians | 99.7 /100 | #29 | Exceptional 2.6% |
| Immigrants | Caribbean | 99.7 /100 | #30 | Exceptional 2.6% |
| Immigrants | Cameroon | 99.7 /100 | #31 | Exceptional 2.6% |
| Immigrants | Venezuela | 99.7 /100 | #32 | Exceptional 2.6% |
| Filipinos | 99.6 /100 | #33 | Exceptional 2.6% |
| Immigrants | Pakistan | 99.6 /100 | #34 | Exceptional 2.6% |
| Salvadorans | 99.6 /100 | #35 | Exceptional 2.6% |
| Okinawans | 99.6 /100 | #36 | Exceptional 2.6% |
| Immigrants | Western Africa | 99.6 /100 | #37 | Exceptional 2.6% |
| Immigrants | Jamaica | 99.5 /100 | #38 | Exceptional 2.6% |
| Immigrants | China | 99.5 /100 | #39 | Exceptional 2.6% |
| Haitians | 99.5 /100 | #40 | Exceptional 2.6% |
| Immigrants | Taiwan | 99.4 /100 | #41 | Exceptional 2.6% |