African vs Serbian Female Poverty Among 18-24 Year Olds
COMPARE
African
Serbian
Female Poverty Among 18-24 Year Olds
Female Poverty Among 18-24 Year Olds Comparison
Africans
Serbians
22.8%
FEMALE POVERTY AMONG 18-24 YEAR OLDS
0.0/ 100
METRIC RATING
300th/ 347
METRIC RANK
19.1%
FEMALE POVERTY AMONG 18-24 YEAR OLDS
98.0/ 100
METRIC RATING
103rd/ 347
METRIC RANK
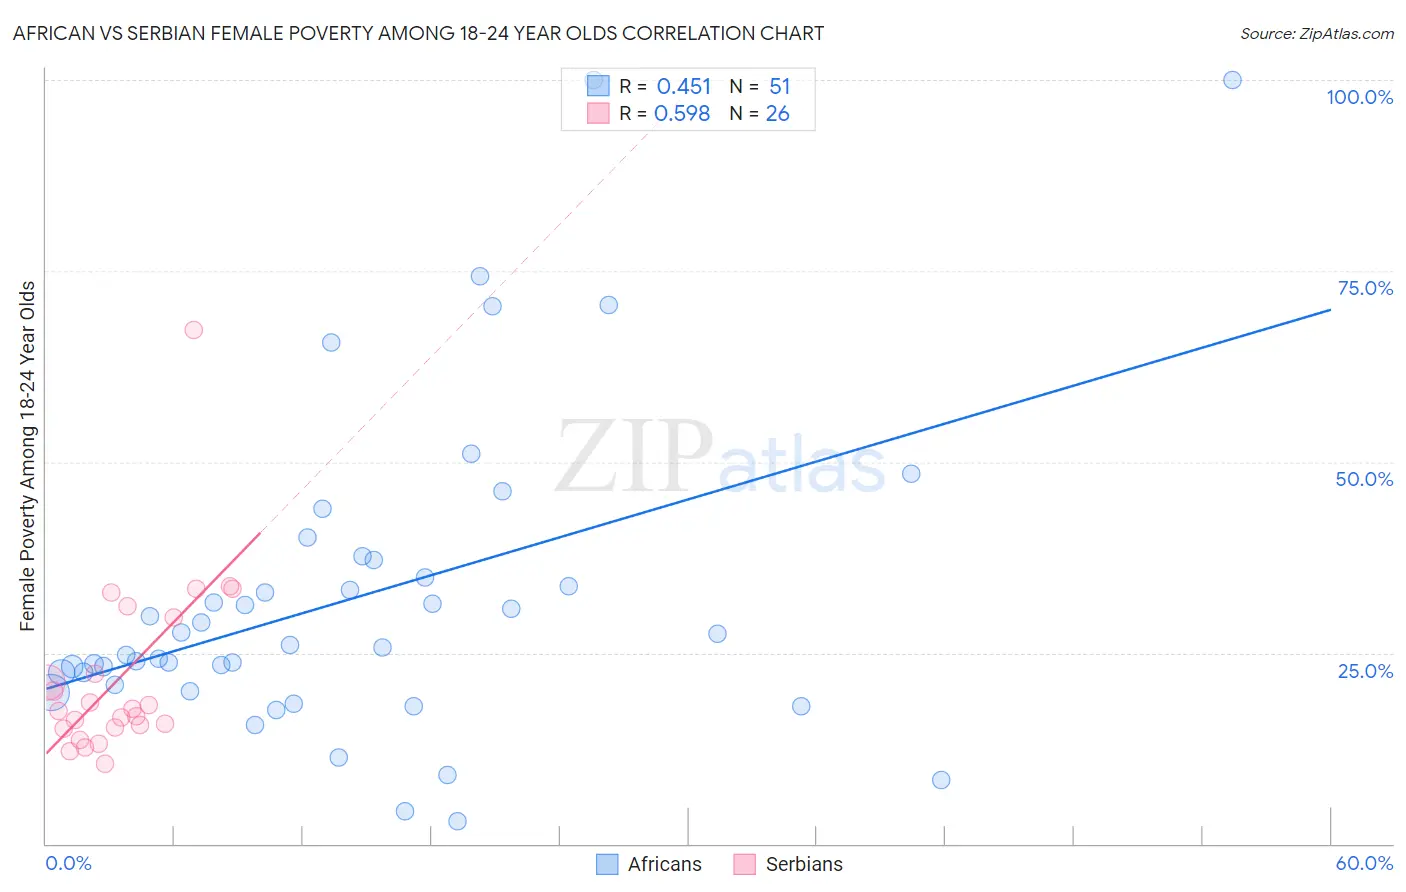
African vs Serbian Female Poverty Among 18-24 Year Olds Correlation Chart
The statistical analysis conducted on geographies consisting of 458,558,790 people shows a moderate positive correlation between the proportion of Africans and poverty level among females between the ages 18 and 24 in the United States with a correlation coefficient (R) of 0.451 and weighted average of 22.8%. Similarly, the statistical analysis conducted on geographies consisting of 262,500,209 people shows a substantial positive correlation between the proportion of Serbians and poverty level among females between the ages 18 and 24 in the United States with a correlation coefficient (R) of 0.598 and weighted average of 19.1%, a difference of 19.3%.
Female Poverty Among 18-24 Year Olds Correlation Summary
| Measurement | African | Serbian |
| Minimum | 2.9% | 10.5% |
| Maximum | 100.0% | 67.3% |
| Range | 97.1% | 56.8% |
| Mean | 32.4% | 21.9% |
| Median | 26.0% | 17.5% |
| Interquartile 25% (IQ1) | 20.8% | 15.2% |
| Interquartile 75% (IQ3) | 37.2% | 29.6% |
| Interquartile Range (IQR) | 16.4% | 14.4% |
| Standard Deviation (Sample) | 20.9% | 11.8% |
| Standard Deviation (Population) | 20.7% | 11.6% |
Similar Demographics by Female Poverty Among 18-24 Year Olds
Demographics Similar to Africans by Female Poverty Among 18-24 Year Olds
In terms of female poverty among 18-24 year olds, the demographic groups most similar to Africans are Seminole (22.9%, a difference of 0.090%), Iroquois (22.9%, a difference of 0.48%), Senegalese (23.0%, a difference of 0.63%), Cherokee (22.7%, a difference of 0.72%), and Sudanese (23.0%, a difference of 0.77%).
| Demographics | Rating | Rank | Female Poverty Among 18-24 Year Olds |
| U.S. Virgin Islanders | 0.0 /100 | #293 | Tragic 22.5% |
| Indonesians | 0.0 /100 | #294 | Tragic 22.5% |
| Shoshone | 0.0 /100 | #295 | Tragic 22.5% |
| Menominee | 0.0 /100 | #296 | Tragic 22.5% |
| Inupiat | 0.0 /100 | #297 | Tragic 22.6% |
| Central American Indians | 0.0 /100 | #298 | Tragic 22.6% |
| Cherokee | 0.0 /100 | #299 | Tragic 22.7% |
| Africans | 0.0 /100 | #300 | Tragic 22.8% |
| Seminole | 0.0 /100 | #301 | Tragic 22.9% |
| Iroquois | 0.0 /100 | #302 | Tragic 22.9% |
| Senegalese | 0.0 /100 | #303 | Tragic 23.0% |
| Sudanese | 0.0 /100 | #304 | Tragic 23.0% |
| Immigrants | Kuwait | 0.0 /100 | #305 | Tragic 23.0% |
| Paiute | 0.0 /100 | #306 | Tragic 23.3% |
| Cree | 0.0 /100 | #307 | Tragic 23.4% |
Demographics Similar to Serbians by Female Poverty Among 18-24 Year Olds
In terms of female poverty among 18-24 year olds, the demographic groups most similar to Serbians are Immigrants from Caribbean (19.1%, a difference of 0.040%), Immigrants from Afghanistan (19.1%, a difference of 0.040%), Ecuadorian (19.1%, a difference of 0.070%), Immigrants from Ecuador (19.2%, a difference of 0.13%), and Chilean (19.1%, a difference of 0.15%).
| Demographics | Rating | Rank | Female Poverty Among 18-24 Year Olds |
| Sierra Leoneans | 98.7 /100 | #96 | Exceptional 19.0% |
| Salvadorans | 98.4 /100 | #97 | Exceptional 19.1% |
| Immigrants | Jordan | 98.4 /100 | #98 | Exceptional 19.1% |
| Immigrants | Czechoslovakia | 98.3 /100 | #99 | Exceptional 19.1% |
| Chileans | 98.3 /100 | #100 | Exceptional 19.1% |
| Ecuadorians | 98.1 /100 | #101 | Exceptional 19.1% |
| Immigrants | Caribbean | 98.1 /100 | #102 | Exceptional 19.1% |
| Serbians | 98.0 /100 | #103 | Exceptional 19.1% |
| Immigrants | Afghanistan | 98.0 /100 | #104 | Exceptional 19.1% |
| Immigrants | Ecuador | 97.8 /100 | #105 | Exceptional 19.2% |
| Immigrants | Sierra Leone | 97.8 /100 | #106 | Exceptional 19.2% |
| Immigrants | Sri Lanka | 97.5 /100 | #107 | Exceptional 19.2% |
| Immigrants | Uzbekistan | 97.3 /100 | #108 | Exceptional 19.2% |
| Immigrants | Syria | 97.2 /100 | #109 | Exceptional 19.2% |
| Laotians | 97.1 /100 | #110 | Exceptional 19.2% |