Guatemalan vs Serbian Disability
COMPARE
Guatemalan
Serbian
Disability
Disability Comparison
Guatemalans
Serbians
11.6%
DISABILITY
65.1/ 100
METRIC RATING
159th/ 347
METRIC RANK
11.9%
DISABILITY
15.4/ 100
METRIC RATING
196th/ 347
METRIC RANK
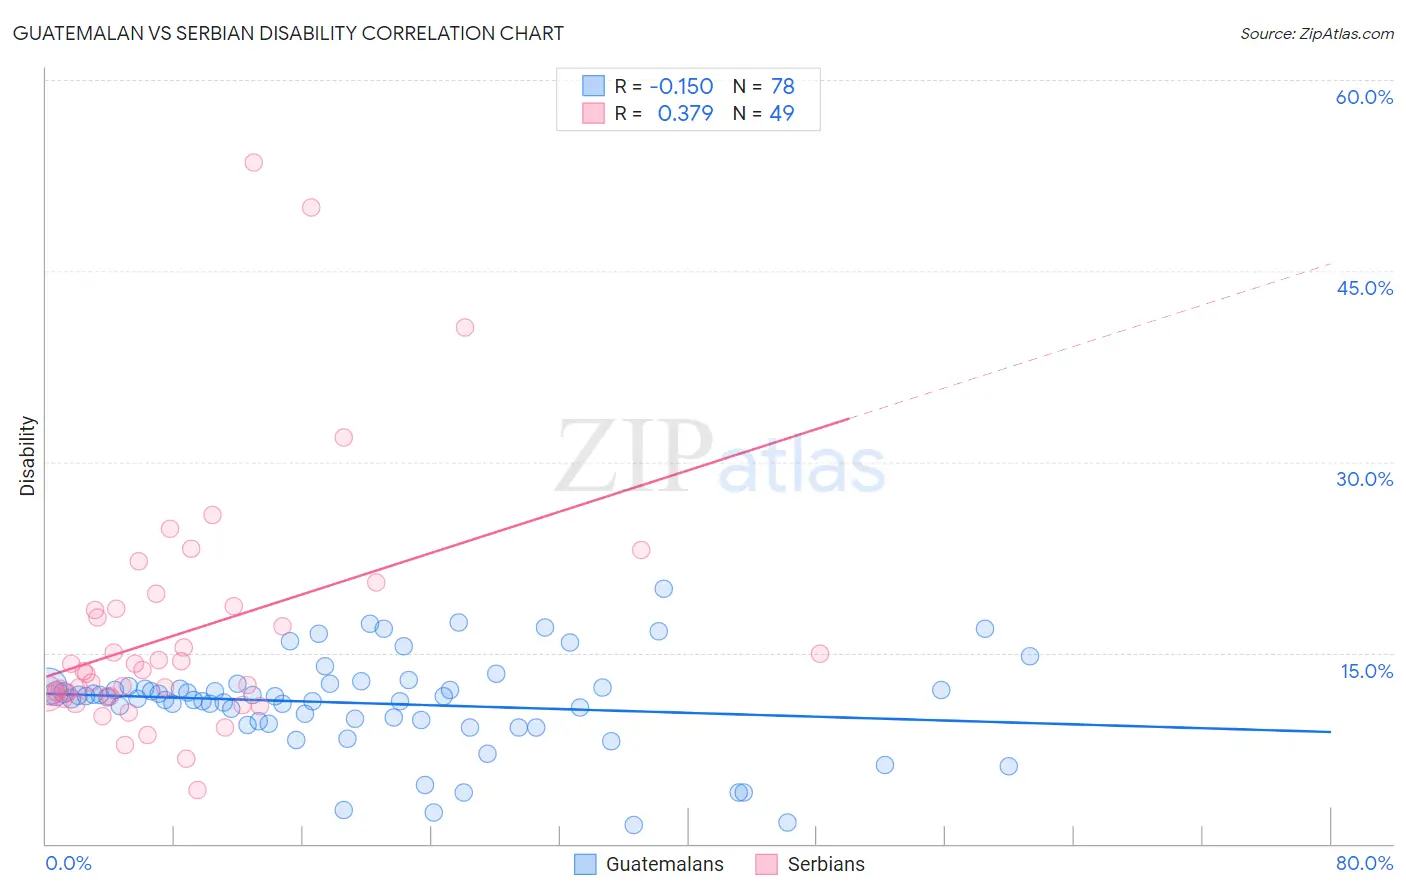
Guatemalan vs Serbian Disability Correlation Chart
The statistical analysis conducted on geographies consisting of 409,499,513 people shows a poor negative correlation between the proportion of Guatemalans and percentage of population with a disability in the United States with a correlation coefficient (R) of -0.150 and weighted average of 11.6%. Similarly, the statistical analysis conducted on geographies consisting of 267,644,318 people shows a mild positive correlation between the proportion of Serbians and percentage of population with a disability in the United States with a correlation coefficient (R) of 0.379 and weighted average of 11.9%, a difference of 2.6%.
Disability Correlation Summary
| Measurement | Guatemalan | Serbian |
| Minimum | 1.4% | 4.2% |
| Maximum | 20.0% | 53.5% |
| Range | 18.6% | 49.3% |
| Mean | 11.0% | 16.6% |
| Median | 11.5% | 13.6% |
| Interquartile 25% (IQ1) | 9.6% | 11.6% |
| Interquartile 75% (IQ3) | 12.4% | 18.6% |
| Interquartile Range (IQR) | 2.7% | 7.0% |
| Standard Deviation (Sample) | 3.7% | 9.7% |
| Standard Deviation (Population) | 3.7% | 9.6% |
Similar Demographics by Disability
Demographics Similar to Guatemalans by Disability
In terms of disability, the demographic groups most similar to Guatemalans are Armenian (11.6%, a difference of 0.040%), Immigrants from Barbados (11.6%, a difference of 0.040%), Immigrants from Cuba (11.6%, a difference of 0.11%), Immigrants from Middle Africa (11.6%, a difference of 0.22%), and Immigrants from Fiji (11.6%, a difference of 0.23%).
| Demographics | Rating | Rank | Disability |
| Immigrants | Moldova | 72.0 /100 | #152 | Good 11.6% |
| Immigrants | Ghana | 71.2 /100 | #153 | Good 11.6% |
| Immigrants | Guatemala | 71.1 /100 | #154 | Good 11.6% |
| Immigrants | Netherlands | 69.8 /100 | #155 | Good 11.6% |
| Immigrants | Fiji | 69.5 /100 | #156 | Good 11.6% |
| Immigrants | Middle Africa | 69.5 /100 | #157 | Good 11.6% |
| Armenians | 65.9 /100 | #158 | Good 11.6% |
| Guatemalans | 65.1 /100 | #159 | Good 11.6% |
| Immigrants | Barbados | 64.2 /100 | #160 | Good 11.6% |
| Immigrants | Cuba | 62.8 /100 | #161 | Good 11.6% |
| Immigrants | Haiti | 59.2 /100 | #162 | Average 11.7% |
| Immigrants | Trinidad and Tobago | 58.9 /100 | #163 | Average 11.7% |
| Syrians | 58.5 /100 | #164 | Average 11.7% |
| Cubans | 56.7 /100 | #165 | Average 11.7% |
| Pakistanis | 54.7 /100 | #166 | Average 11.7% |
Demographics Similar to Serbians by Disability
In terms of disability, the demographic groups most similar to Serbians are Immigrants from Belize (11.9%, a difference of 0.010%), Barbadian (11.9%, a difference of 0.040%), Ukrainian (11.9%, a difference of 0.060%), Immigrants from Panama (11.9%, a difference of 0.070%), and Somali (11.9%, a difference of 0.15%).
| Demographics | Rating | Rank | Disability |
| Immigrants | Zaire | 21.8 /100 | #189 | Fair 11.9% |
| Immigrants | West Indies | 21.1 /100 | #190 | Fair 11.9% |
| Ute | 19.5 /100 | #191 | Poor 11.9% |
| Lithuanians | 18.8 /100 | #192 | Poor 11.9% |
| Immigrants | Bosnia and Herzegovina | 18.0 /100 | #193 | Poor 11.9% |
| Somalis | 17.3 /100 | #194 | Poor 11.9% |
| Barbadians | 15.8 /100 | #195 | Poor 11.9% |
| Serbians | 15.4 /100 | #196 | Poor 11.9% |
| Immigrants | Belize | 15.2 /100 | #197 | Poor 11.9% |
| Ukrainians | 14.7 /100 | #198 | Poor 11.9% |
| Immigrants | Panama | 14.6 /100 | #199 | Poor 11.9% |
| Belizeans | 12.8 /100 | #200 | Poor 11.9% |
| Assyrians/Chaldeans/Syriacs | 12.6 /100 | #201 | Poor 11.9% |
| Immigrants | England | 12.0 /100 | #202 | Poor 12.0% |
| British West Indians | 11.5 /100 | #203 | Poor 12.0% |