Cajun vs Pueblo Female Disability
COMPARE
Cajun
Pueblo
Female Disability
Female Disability Comparison
Cajuns
Pueblo
14.9%
FEMALE DISABILITY
0.0/ 100
METRIC RATING
335th/ 347
METRIC RANK
14.1%
FEMALE DISABILITY
0.0/ 100
METRIC RATING
322nd/ 347
METRIC RANK
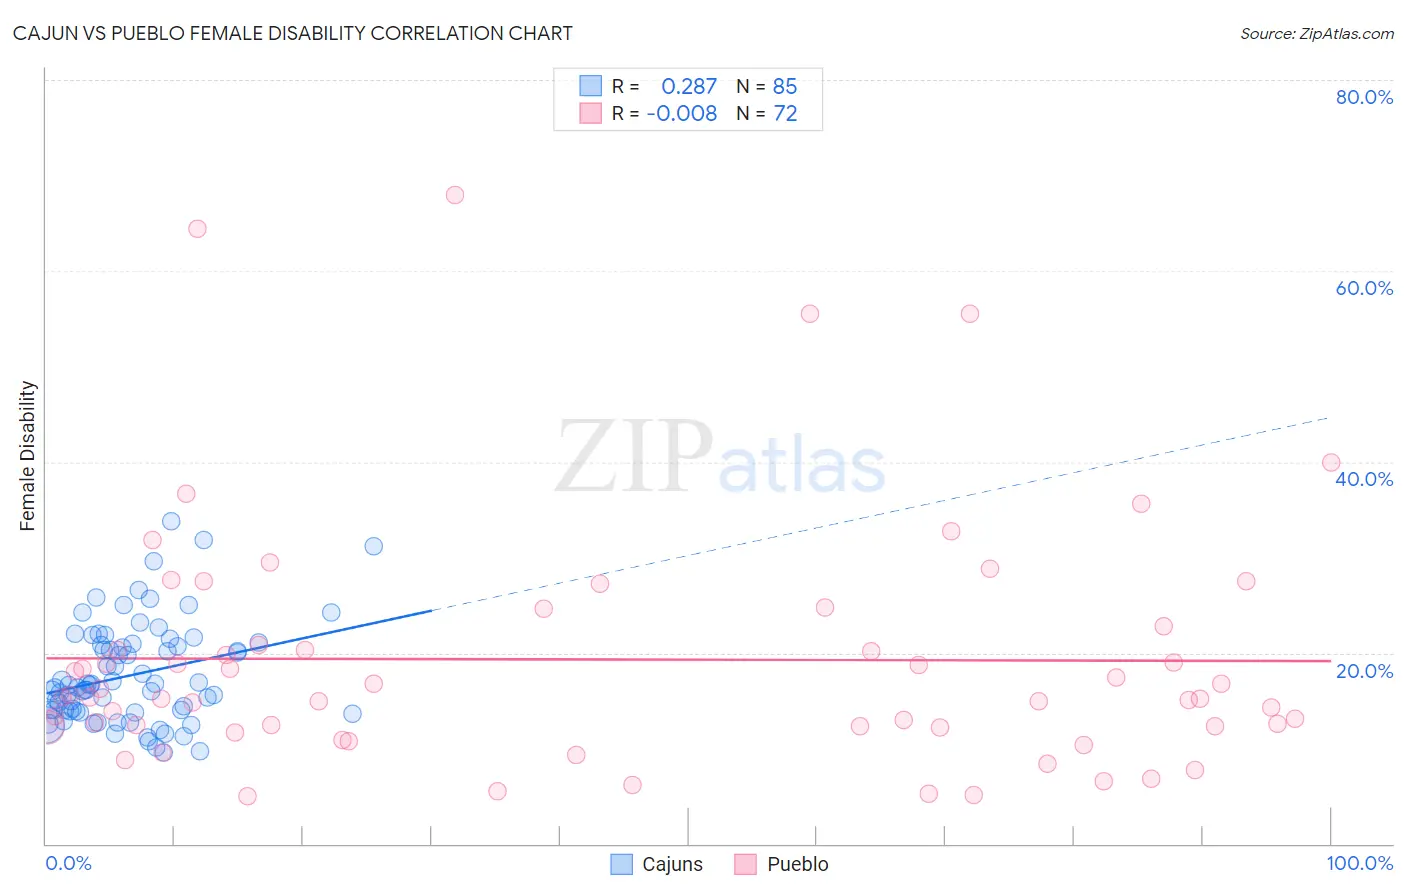
Cajun vs Pueblo Female Disability Correlation Chart
The statistical analysis conducted on geographies consisting of 149,701,485 people shows a weak positive correlation between the proportion of Cajuns and percentage of females with a disability in the United States with a correlation coefficient (R) of 0.287 and weighted average of 14.9%. Similarly, the statistical analysis conducted on geographies consisting of 120,072,777 people shows no correlation between the proportion of Pueblo and percentage of females with a disability in the United States with a correlation coefficient (R) of -0.008 and weighted average of 14.1%, a difference of 5.3%.
Female Disability Correlation Summary
| Measurement | Cajun | Pueblo |
| Minimum | 9.6% | 5.0% |
| Maximum | 33.8% | 67.9% |
| Range | 24.2% | 62.9% |
| Mean | 17.7% | 19.3% |
| Median | 16.3% | 15.4% |
| Interquartile 25% (IQ1) | 13.9% | 12.3% |
| Interquartile 75% (IQ3) | 20.9% | 21.8% |
| Interquartile Range (IQR) | 7.0% | 9.5% |
| Standard Deviation (Sample) | 5.2% | 12.9% |
| Standard Deviation (Population) | 5.2% | 12.8% |
Demographics Similar to Cajuns and Pueblo by Female Disability
In terms of female disability, the demographic groups most similar to Cajuns are Cherokee (14.9%, a difference of 0.020%), Immigrants from the Azores (14.9%, a difference of 0.11%), Pima (14.8%, a difference of 0.50%), Seminole (15.0%, a difference of 0.67%), and Tohono O'odham (15.0%, a difference of 0.80%). Similarly, the demographic groups most similar to Pueblo are Potawatomi (14.1%, a difference of 0.010%), American (14.1%, a difference of 0.15%), Black/African American (14.1%, a difference of 0.17%), Native/Alaskan (14.1%, a difference of 0.18%), and Navajo (14.2%, a difference of 0.32%).
| Demographics | Rating | Rank | Female Disability |
| Paiute | 0.0 /100 | #318 | Tragic 14.0% |
| Iroquois | 0.0 /100 | #319 | Tragic 14.0% |
| Americans | 0.0 /100 | #320 | Tragic 14.1% |
| Potawatomi | 0.0 /100 | #321 | Tragic 14.1% |
| Pueblo | 0.0 /100 | #322 | Tragic 14.1% |
| Blacks/African Americans | 0.0 /100 | #323 | Tragic 14.1% |
| Natives/Alaskans | 0.0 /100 | #324 | Tragic 14.1% |
| Navajo | 0.0 /100 | #325 | Tragic 14.2% |
| Comanche | 0.0 /100 | #326 | Tragic 14.2% |
| Ottawa | 0.0 /100 | #327 | Tragic 14.2% |
| Cape Verdeans | 0.0 /100 | #328 | Tragic 14.2% |
| Osage | 0.0 /100 | #329 | Tragic 14.3% |
| Yuman | 0.0 /100 | #330 | Tragic 14.5% |
| Immigrants | Cabo Verde | 0.0 /100 | #331 | Tragic 14.6% |
| Pima | 0.0 /100 | #332 | Tragic 14.8% |
| Immigrants | Azores | 0.0 /100 | #333 | Tragic 14.9% |
| Cherokee | 0.0 /100 | #334 | Tragic 14.9% |
| Cajuns | 0.0 /100 | #335 | Tragic 14.9% |
| Seminole | 0.0 /100 | #336 | Tragic 15.0% |
| Tohono O'odham | 0.0 /100 | #337 | Tragic 15.0% |
| Dutch West Indians | 0.0 /100 | #338 | Tragic 15.0% |