Albanian vs Pueblo Female Disability
COMPARE
Albanian
Pueblo
Female Disability
Female Disability Comparison
Albanians
Pueblo
12.3%
FEMALE DISABILITY
37.9/ 100
METRIC RATING
180th/ 347
METRIC RANK
14.1%
FEMALE DISABILITY
0.0/ 100
METRIC RATING
322nd/ 347
METRIC RANK
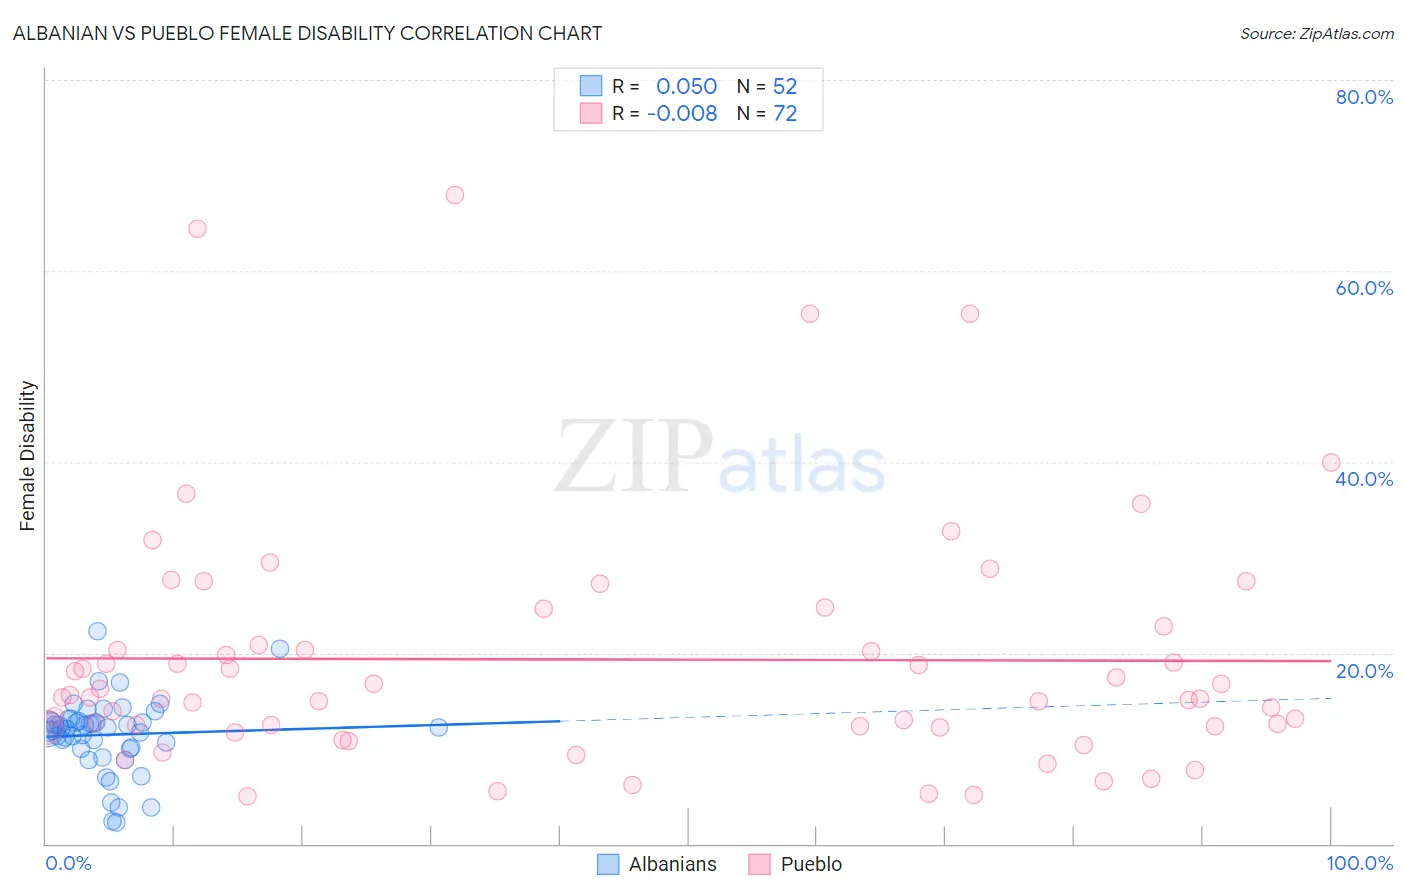
Albanian vs Pueblo Female Disability Correlation Chart
The statistical analysis conducted on geographies consisting of 193,264,096 people shows no correlation between the proportion of Albanians and percentage of females with a disability in the United States with a correlation coefficient (R) of 0.050 and weighted average of 12.3%. Similarly, the statistical analysis conducted on geographies consisting of 120,072,777 people shows no correlation between the proportion of Pueblo and percentage of females with a disability in the United States with a correlation coefficient (R) of -0.008 and weighted average of 14.1%, a difference of 15.2%.
Female Disability Correlation Summary
| Measurement | Albanian | Pueblo |
| Minimum | 2.3% | 5.0% |
| Maximum | 22.2% | 67.9% |
| Range | 20.0% | 62.9% |
| Mean | 11.4% | 19.3% |
| Median | 12.1% | 15.4% |
| Interquartile 25% (IQ1) | 10.0% | 12.3% |
| Interquartile 75% (IQ3) | 12.8% | 21.8% |
| Interquartile Range (IQR) | 2.8% | 9.5% |
| Standard Deviation (Sample) | 3.9% | 12.9% |
| Standard Deviation (Population) | 3.8% | 12.8% |
Similar Demographics by Female Disability
Demographics Similar to Albanians by Female Disability
In terms of female disability, the demographic groups most similar to Albanians are Immigrants from Fiji (12.3%, a difference of 0.010%), Immigrants from Canada (12.3%, a difference of 0.030%), Norwegian (12.3%, a difference of 0.040%), Cuban (12.3%, a difference of 0.060%), and Iraqi (12.3%, a difference of 0.080%).
| Demographics | Rating | Rank | Female Disability |
| Immigrants | Mexico | 50.8 /100 | #173 | Average 12.2% |
| Immigrants | England | 50.0 /100 | #174 | Average 12.2% |
| Immigrants | St. Vincent and the Grenadines | 49.7 /100 | #175 | Average 12.2% |
| Immigrants | Guyana | 43.1 /100 | #176 | Average 12.2% |
| Immigrants | Ghana | 42.5 /100 | #177 | Average 12.2% |
| Immigrants | Western Europe | 40.9 /100 | #178 | Average 12.2% |
| Immigrants | Fiji | 38.2 /100 | #179 | Fair 12.3% |
| Albanians | 37.9 /100 | #180 | Fair 12.3% |
| Immigrants | Canada | 37.2 /100 | #181 | Fair 12.3% |
| Norwegians | 36.9 /100 | #182 | Fair 12.3% |
| Cubans | 36.5 /100 | #183 | Fair 12.3% |
| Iraqis | 36.0 /100 | #184 | Fair 12.3% |
| Immigrants | Uzbekistan | 33.9 /100 | #185 | Fair 12.3% |
| Austrians | 33.3 /100 | #186 | Fair 12.3% |
| Serbians | 33.1 /100 | #187 | Fair 12.3% |
Demographics Similar to Pueblo by Female Disability
In terms of female disability, the demographic groups most similar to Pueblo are Potawatomi (14.1%, a difference of 0.010%), American (14.1%, a difference of 0.15%), Black/African American (14.1%, a difference of 0.17%), Native/Alaskan (14.1%, a difference of 0.18%), and Navajo (14.2%, a difference of 0.32%).
| Demographics | Rating | Rank | Female Disability |
| Alaskan Athabascans | 0.0 /100 | #315 | Tragic 13.9% |
| Spanish Americans | 0.0 /100 | #316 | Tragic 14.0% |
| Chippewa | 0.0 /100 | #317 | Tragic 14.0% |
| Paiute | 0.0 /100 | #318 | Tragic 14.0% |
| Iroquois | 0.0 /100 | #319 | Tragic 14.0% |
| Americans | 0.0 /100 | #320 | Tragic 14.1% |
| Potawatomi | 0.0 /100 | #321 | Tragic 14.1% |
| Pueblo | 0.0 /100 | #322 | Tragic 14.1% |
| Blacks/African Americans | 0.0 /100 | #323 | Tragic 14.1% |
| Natives/Alaskans | 0.0 /100 | #324 | Tragic 14.1% |
| Navajo | 0.0 /100 | #325 | Tragic 14.2% |
| Comanche | 0.0 /100 | #326 | Tragic 14.2% |
| Ottawa | 0.0 /100 | #327 | Tragic 14.2% |
| Cape Verdeans | 0.0 /100 | #328 | Tragic 14.2% |
| Osage | 0.0 /100 | #329 | Tragic 14.3% |