African vs Slovak Hearing Disability
COMPARE
African
Slovak
Hearing Disability
Hearing Disability Comparison
Africans
Slovaks
3.0%
HEARING DISABILITY
32.9/ 100
METRIC RATING
189th/ 347
METRIC RANK
3.6%
HEARING DISABILITY
0.0/ 100
METRIC RATING
279th/ 347
METRIC RANK
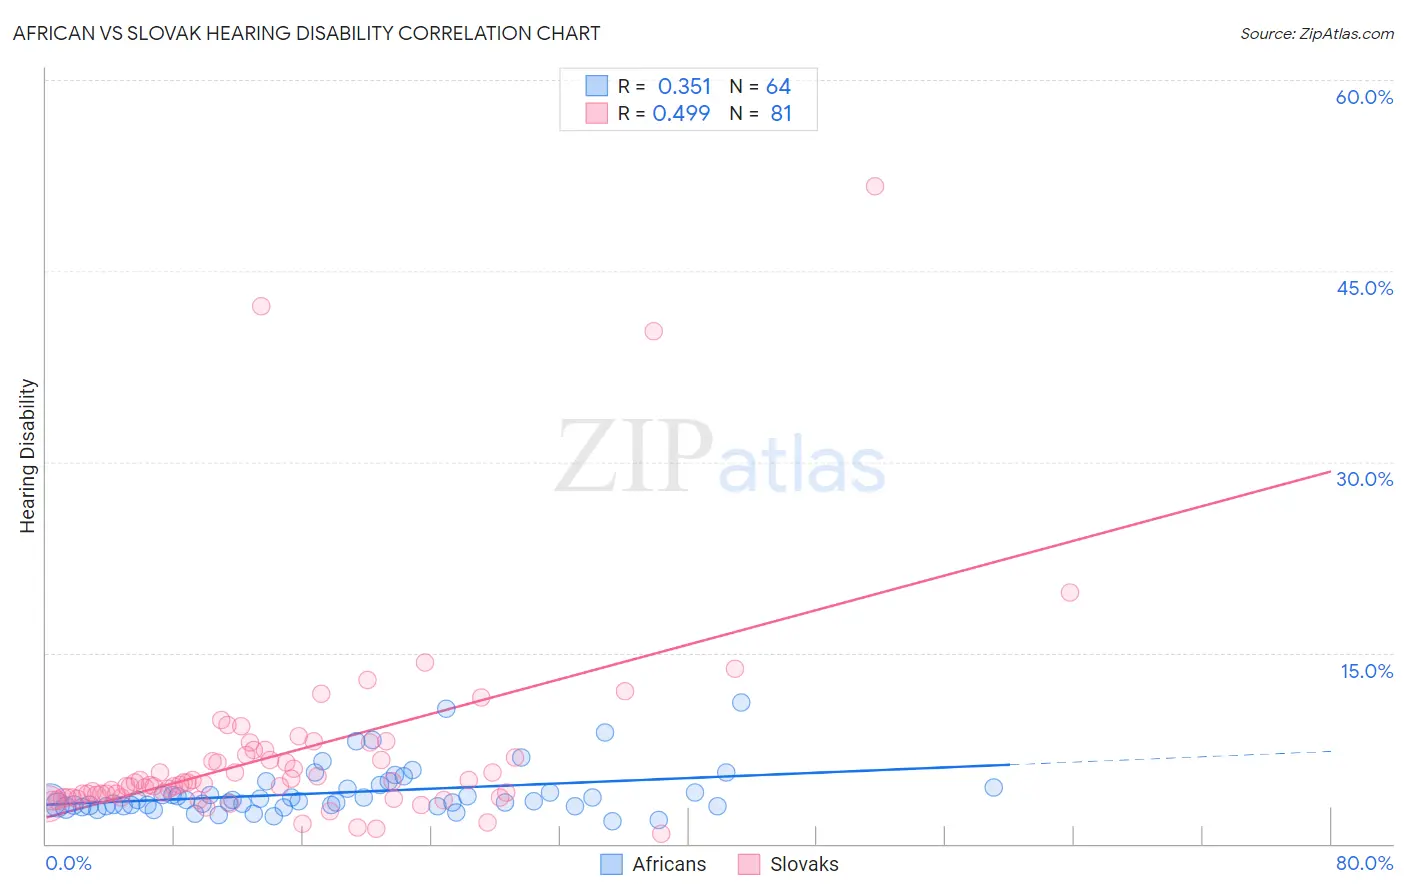
African vs Slovak Hearing Disability Correlation Chart
The statistical analysis conducted on geographies consisting of 469,733,776 people shows a mild positive correlation between the proportion of Africans and percentage of population with hearing disability in the United States with a correlation coefficient (R) of 0.351 and weighted average of 3.0%. Similarly, the statistical analysis conducted on geographies consisting of 397,764,457 people shows a moderate positive correlation between the proportion of Slovaks and percentage of population with hearing disability in the United States with a correlation coefficient (R) of 0.499 and weighted average of 3.6%, a difference of 18.3%.
Hearing Disability Correlation Summary
| Measurement | African | Slovak |
| Minimum | 1.8% | 0.74% |
| Maximum | 11.1% | 51.6% |
| Range | 9.3% | 50.9% |
| Mean | 4.0% | 7.1% |
| Median | 3.4% | 4.7% |
| Interquartile 25% (IQ1) | 3.0% | 3.7% |
| Interquartile 75% (IQ3) | 4.4% | 7.1% |
| Interquartile Range (IQR) | 1.4% | 3.5% |
| Standard Deviation (Sample) | 1.9% | 8.1% |
| Standard Deviation (Population) | 1.9% | 8.1% |
Similar Demographics by Hearing Disability
Demographics Similar to Africans by Hearing Disability
In terms of hearing disability, the demographic groups most similar to Africans are Black/African American (3.0%, a difference of 0.19%), Mexican American Indian (3.0%, a difference of 0.19%), Immigrants from South Africa (3.1%, a difference of 0.19%), Immigrants from Mexico (3.0%, a difference of 0.21%), and Immigrants from Southern Europe (3.0%, a difference of 0.25%).
| Demographics | Rating | Rank | Hearing Disability |
| Immigrants | Italy | 41.1 /100 | #182 | Average 3.0% |
| Bulgarians | 39.7 /100 | #183 | Fair 3.0% |
| Immigrants | Ireland | 37.4 /100 | #184 | Fair 3.0% |
| Immigrants | Southern Europe | 35.3 /100 | #185 | Fair 3.0% |
| Immigrants | Mexico | 34.9 /100 | #186 | Fair 3.0% |
| Blacks/African Americans | 34.7 /100 | #187 | Fair 3.0% |
| Mexican American Indians | 34.7 /100 | #188 | Fair 3.0% |
| Africans | 32.9 /100 | #189 | Fair 3.0% |
| Immigrants | South Africa | 31.1 /100 | #190 | Fair 3.1% |
| Immigrants | Switzerland | 28.8 /100 | #191 | Fair 3.1% |
| Koreans | 27.6 /100 | #192 | Fair 3.1% |
| Macedonians | 27.0 /100 | #193 | Fair 3.1% |
| South Africans | 24.5 /100 | #194 | Fair 3.1% |
| Spanish American Indians | 24.1 /100 | #195 | Fair 3.1% |
| Immigrants | Europe | 22.9 /100 | #196 | Fair 3.1% |
Demographics Similar to Slovaks by Hearing Disability
In terms of hearing disability, the demographic groups most similar to Slovaks are French American Indian (3.6%, a difference of 0.070%), Scandinavian (3.6%, a difference of 0.12%), Swedish (3.6%, a difference of 0.21%), Basque (3.6%, a difference of 0.26%), and Blackfeet (3.6%, a difference of 0.46%).
| Demographics | Rating | Rank | Hearing Disability |
| Fijians | 0.0 /100 | #272 | Tragic 3.5% |
| Puerto Ricans | 0.0 /100 | #273 | Tragic 3.5% |
| Swiss | 0.0 /100 | #274 | Tragic 3.5% |
| Czechoslovakians | 0.0 /100 | #275 | Tragic 3.6% |
| Danes | 0.0 /100 | #276 | Tragic 3.6% |
| Immigrants | Nonimmigrants | 0.0 /100 | #277 | Tragic 3.6% |
| Basques | 0.0 /100 | #278 | Tragic 3.6% |
| Slovaks | 0.0 /100 | #279 | Tragic 3.6% |
| French American Indians | 0.0 /100 | #280 | Tragic 3.6% |
| Scandinavians | 0.0 /100 | #281 | Tragic 3.6% |
| Swedes | 0.0 /100 | #282 | Tragic 3.6% |
| Blackfeet | 0.0 /100 | #283 | Tragic 3.6% |
| Immigrants | Micronesia | 0.0 /100 | #284 | Tragic 3.6% |
| Sioux | 0.0 /100 | #285 | Tragic 3.6% |
| Delaware | 0.0 /100 | #286 | Tragic 3.6% |