African vs Assyrian/Chaldean/Syriac Hearing Disability
COMPARE
African
Assyrian/Chaldean/Syriac
Hearing Disability
Hearing Disability Comparison
Africans
Assyrians/Chaldeans/Syriacs
3.0%
HEARING DISABILITY
32.9/ 100
METRIC RATING
189th/ 347
METRIC RANK
3.3%
HEARING DISABILITY
0.9/ 100
METRIC RATING
244th/ 347
METRIC RANK
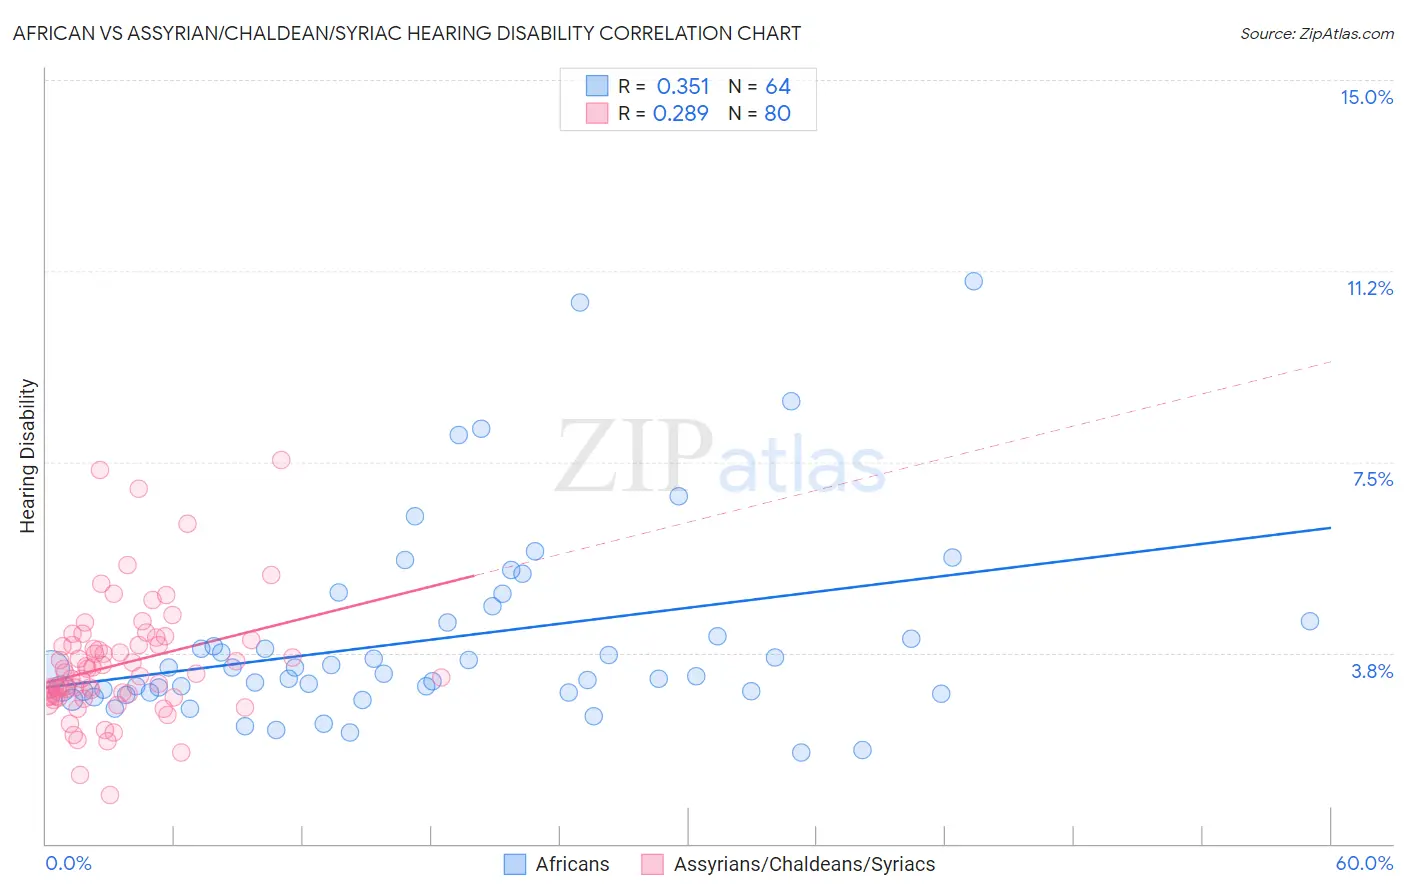
African vs Assyrian/Chaldean/Syriac Hearing Disability Correlation Chart
The statistical analysis conducted on geographies consisting of 469,733,776 people shows a mild positive correlation between the proportion of Africans and percentage of population with hearing disability in the United States with a correlation coefficient (R) of 0.351 and weighted average of 3.0%. Similarly, the statistical analysis conducted on geographies consisting of 110,312,508 people shows a weak positive correlation between the proportion of Assyrians/Chaldeans/Syriacs and percentage of population with hearing disability in the United States with a correlation coefficient (R) of 0.289 and weighted average of 3.3%, a difference of 9.1%.
Hearing Disability Correlation Summary
| Measurement | African | Assyrian/Chaldean/Syriac |
| Minimum | 1.8% | 0.96% |
| Maximum | 11.1% | 7.5% |
| Range | 9.3% | 6.6% |
| Mean | 4.0% | 3.5% |
| Median | 3.4% | 3.3% |
| Interquartile 25% (IQ1) | 3.0% | 2.9% |
| Interquartile 75% (IQ3) | 4.4% | 3.9% |
| Interquartile Range (IQR) | 1.4% | 1.0% |
| Standard Deviation (Sample) | 1.9% | 1.2% |
| Standard Deviation (Population) | 1.9% | 1.2% |
Similar Demographics by Hearing Disability
Demographics Similar to Africans by Hearing Disability
In terms of hearing disability, the demographic groups most similar to Africans are Black/African American (3.0%, a difference of 0.19%), Mexican American Indian (3.0%, a difference of 0.19%), Immigrants from South Africa (3.1%, a difference of 0.19%), Immigrants from Mexico (3.0%, a difference of 0.21%), and Immigrants from Southern Europe (3.0%, a difference of 0.25%).
| Demographics | Rating | Rank | Hearing Disability |
| Immigrants | Italy | 41.1 /100 | #182 | Average 3.0% |
| Bulgarians | 39.7 /100 | #183 | Fair 3.0% |
| Immigrants | Ireland | 37.4 /100 | #184 | Fair 3.0% |
| Immigrants | Southern Europe | 35.3 /100 | #185 | Fair 3.0% |
| Immigrants | Mexico | 34.9 /100 | #186 | Fair 3.0% |
| Blacks/African Americans | 34.7 /100 | #187 | Fair 3.0% |
| Mexican American Indians | 34.7 /100 | #188 | Fair 3.0% |
| Africans | 32.9 /100 | #189 | Fair 3.0% |
| Immigrants | South Africa | 31.1 /100 | #190 | Fair 3.1% |
| Immigrants | Switzerland | 28.8 /100 | #191 | Fair 3.1% |
| Koreans | 27.6 /100 | #192 | Fair 3.1% |
| Macedonians | 27.0 /100 | #193 | Fair 3.1% |
| South Africans | 24.5 /100 | #194 | Fair 3.1% |
| Spanish American Indians | 24.1 /100 | #195 | Fair 3.1% |
| Immigrants | Europe | 22.9 /100 | #196 | Fair 3.1% |
Demographics Similar to Assyrians/Chaldeans/Syriacs by Hearing Disability
In terms of hearing disability, the demographic groups most similar to Assyrians/Chaldeans/Syriacs are Immigrants from Western Europe (3.3%, a difference of 0.070%), Yugoslavian (3.3%, a difference of 0.24%), Immigrants from Scotland (3.3%, a difference of 0.34%), Samoan (3.3%, a difference of 0.35%), and Immigrants from Netherlands (3.3%, a difference of 0.43%).
| Demographics | Rating | Rank | Hearing Disability |
| Immigrants | Austria | 1.8 /100 | #237 | Tragic 3.3% |
| German Russians | 1.8 /100 | #238 | Tragic 3.3% |
| Nepalese | 1.2 /100 | #239 | Tragic 3.3% |
| Immigrants | Netherlands | 1.1 /100 | #240 | Tragic 3.3% |
| Samoans | 1.1 /100 | #241 | Tragic 3.3% |
| Yugoslavians | 1.0 /100 | #242 | Tragic 3.3% |
| Immigrants | Western Europe | 1.0 /100 | #243 | Tragic 3.3% |
| Assyrians/Chaldeans/Syriacs | 0.9 /100 | #244 | Tragic 3.3% |
| Immigrants | Scotland | 0.8 /100 | #245 | Tragic 3.3% |
| Immigrants | England | 0.7 /100 | #246 | Tragic 3.3% |
| Lithuanians | 0.6 /100 | #247 | Tragic 3.4% |
| Austrians | 0.6 /100 | #248 | Tragic 3.4% |
| Italians | 0.4 /100 | #249 | Tragic 3.4% |
| Yuman | 0.4 /100 | #250 | Tragic 3.4% |
| Hungarians | 0.4 /100 | #251 | Tragic 3.4% |