Huntington, AR Map & Demographics
Huntington Map
Huntington Overview
$16,646
PER CAPITA INCOME
$43,438
AVG FAMILY INCOME
$35,000
AVG HOUSEHOLD INCOME
31.8%
WAGE / INCOME GAP [ % ]
68.2¢/ $1
WAGE / INCOME GAP [ $ ]
$3,880
FAMILY INCOME DEFICIT
0.35
INEQUALITY / GINI INDEX
490
TOTAL POPULATION
252
MALE POPULATION
238
FEMALE POPULATION
105.88
MALES / 100 FEMALES
94.44
FEMALES / 100 MALES
34.3
MEDIAN AGE
3.4
AVG FAMILY SIZE
2.8
AVG HOUSEHOLD SIZE
188
LABOR FORCE [ PEOPLE ]
54.8%
PERCENT IN LABOR FORCE
6.4%
UNEMPLOYMENT RATE
Huntington Zip Codes
Huntington Area Codes
Income in Huntington
Income Overview in Huntington
Per Capita Income in Huntington is $16,646, while median incomes of families and households are $43,438 and $35,000 respectively.
| Characteristic | Number | Measure |
| Per Capita Income | 490 | $16,646 |
| Median Family Income | 118 | $43,438 |
| Mean Family Income | 118 | $50,312 |
| Median Household Income | 176 | $35,000 |
| Mean Household Income | 176 | $44,898 |
| Income Deficit | 118 | $3,880 |
| Wage / Income Gap (%) | 490 | 31.81% |
| Wage / Income Gap ($) | 490 | 68.19¢ per $1 |
| Gini / Inequality Index | 490 | 0.35 |
Earnings by Sex in Huntington
Average Earnings in Huntington are $27,422, $34,464 for men and $23,500 for women, a difference of 31.8%.
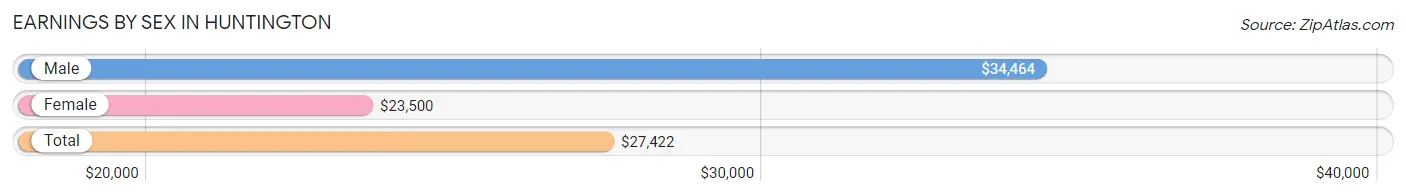
| Sex | Number | Average Earnings |
| Male | 93 (48.7%) | $34,464 |
| Female | 98 (51.3%) | $23,500 |
| Total | 191 (100.0%) | $27,422 |
Earnings by Sex by Income Bracket in Huntington
The most common earnings brackets in Huntington are $40,000 to $44,999 for men (18 | 19.4%) and $10,000 to $12,499 for women (15 | 15.3%).
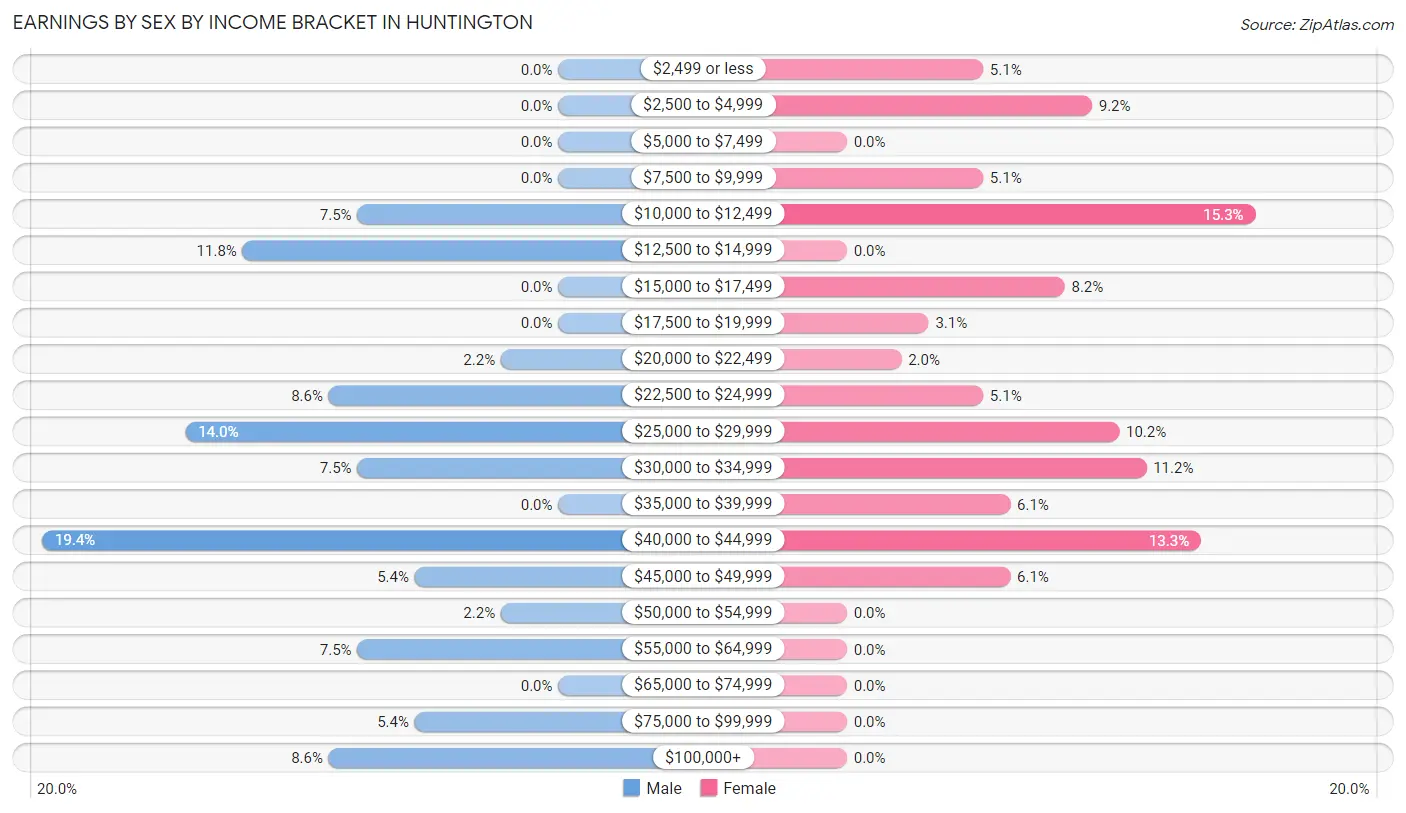
| Income | Male | Female |
| $2,499 or less | 0 (0.0%) | 5 (5.1%) |
| $2,500 to $4,999 | 0 (0.0%) | 9 (9.2%) |
| $5,000 to $7,499 | 0 (0.0%) | 0 (0.0%) |
| $7,500 to $9,999 | 0 (0.0%) | 5 (5.1%) |
| $10,000 to $12,499 | 7 (7.5%) | 15 (15.3%) |
| $12,500 to $14,999 | 11 (11.8%) | 0 (0.0%) |
| $15,000 to $17,499 | 0 (0.0%) | 8 (8.2%) |
| $17,500 to $19,999 | 0 (0.0%) | 3 (3.1%) |
| $20,000 to $22,499 | 2 (2.1%) | 2 (2.0%) |
| $22,500 to $24,999 | 8 (8.6%) | 5 (5.1%) |
| $25,000 to $29,999 | 13 (14.0%) | 10 (10.2%) |
| $30,000 to $34,999 | 7 (7.5%) | 11 (11.2%) |
| $35,000 to $39,999 | 0 (0.0%) | 6 (6.1%) |
| $40,000 to $44,999 | 18 (19.4%) | 13 (13.3%) |
| $45,000 to $49,999 | 5 (5.4%) | 6 (6.1%) |
| $50,000 to $54,999 | 2 (2.1%) | 0 (0.0%) |
| $55,000 to $64,999 | 7 (7.5%) | 0 (0.0%) |
| $65,000 to $74,999 | 0 (0.0%) | 0 (0.0%) |
| $75,000 to $99,999 | 5 (5.4%) | 0 (0.0%) |
| $100,000+ | 8 (8.6%) | 0 (0.0%) |
| Total | 93 (100.0%) | 98 (100.0%) |
Earnings by Sex by Educational Attainment in Huntington
Average earnings in Huntington are $43,015 for men and $25,417 for women, a difference of 40.9%. Men with an educational attainment of less than high school enjoy the highest average annual earnings of $42,778, while those with high school diploma education earn the least with $42,656. Women with an educational attainment of college or associate's degree earn the most with the average annual earnings of $32,841, while those with high school diploma education have the smallest earnings of $26,667.
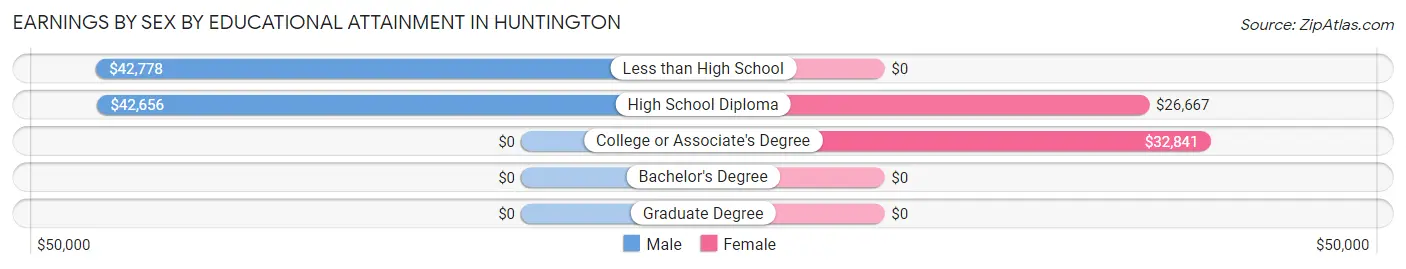
| Educational Attainment | Male Income | Female Income |
| Less than High School | $42,778 | $0 |
| High School Diploma | $42,656 | $26,667 |
| College or Associate's Degree | - | - |
| Bachelor's Degree | - | - |
| Graduate Degree | - | - |
| Total | $43,015 | $25,417 |
Family Income in Huntington
Family Income Brackets in Huntington
According to the Huntington family income data, there are 34 families falling into the $25,000 to $34,999 income range, which is the most common income bracket and makes up 28.8% of all families.
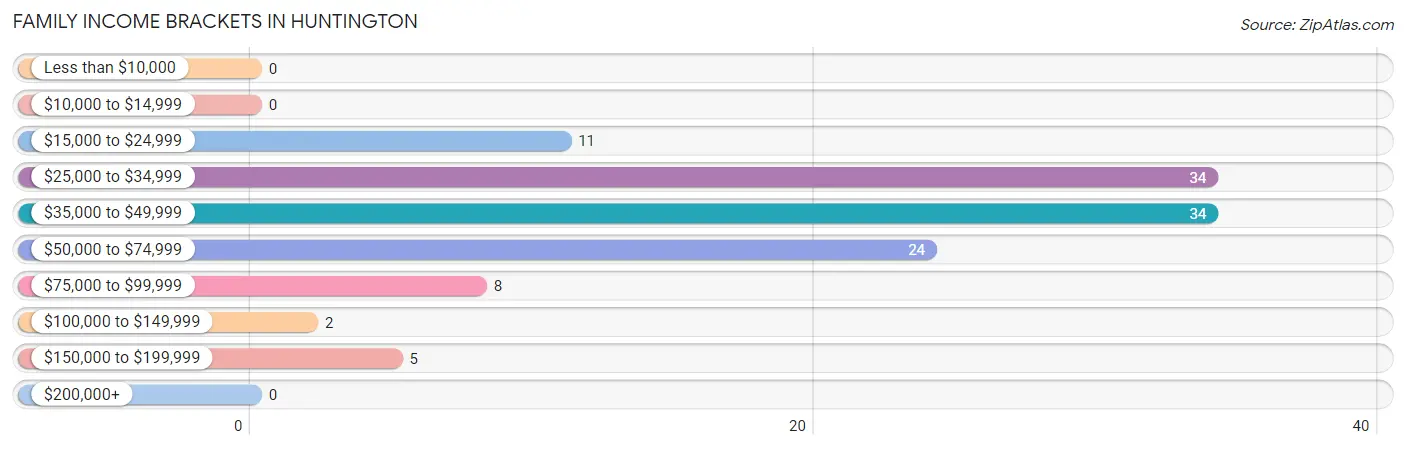
| Income Bracket | # Families | % Families |
| Less than $10,000 | 0 | 0.0% |
| $10,000 to $14,999 | 0 | 0.0% |
| $15,000 to $24,999 | 11 | 9.3% |
| $25,000 to $34,999 | 34 | 28.8% |
| $35,000 to $49,999 | 34 | 28.8% |
| $50,000 to $74,999 | 24 | 20.3% |
| $75,000 to $99,999 | 8 | 6.8% |
| $100,000 to $149,999 | 2 | 1.7% |
| $150,000 to $199,999 | 5 | 4.2% |
| $200,000+ | 0 | 0.0% |
Family Income by Famaliy Size in Huntington
2-person families (34 | 28.8%) account for the highest median family income in Huntington with $48,750 per family, while 2-person families (34 | 28.8%) have the highest median income of $24,375 per family member.
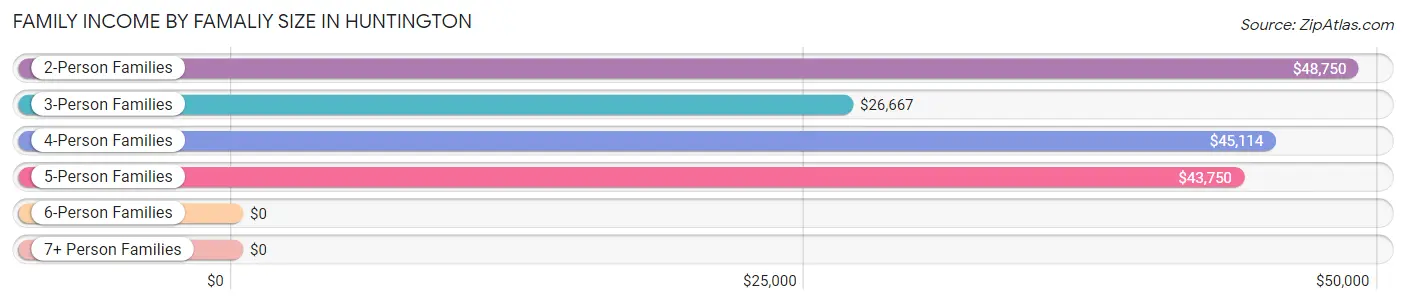
| Income Bracket | # Families | Median Income |
| 2-Person Families | 34 (28.8%) | $48,750 |
| 3-Person Families | 30 (25.4%) | $26,667 |
| 4-Person Families | 33 (28.0%) | $45,114 |
| 5-Person Families | 7 (5.9%) | $43,750 |
| 6-Person Families | 13 (11.0%) | $0 |
| 7+ Person Families | 1 (0.9%) | $0 |
| Total | 118 (100.0%) | $43,438 |
Family Income by Number of Earners in Huntington
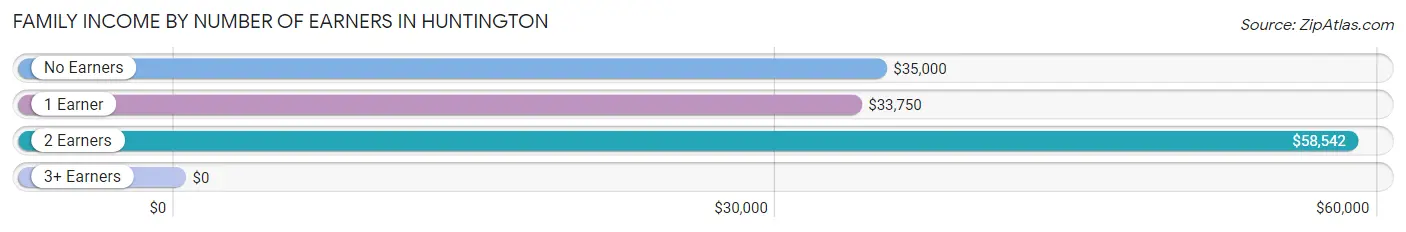
| Number of Earners | # Families | Median Income |
| No Earners | 22 (18.6%) | $35,000 |
| 1 Earner | 54 (45.8%) | $33,750 |
| 2 Earners | 37 (31.4%) | $58,542 |
| 3+ Earners | 5 (4.2%) | $0 |
| Total | 118 (100.0%) | $43,438 |
Household Income in Huntington
Household Income Brackets in Huntington
With 41 households falling in the category, the $15,000 to $24,999 income range is the most frequent in Huntington, accounting for 23.3% of all households.
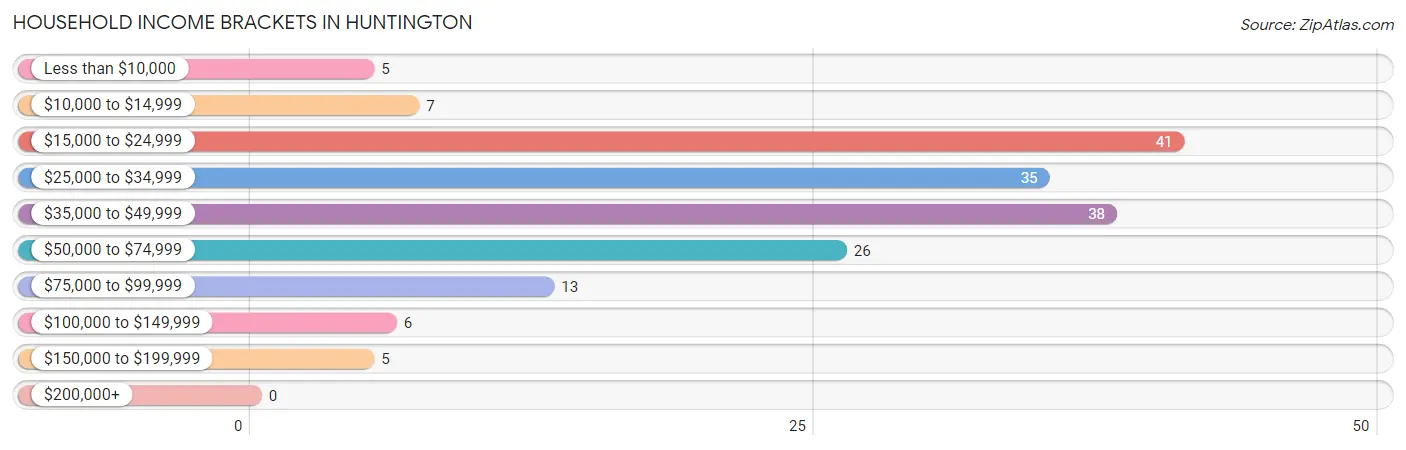
| Income Bracket | # Households | % Households |
| Less than $10,000 | 5 | 2.8% |
| $10,000 to $14,999 | 7 | 4.0% |
| $15,000 to $24,999 | 41 | 23.3% |
| $25,000 to $34,999 | 35 | 19.9% |
| $35,000 to $49,999 | 38 | 21.6% |
| $50,000 to $74,999 | 26 | 14.8% |
| $75,000 to $99,999 | 13 | 7.4% |
| $100,000 to $149,999 | 6 | 3.4% |
| $150,000 to $199,999 | 5 | 2.8% |
| $200,000+ | 0 | 0.0% |
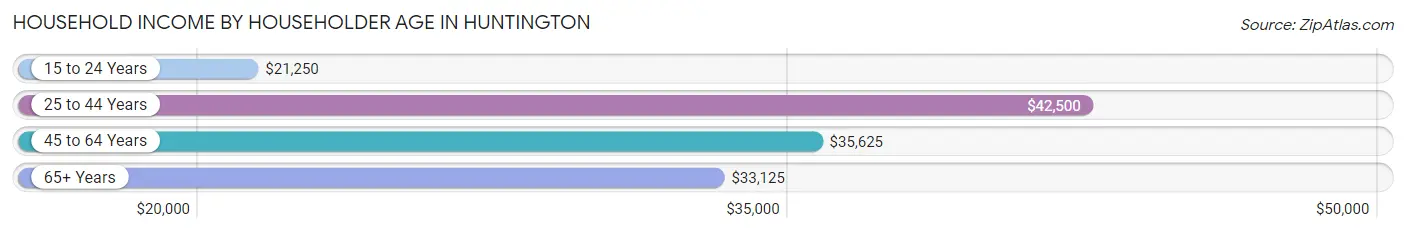
Household Income by Householder Age in Huntington
The median household income in Huntington is $35,000, with the highest median household income of $42,500 found in the 25 to 44 years age bracket for the primary householder. A total of 74 households (42.0%) fall into this category. Meanwhile, the 15 to 24 years age bracket for the primary householder has the lowest median household income of $21,250, with 4 households (2.3%) in this group.
| Income Bracket | # Households | Median Income |
| 15 to 24 Years | 4 (2.3%) | $21,250 |
| 25 to 44 Years | 74 (42.0%) | $42,500 |
| 45 to 64 Years | 43 (24.4%) | $35,625 |
| 65+ Years | 55 (31.2%) | $33,125 |
| Total | 176 (100.0%) | $35,000 |
Poverty in Huntington
Income Below Poverty by Sex and Age in Huntington
With 20.2% poverty level for males and 28.8% for females among the residents of Huntington, 5 year old males and 15 year old females are the most vulnerable to poverty, with 7 males (53.8%) and 3 females (75.0%) in their respective age groups living below the poverty level.
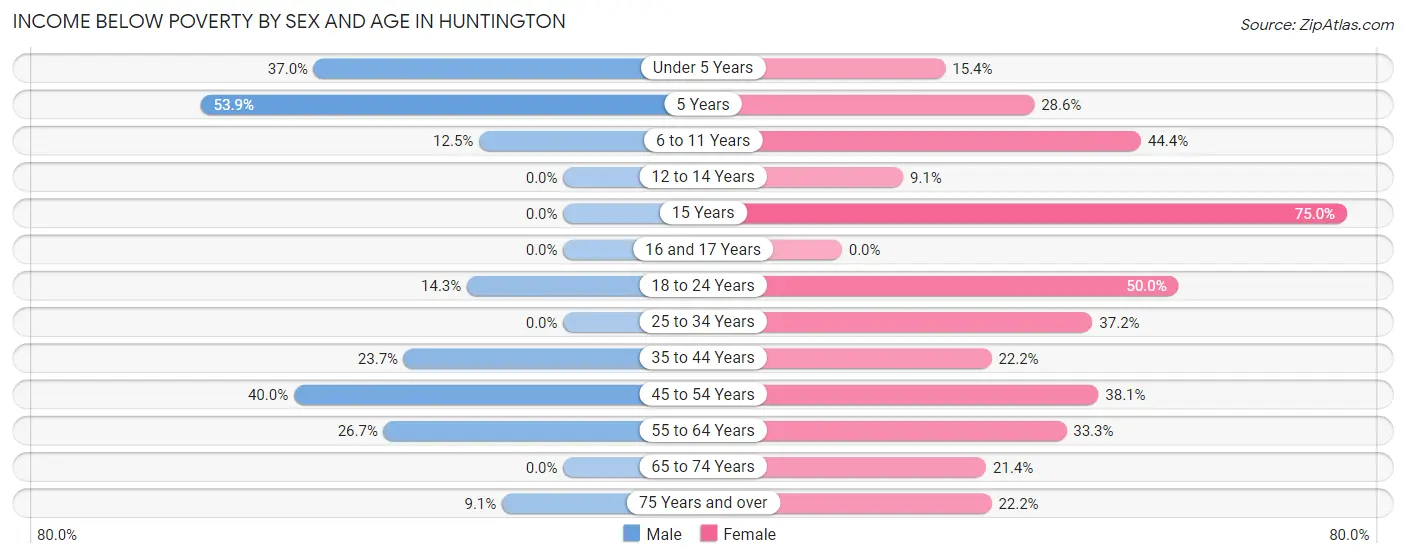
| Age Bracket | Male | Female |
| Under 5 Years | 10 (37.0%) | 2 (15.4%) |
| 5 Years | 7 (53.8%) | 2 (28.6%) |
| 6 to 11 Years | 4 (12.5%) | 8 (44.4%) |
| 12 to 14 Years | 0 (0.0%) | 2 (9.1%) |
| 15 Years | 0 (0.0%) | 3 (75.0%) |
| 16 and 17 Years | 0 (0.0%) | 0 (0.0%) |
| 18 to 24 Years | 2 (14.3%) | 4 (50.0%) |
| 25 to 34 Years | 0 (0.0%) | 16 (37.2%) |
| 35 to 44 Years | 9 (23.7%) | 6 (22.2%) |
| 45 to 54 Years | 14 (40.0%) | 8 (38.1%) |
| 55 to 64 Years | 4 (26.7%) | 7 (33.3%) |
| 65 to 74 Years | 0 (0.0%) | 6 (21.4%) |
| 75 Years and over | 1 (9.1%) | 4 (22.2%) |
| Total | 51 (20.2%) | 68 (28.8%) |
Income Above Poverty by Sex and Age in Huntington
According to the poverty statistics in Huntington, males aged 12 to 14 years and females aged 16 and 17 years are the age groups that are most secure financially, with 100.0% of males and 100.0% of females in these age groups living above the poverty line.
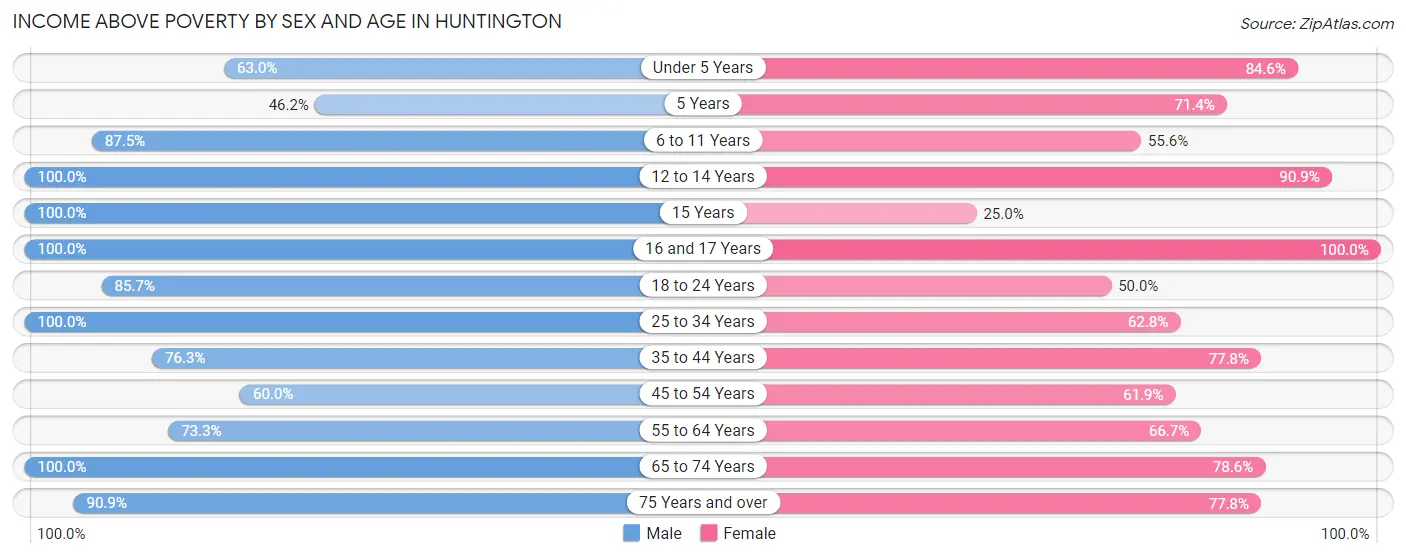
| Age Bracket | Male | Female |
| Under 5 Years | 17 (63.0%) | 11 (84.6%) |
| 5 Years | 6 (46.2%) | 5 (71.4%) |
| 6 to 11 Years | 28 (87.5%) | 10 (55.6%) |
| 12 to 14 Years | 6 (100.0%) | 20 (90.9%) |
| 15 Years | 3 (100.0%) | 1 (25.0%) |
| 16 and 17 Years | 7 (100.0%) | 6 (100.0%) |
| 18 to 24 Years | 12 (85.7%) | 4 (50.0%) |
| 25 to 34 Years | 39 (100.0%) | 27 (62.8%) |
| 35 to 44 Years | 29 (76.3%) | 21 (77.8%) |
| 45 to 54 Years | 21 (60.0%) | 13 (61.9%) |
| 55 to 64 Years | 11 (73.3%) | 14 (66.7%) |
| 65 to 74 Years | 12 (100.0%) | 22 (78.6%) |
| 75 Years and over | 10 (90.9%) | 14 (77.8%) |
| Total | 201 (79.8%) | 168 (71.2%) |
Income Below Poverty Among Married-Couple Families in Huntington
The poverty statistics for married-couple families in Huntington show that 8.2% or 7 of the total 85 families live below the poverty line. Families with 3 or 4 children have the highest poverty rate of 15.8%, comprising of 3 families. On the other hand, families with no children have the lowest poverty rate of 0.0%, which includes 0 families.
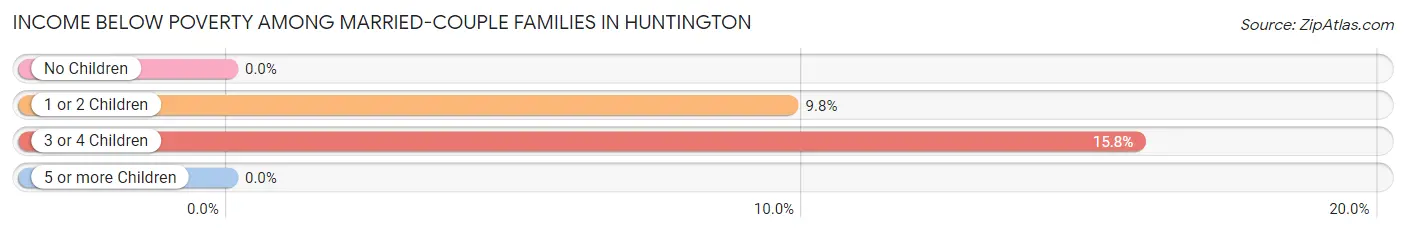
| Children | Above Poverty | Below Poverty |
| No Children | 25 (100.0%) | 0 (0.0%) |
| 1 or 2 Children | 37 (90.2%) | 4 (9.8%) |
| 3 or 4 Children | 16 (84.2%) | 3 (15.8%) |
| 5 or more Children | 0 (0.0%) | 0 (0.0%) |
| Total | 78 (91.8%) | 7 (8.2%) |
Income Below Poverty Among Single-Parent Households in Huntington
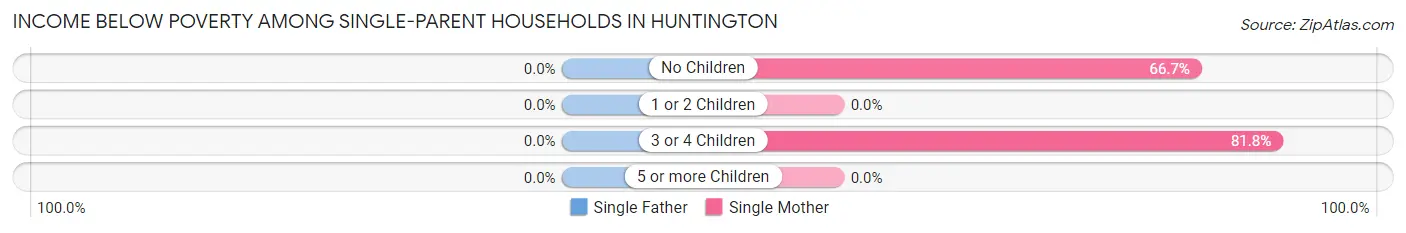
| Children | Single Father | Single Mother |
| No Children | 0 (0.0%) | 4 (66.7%) |
| 1 or 2 Children | 0 (0.0%) | 0 (0.0%) |
| 3 or 4 Children | 0 (0.0%) | 9 (81.8%) |
| 5 or more Children | 0 (0.0%) | 0 (0.0%) |
| Total | 0 (0.0%) | 13 (56.5%) |
Income Below Poverty Among Married-Couple vs Single-Parent Households in Huntington
The poverty data for Huntington shows that 7 of the married-couple family households (8.2%) and 13 of the single-parent households (39.4%) are living below the poverty level. Within the married-couple family households, those with 3 or 4 children have the highest poverty rate, with 3 households (15.8%) falling below the poverty line. Among the single-parent households, those with 3 or 4 children have the highest poverty rate, with 9 household (81.8%) living below poverty.
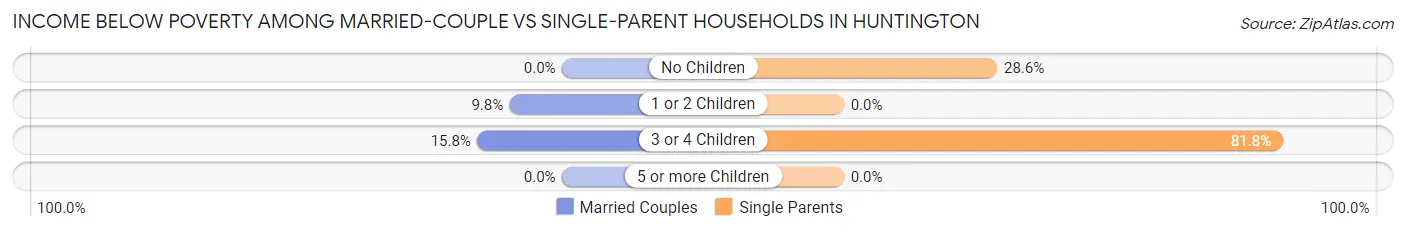
| Children | Married-Couple Families | Single-Parent Households |
| No Children | 0 (0.0%) | 4 (28.6%) |
| 1 or 2 Children | 4 (9.8%) | 0 (0.0%) |
| 3 or 4 Children | 3 (15.8%) | 9 (81.8%) |
| 5 or more Children | 0 (0.0%) | 0 (0.0%) |
| Total | 7 (8.2%) | 13 (39.4%) |
Race in Huntington
The most populous races in Huntington are White / Caucasian (442 | 90.2%), Two or more Races (40 | 8.2%), and Hispanic or Latino (10 | 2.0%).
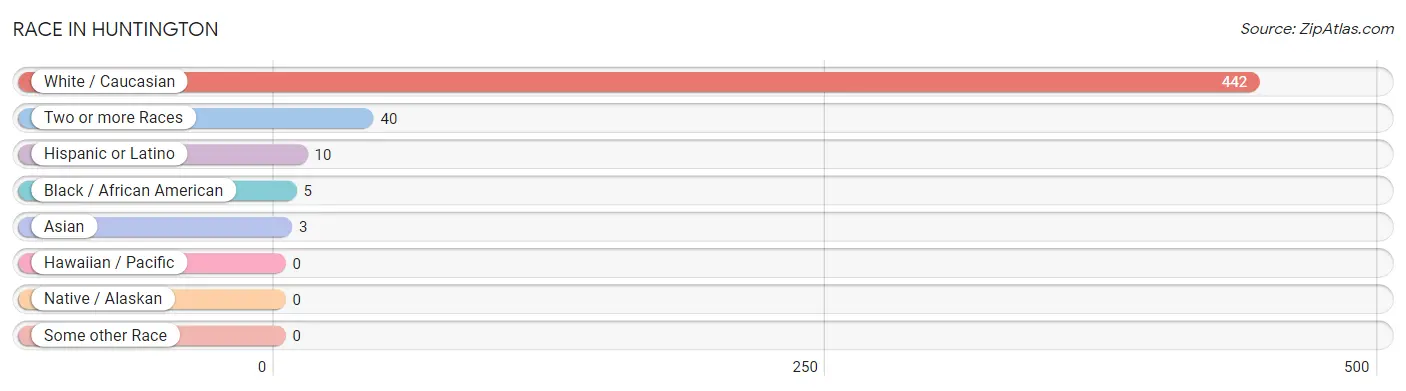
| Race | # Population | % Population |
| Asian | 3 | 0.6% |
| Black / African American | 5 | 1.0% |
| Hawaiian / Pacific | 0 | 0.0% |
| Hispanic or Latino | 10 | 2.0% |
| Native / Alaskan | 0 | 0.0% |
| White / Caucasian | 442 | 90.2% |
| Two or more Races | 40 | 8.2% |
| Some other Race | 0 | 0.0% |
| Total | 490 | 100.0% |
Ancestry in Huntington
The most populous ancestries reported in Huntington are Irish (93 | 19.0%), American (84 | 17.1%), German (33 | 6.7%), English (26 | 5.3%), and Cherokee (15 | 3.1%), together accounting for 51.2% of all Huntington residents.
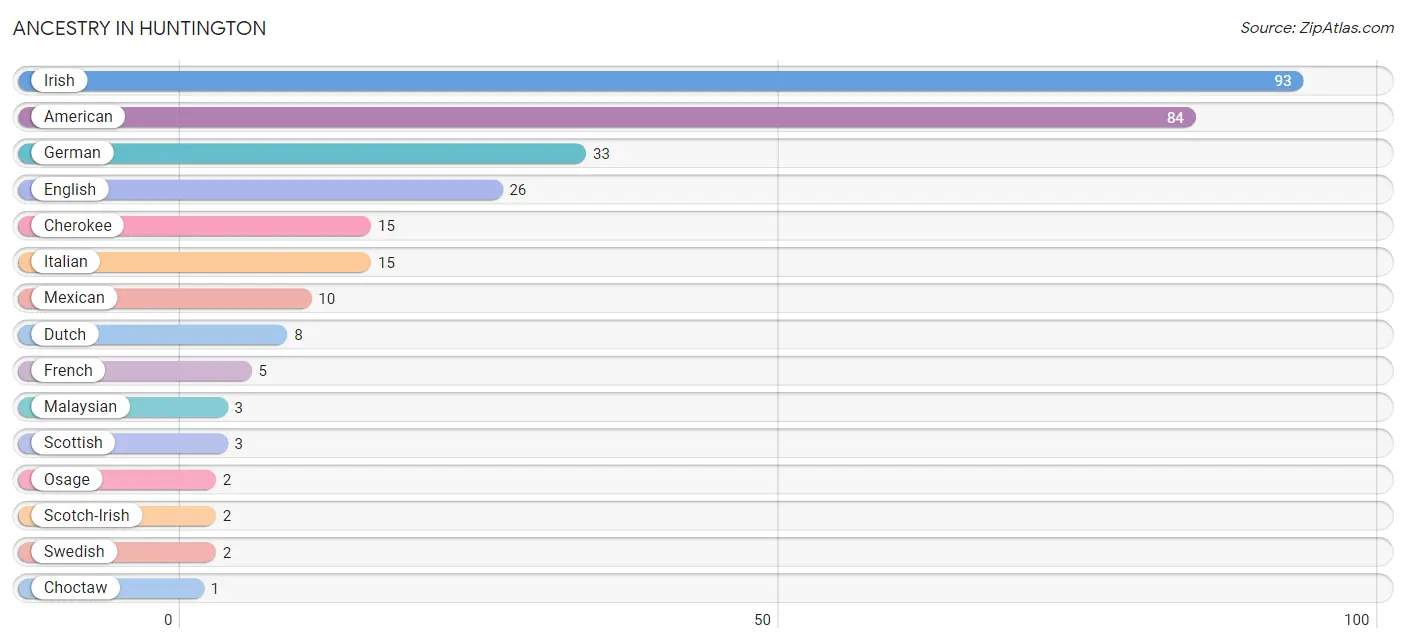
| Ancestry | # Population | % Population |
| American | 84 | 17.1% |
| Cherokee | 15 | 3.1% |
| Choctaw | 1 | 0.2% |
| Dutch | 8 | 1.6% |
| English | 26 | 5.3% |
| French | 5 | 1.0% |
| German | 33 | 6.7% |
| Irish | 93 | 19.0% |
| Italian | 15 | 3.1% |
| Malaysian | 3 | 0.6% |
| Mexican | 10 | 2.0% |
| Osage | 2 | 0.4% |
| Scotch-Irish | 2 | 0.4% |
| Scottish | 3 | 0.6% |
| Swedish | 2 | 0.4% | View All 15 Rows |
Immigrants in Huntington

| Immigration Origin | # Population | % Population | View All 0 Rows |
Sex and Age in Huntington
Sex and Age in Huntington
The most populous age groups in Huntington are 5 to 9 Years (36 | 14.3%) for men and 10 to 14 Years (25 | 10.5%) for women.
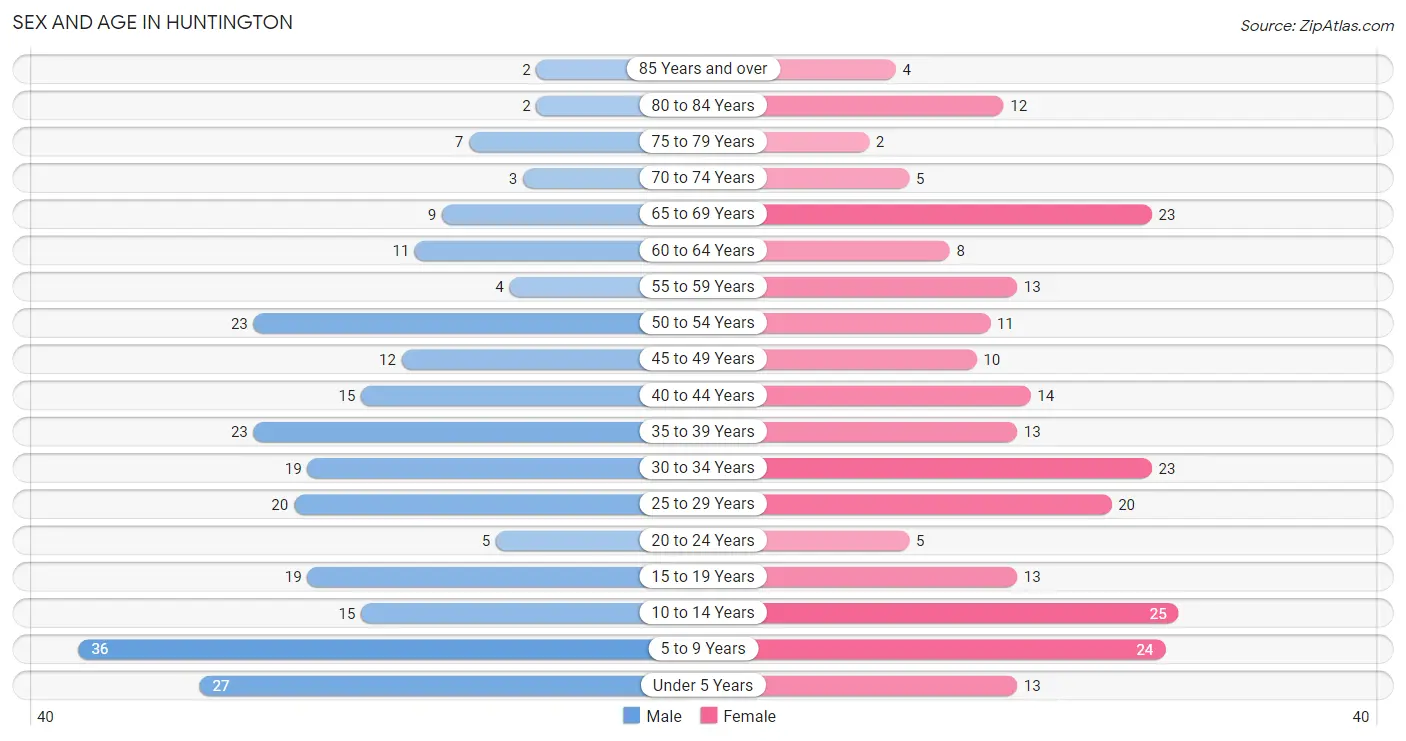
| Age Bracket | Male | Female |
| Under 5 Years | 27 (10.7%) | 13 (5.5%) |
| 5 to 9 Years | 36 (14.3%) | 24 (10.1%) |
| 10 to 14 Years | 15 (5.9%) | 25 (10.5%) |
| 15 to 19 Years | 19 (7.5%) | 13 (5.5%) |
| 20 to 24 Years | 5 (2.0%) | 5 (2.1%) |
| 25 to 29 Years | 20 (7.9%) | 20 (8.4%) |
| 30 to 34 Years | 19 (7.5%) | 23 (9.7%) |
| 35 to 39 Years | 23 (9.1%) | 13 (5.5%) |
| 40 to 44 Years | 15 (5.9%) | 14 (5.9%) |
| 45 to 49 Years | 12 (4.8%) | 10 (4.2%) |
| 50 to 54 Years | 23 (9.1%) | 11 (4.6%) |
| 55 to 59 Years | 4 (1.6%) | 13 (5.5%) |
| 60 to 64 Years | 11 (4.4%) | 8 (3.4%) |
| 65 to 69 Years | 9 (3.6%) | 23 (9.7%) |
| 70 to 74 Years | 3 (1.2%) | 5 (2.1%) |
| 75 to 79 Years | 7 (2.8%) | 2 (0.8%) |
| 80 to 84 Years | 2 (0.8%) | 12 (5.0%) |
| 85 Years and over | 2 (0.8%) | 4 (1.7%) |
| Total | 252 (100.0%) | 238 (100.0%) |
Families and Households in Huntington
Median Family Size in Huntington
The median family size in Huntington is 3.43 persons per family, with single female/mother families (23 | 19.5%) accounting for the largest median family size of 3.65 persons per family. On the other hand, single male/father families (10 | 8.5%) represent the smallest median family size with 1.90 persons per family.
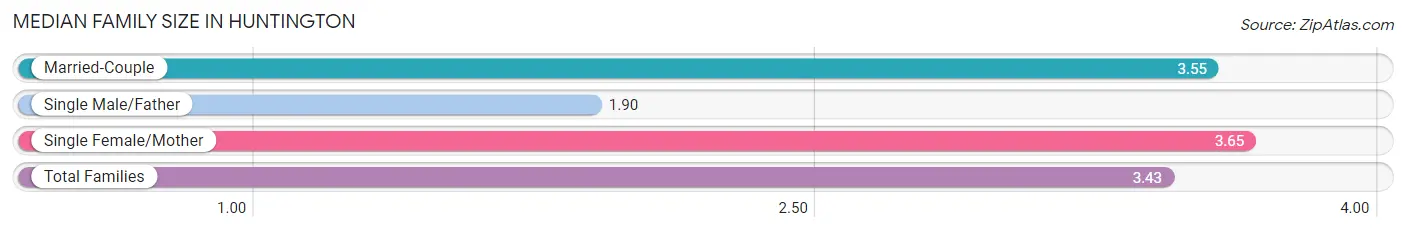
| Family Type | # Families | Family Size |
| Married-Couple | 85 (72.0%) | 3.55 |
| Single Male/Father | 10 (8.5%) | 1.90 |
| Single Female/Mother | 23 (19.5%) | 3.65 |
| Total Families | 118 (100.0%) | 3.43 |
Median Household Size in Huntington
The median household size in Huntington is 2.78 persons per household, with single female/mother households (23 | 13.1%) accounting for the largest median household size of 3.74 persons per household. non-family households (58 | 33.0%) represent the smallest median household size with 1.43 persons per household.
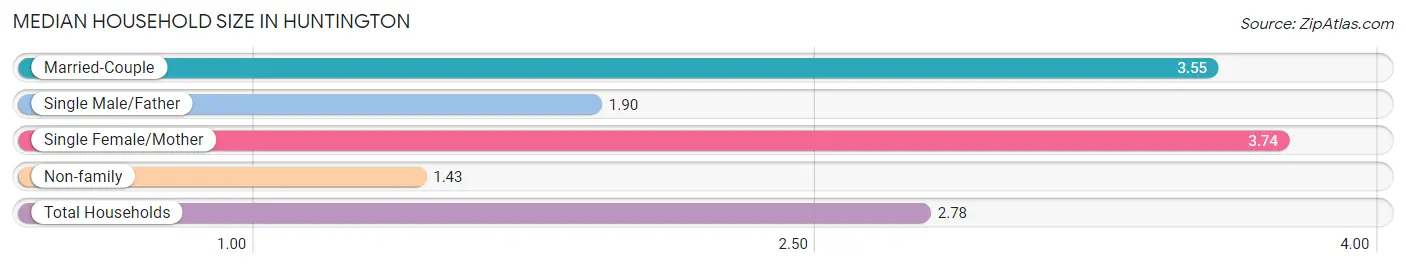
| Household Type | # Households | Household Size |
| Married-Couple | 85 (48.3%) | 3.55 |
| Single Male/Father | 10 (5.7%) | 1.90 |
| Single Female/Mother | 23 (13.1%) | 3.74 |
| Non-family | 58 (33.0%) | 1.43 |
| Total Households | 176 (100.0%) | 2.78 |
Household Size by Marriage Status in Huntington
Out of a total of 176 households in Huntington, 118 (67.0%) are family households, while 58 (33.0%) are nonfamily households. The most numerous type of family households are 2-person households, comprising 34, and the most common type of nonfamily households are 1-person households, comprising 43.
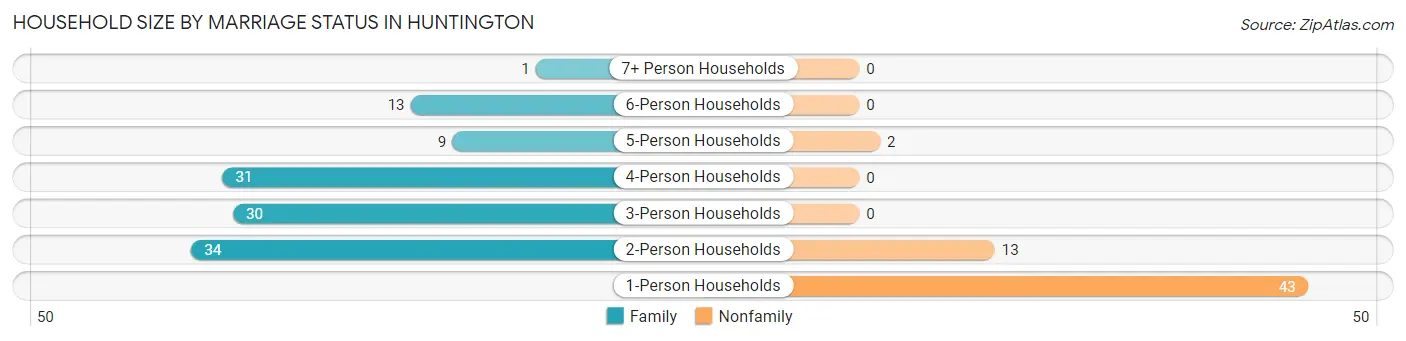
| Household Size | Family Households | Nonfamily Households |
| 1-Person Households | - | 43 (24.4%) |
| 2-Person Households | 34 (19.3%) | 13 (7.4%) |
| 3-Person Households | 30 (17.1%) | 0 (0.0%) |
| 4-Person Households | 31 (17.6%) | 0 (0.0%) |
| 5-Person Households | 9 (5.1%) | 2 (1.1%) |
| 6-Person Households | 13 (7.4%) | 0 (0.0%) |
| 7+ Person Households | 1 (0.6%) | 0 (0.0%) |
| Total | 118 (67.0%) | 58 (33.0%) |
Female Fertility in Huntington
Fertility by Age in Huntington
Average fertility rate in Huntington is 184.0 births per 1,000 women. Women in the age bracket of 20 to 34 years have the highest fertility rate with 375.0 births per 1,000 women. Women in the age bracket of 20 to 34 years acount for 100.0% of all women with births.
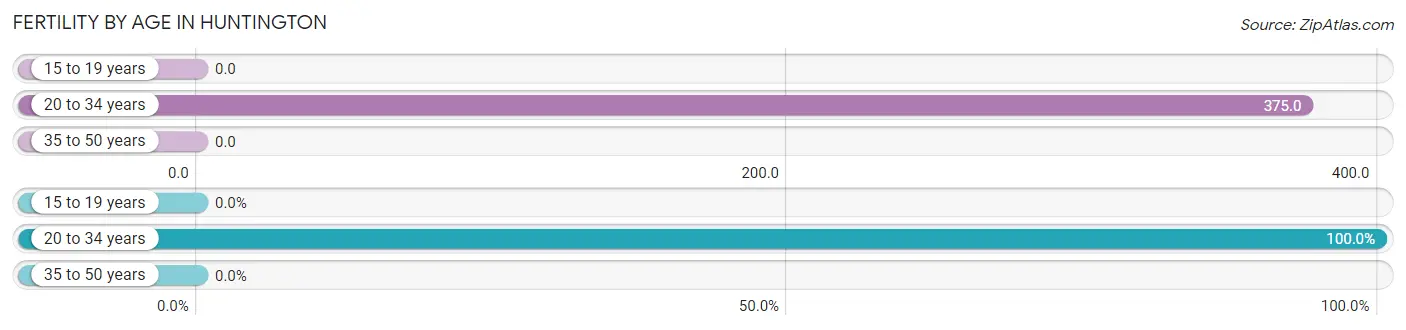
| Age Bracket | Women with Births | Births / 1,000 Women |
| 15 to 19 years | 0 (0.0%) | 0.0 |
| 20 to 34 years | 18 (100.0%) | 375.0 |
| 35 to 50 years | 0 (0.0%) | 0.0 |
| Total | 18 (100.0%) | 184.0 |
Fertility by Age by Marriage Status in Huntington
77.8% of women with births (18) in Huntington are married. The highest percentage of unmarried women with births falls into 20 to 34 years age bracket with 22.2% of them unmarried at the time of birth, while the lowest percentage of unmarried women with births belong to 20 to 34 years age bracket with 22.2% of them unmarried.
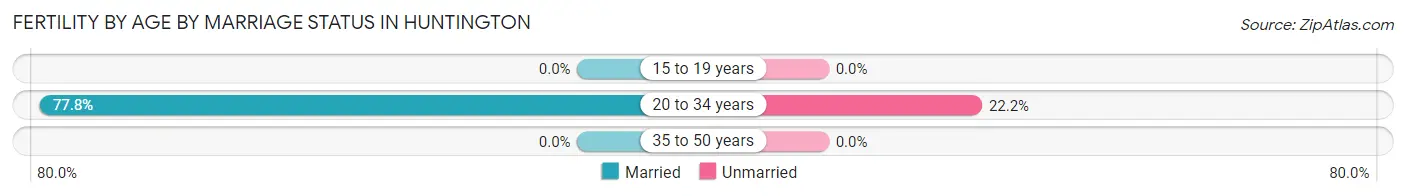
| Age Bracket | Married | Unmarried |
| 15 to 19 years | 0 (0.0%) | 0 (0.0%) |
| 20 to 34 years | 14 (77.8%) | 4 (22.2%) |
| 35 to 50 years | 0 (0.0%) | 0 (0.0%) |
| Total | 14 (77.8%) | 4 (22.2%) |
Fertility by Education in Huntington
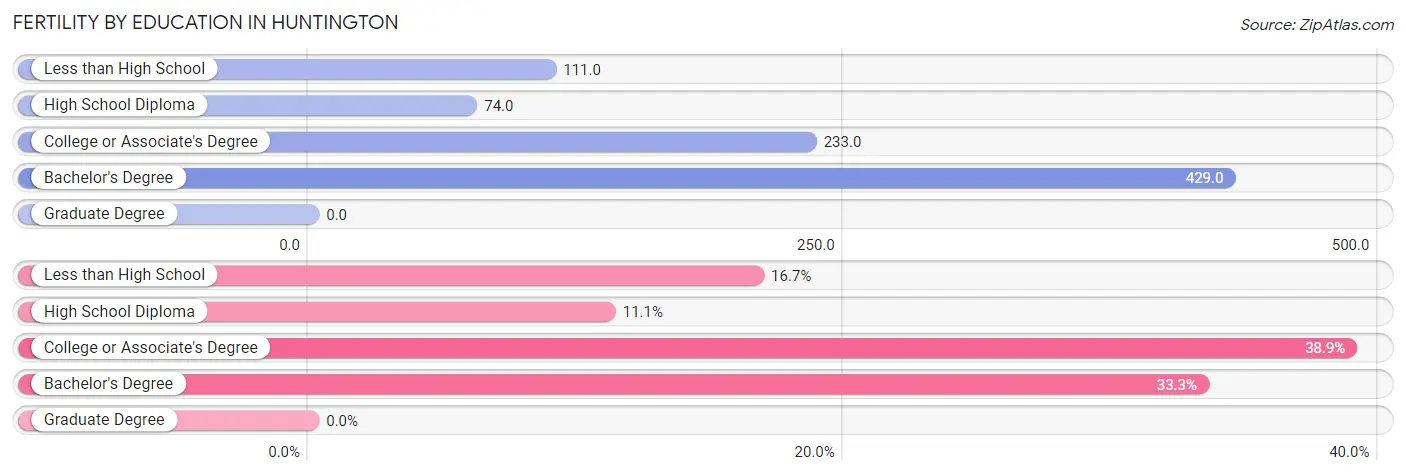
| Educational Attainment | Women with Births | Births / 1,000 Women |
| Less than High School | 3 (16.7%) | 111.0 |
| High School Diploma | 2 (11.1%) | 74.0 |
| College or Associate's Degree | 7 (38.9%) | 233.0 |
| Bachelor's Degree | 6 (33.3%) | 429.0 |
| Graduate Degree | 0 (0.0%) | 0.0 |
| Total | 18 (100.0%) | 184.0 |
Fertility by Education by Marriage Status in Huntington
22.2% of women with births in Huntington are unmarried. Women with the educational attainment of college or associate's degree are most likely to be married with 100.0% of them married at childbirth, while women with the educational attainment of high school diploma are least likely to be married with 100.0% of them unmarried at childbirth.
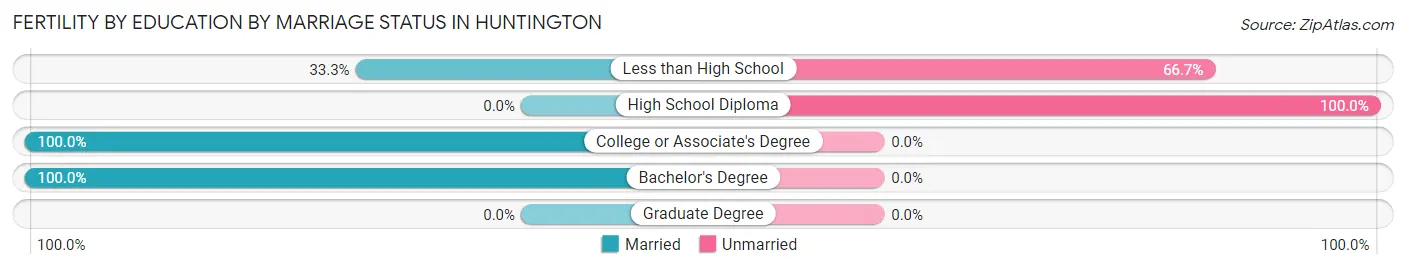
| Educational Attainment | Married | Unmarried |
| Less than High School | 1 (33.3%) | 2 (66.7%) |
| High School Diploma | 0 (0.0%) | 2 (100.0%) |
| College or Associate's Degree | 7 (100.0%) | 0 (0.0%) |
| Bachelor's Degree | 6 (100.0%) | 0 (0.0%) |
| Graduate Degree | 0 (0.0%) | 0 (0.0%) |
| Total | 14 (77.8%) | 4 (22.2%) |
Employment Characteristics in Huntington
Employment by Class of Employer in Huntington
Among the 170 employed individuals in Huntington, private company employees (120 | 70.6%), self-employed (not incorporated) (17 | 10.0%), and state government employees (15 | 8.8%) make up the most common classes of employment.
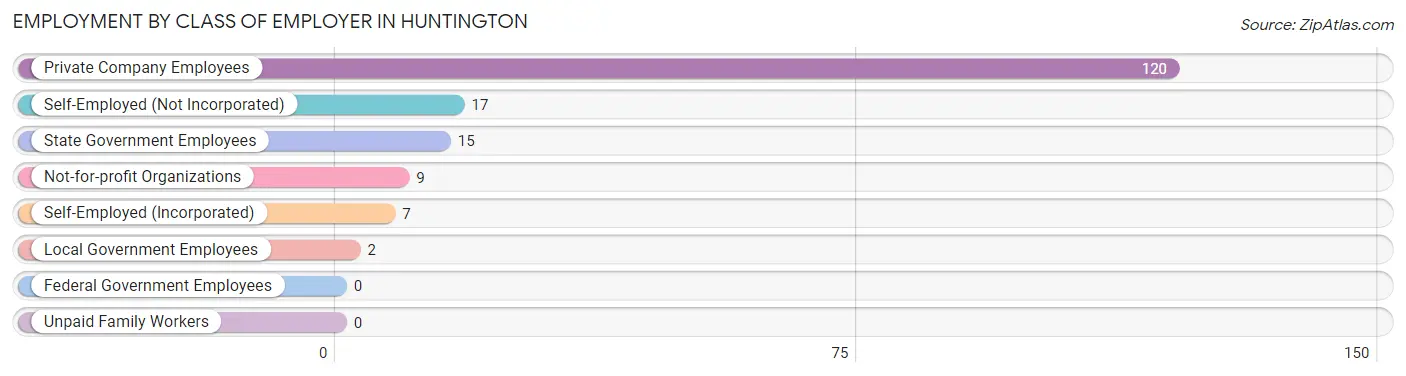
| Employer Class | # Employees | % Employees |
| Private Company Employees | 120 | 70.6% |
| Self-Employed (Incorporated) | 7 | 4.1% |
| Self-Employed (Not Incorporated) | 17 | 10.0% |
| Not-for-profit Organizations | 9 | 5.3% |
| Local Government Employees | 2 | 1.2% |
| State Government Employees | 15 | 8.8% |
| Federal Government Employees | 0 | 0.0% |
| Unpaid Family Workers | 0 | 0.0% |
| Total | 170 | 100.0% |
Employment Status by Age in Huntington
According to the labor force statistics for Huntington, out of the total population over 16 years of age (343), 54.8% or 188 individuals are in the labor force, with 6.4% or 12 of them unemployed. The age group with the highest labor force participation rate is 30 to 34 years, with 92.9% or 39 individuals in the labor force. Within the labor force, the 20 to 24 years age range has the highest percentage of unemployed individuals, with 28.6% or 2 of them being unemployed.
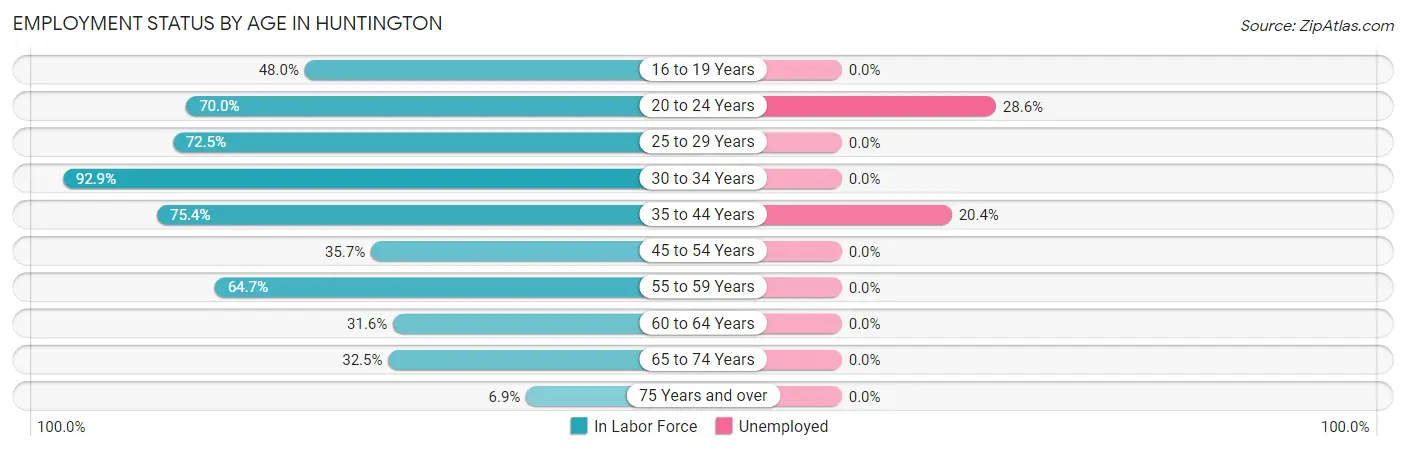
| Age Bracket | In Labor Force | Unemployed |
| 16 to 19 Years | 12 (48.0%) | 0 (0.0%) |
| 20 to 24 Years | 7 (70.0%) | 2 (28.6%) |
| 25 to 29 Years | 29 (72.5%) | 0 (0.0%) |
| 30 to 34 Years | 39 (92.9%) | 0 (0.0%) |
| 35 to 44 Years | 49 (75.4%) | 10 (20.4%) |
| 45 to 54 Years | 20 (35.7%) | 0 (0.0%) |
| 55 to 59 Years | 11 (64.7%) | 0 (0.0%) |
| 60 to 64 Years | 6 (31.6%) | 0 (0.0%) |
| 65 to 74 Years | 13 (32.5%) | 0 (0.0%) |
| 75 Years and over | 2 (6.9%) | 0 (0.0%) |
| Total | 188 (54.8%) | 12 (6.4%) |
Employment Status by Educational Attainment in Huntington
According to labor force statistics for Huntington, 64.4% of individuals (154) out of the total population between 25 and 64 years of age (239) are in the labor force, with 6.5% or 10 of them being unemployed. The group with the highest labor force participation rate are those with the educational attainment of bachelor's degree or higher, with 91.7% or 22 individuals in the labor force. Within the labor force, individuals with college / associate degree education have the highest percentage of unemployment, with 12.2% or 5 of them being unemployed.
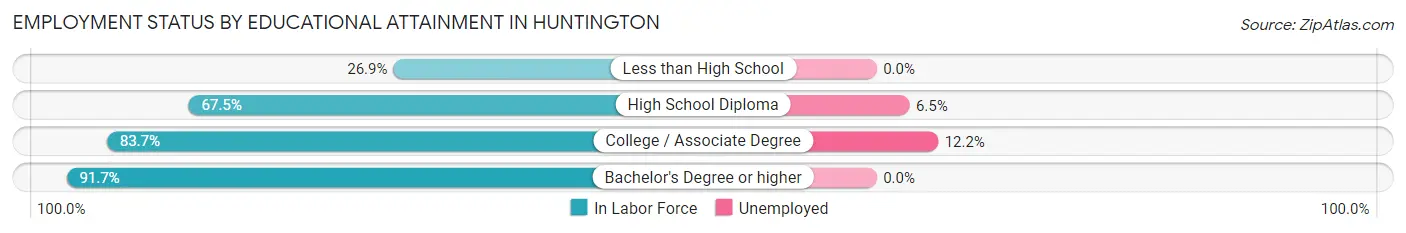
| Educational Attainment | In Labor Force | Unemployed |
| Less than High School | 14 (26.9%) | 0 (0.0%) |
| High School Diploma | 77 (67.5%) | 7 (6.5%) |
| College / Associate Degree | 41 (83.7%) | 6 (12.2%) |
| Bachelor's Degree or higher | 22 (91.7%) | 0 (0.0%) |
| Total | 154 (64.4%) | 16 (6.5%) |
Employment Occupations by Sex in Huntington
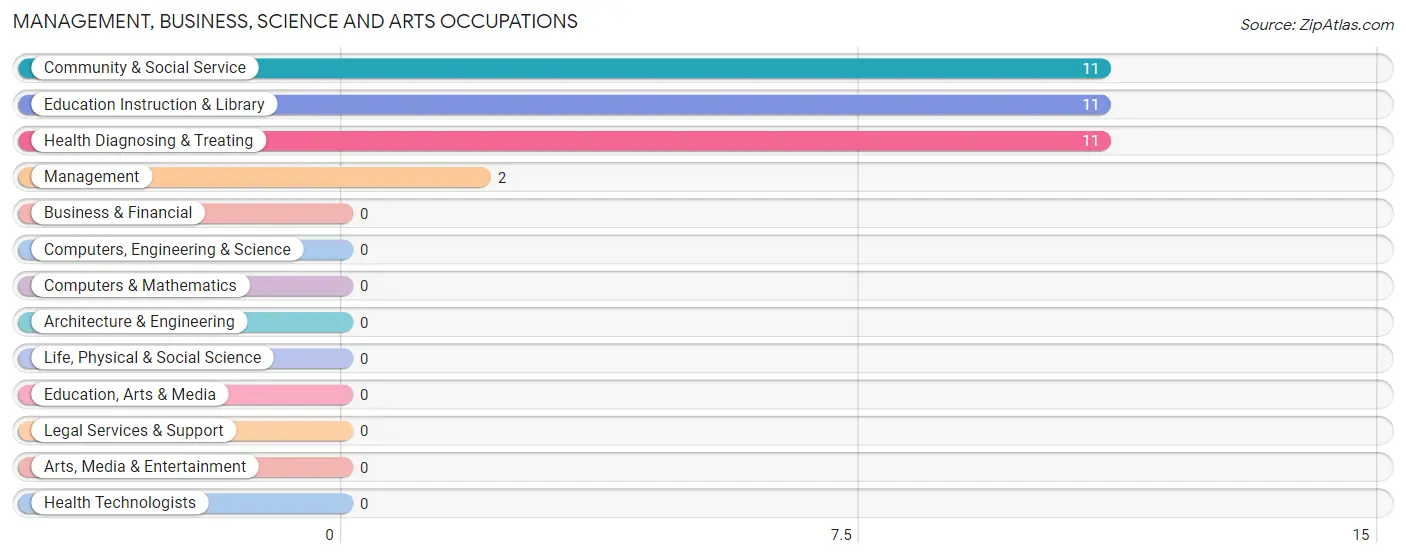
Management, Business, Science and Arts Occupations
The most common Management, Business, Science and Arts occupations in Huntington are Community & Social Service (11 | 6.2%), Education Instruction & Library (11 | 6.2%), Health Diagnosing & Treating (11 | 6.2%), and Management (2 | 1.1%).
Management, Business, Science and Arts Occupations by Sex
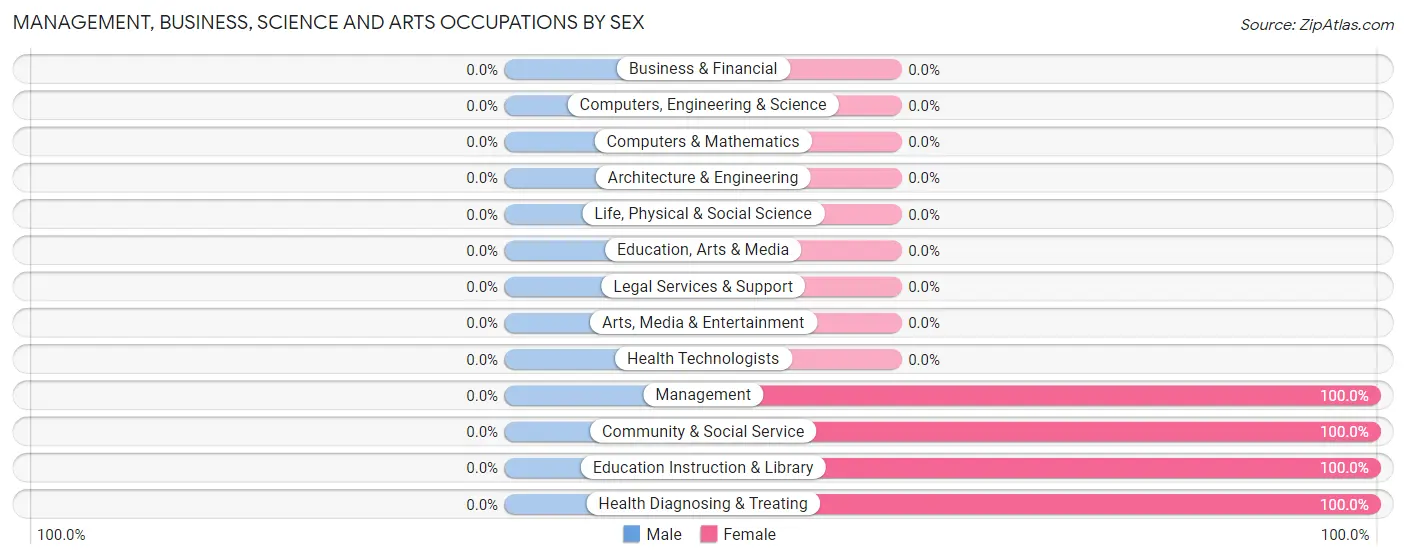
| Occupation | Male | Female |
| Management | 0 (0.0%) | 2 (100.0%) |
| Business & Financial | 0 (0.0%) | 0 (0.0%) |
| Computers, Engineering & Science | 0 (0.0%) | 0 (0.0%) |
| Computers & Mathematics | 0 (0.0%) | 0 (0.0%) |
| Architecture & Engineering | 0 (0.0%) | 0 (0.0%) |
| Life, Physical & Social Science | 0 (0.0%) | 0 (0.0%) |
| Community & Social Service | 0 (0.0%) | 11 (100.0%) |
| Education, Arts & Media | 0 (0.0%) | 0 (0.0%) |
| Legal Services & Support | 0 (0.0%) | 0 (0.0%) |
| Education Instruction & Library | 0 (0.0%) | 11 (100.0%) |
| Arts, Media & Entertainment | 0 (0.0%) | 0 (0.0%) |
| Health Diagnosing & Treating | 0 (0.0%) | 11 (100.0%) |
| Health Technologists | 0 (0.0%) | 0 (0.0%) |
| Total (Category) | 0 (0.0%) | 24 (100.0%) |
| Total (Overall) | 88 (50.0%) | 88 (50.0%) |
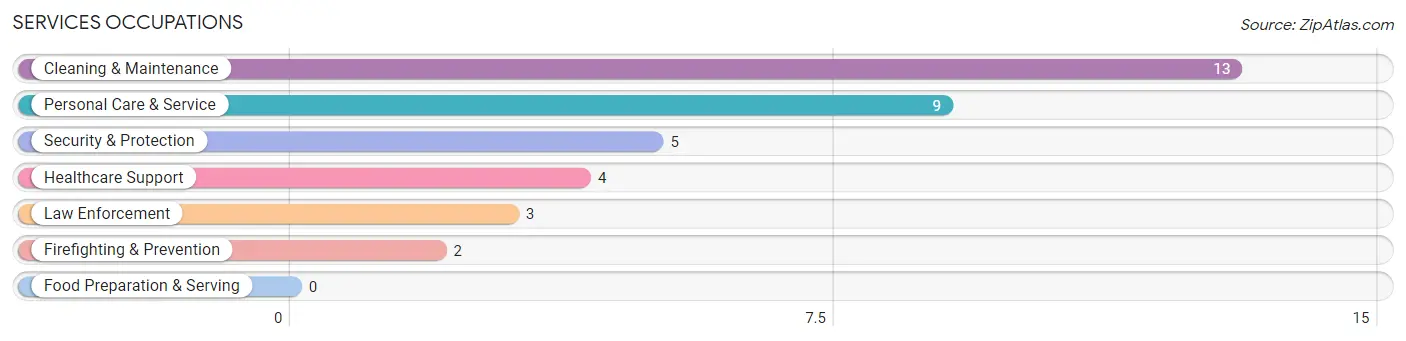
Services Occupations
The most common Services occupations in Huntington are Cleaning & Maintenance (13 | 7.4%), Personal Care & Service (9 | 5.1%), Security & Protection (5 | 2.8%), Healthcare Support (4 | 2.3%), and Law Enforcement (3 | 1.7%).
Services Occupations by Sex
Within the Services occupations in Huntington, the most male-oriented occupations are Security & Protection (100.0%), Firefighting & Prevention (100.0%), and Law Enforcement (100.0%), while the most female-oriented occupations are Healthcare Support (100.0%), Personal Care & Service (100.0%), and Cleaning & Maintenance (46.2%).
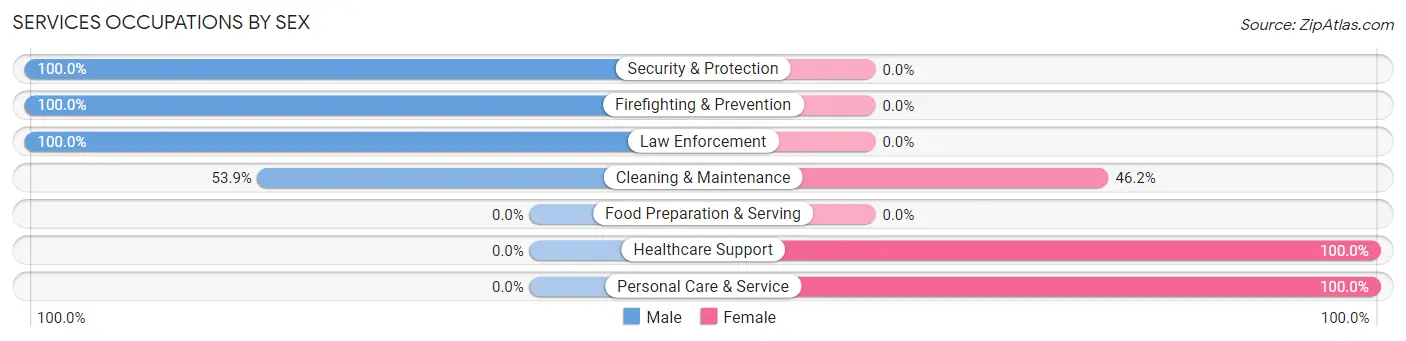
| Occupation | Male | Female |
| Healthcare Support | 0 (0.0%) | 4 (100.0%) |
| Security & Protection | 5 (100.0%) | 0 (0.0%) |
| Firefighting & Prevention | 2 (100.0%) | 0 (0.0%) |
| Law Enforcement | 3 (100.0%) | 0 (0.0%) |
| Food Preparation & Serving | 0 (0.0%) | 0 (0.0%) |
| Cleaning & Maintenance | 7 (53.8%) | 6 (46.2%) |
| Personal Care & Service | 0 (0.0%) | 9 (100.0%) |
| Total (Category) | 12 (38.7%) | 19 (61.3%) |
| Total (Overall) | 88 (50.0%) | 88 (50.0%) |
Sales and Office Occupations
The most common Sales and Office occupations in Huntington are Office & Administration (28 | 15.9%), and Sales & Related (26 | 14.8%).
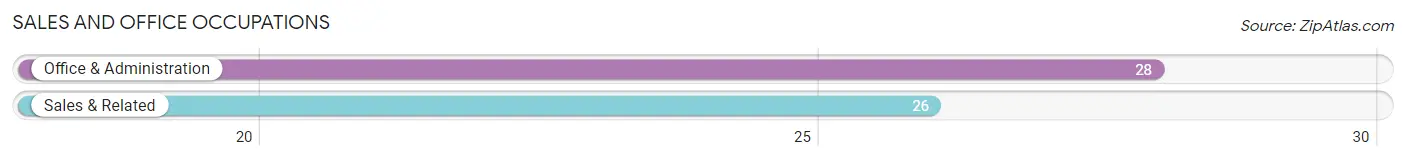
Sales and Office Occupations by Sex
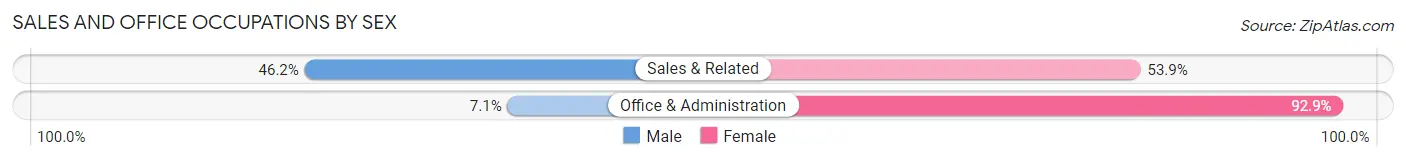
| Occupation | Male | Female |
| Sales & Related | 12 (46.2%) | 14 (53.8%) |
| Office & Administration | 2 (7.1%) | 26 (92.9%) |
| Total (Category) | 14 (25.9%) | 40 (74.1%) |
| Total (Overall) | 88 (50.0%) | 88 (50.0%) |
Natural Resources, Construction and Maintenance Occupations
The most common Natural Resources, Construction and Maintenance occupations in Huntington are Construction & Extraction (14 | 8.0%), and Farming, Fishing & Forestry (2 | 1.1%).
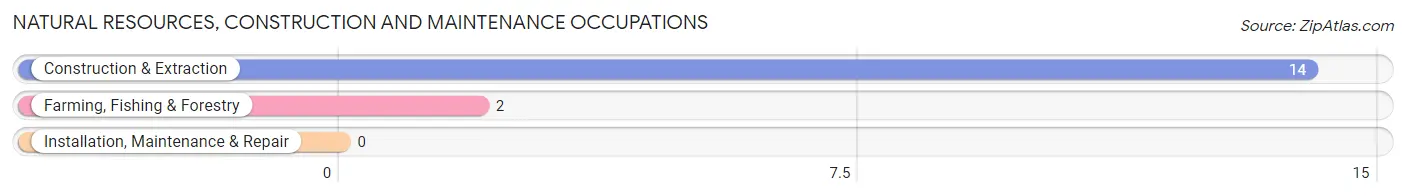
Natural Resources, Construction and Maintenance Occupations by Sex
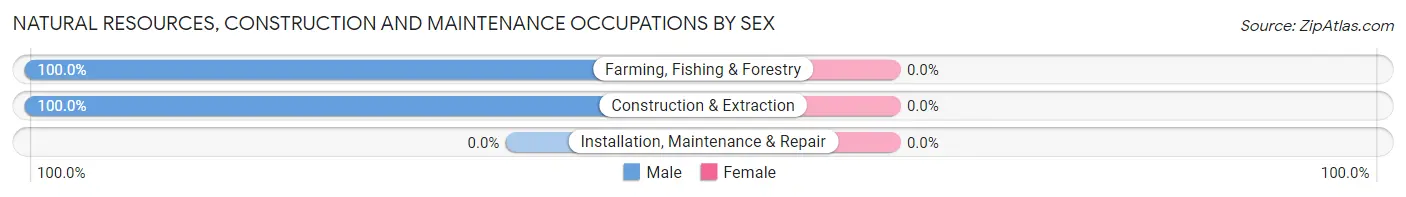
| Occupation | Male | Female |
| Farming, Fishing & Forestry | 2 (100.0%) | 0 (0.0%) |
| Construction & Extraction | 14 (100.0%) | 0 (0.0%) |
| Installation, Maintenance & Repair | 0 (0.0%) | 0 (0.0%) |
| Total (Category) | 16 (100.0%) | 0 (0.0%) |
| Total (Overall) | 88 (50.0%) | 88 (50.0%) |
Production, Transportation and Moving Occupations
The most common Production, Transportation and Moving occupations in Huntington are Production (22 | 12.5%), Material Moving (16 | 9.1%), and Transportation (13 | 7.4%).
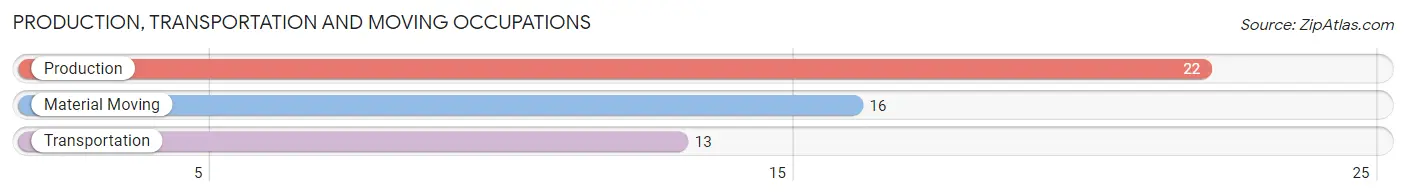
Production, Transportation and Moving Occupations by Sex
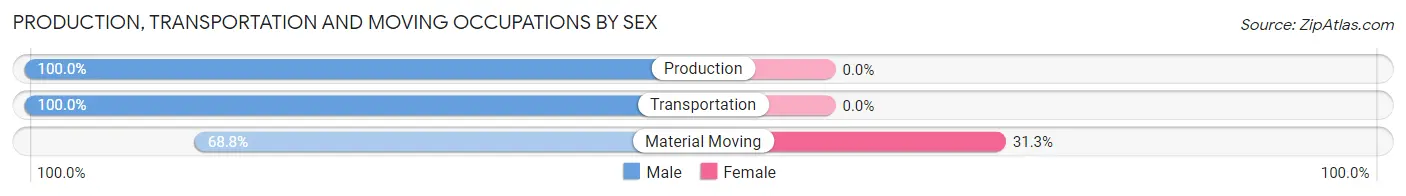
| Occupation | Male | Female |
| Production | 22 (100.0%) | 0 (0.0%) |
| Transportation | 13 (100.0%) | 0 (0.0%) |
| Material Moving | 11 (68.8%) | 5 (31.2%) |
| Total (Category) | 46 (90.2%) | 5 (9.8%) |
| Total (Overall) | 88 (50.0%) | 88 (50.0%) |
Employment Industries by Sex in Huntington
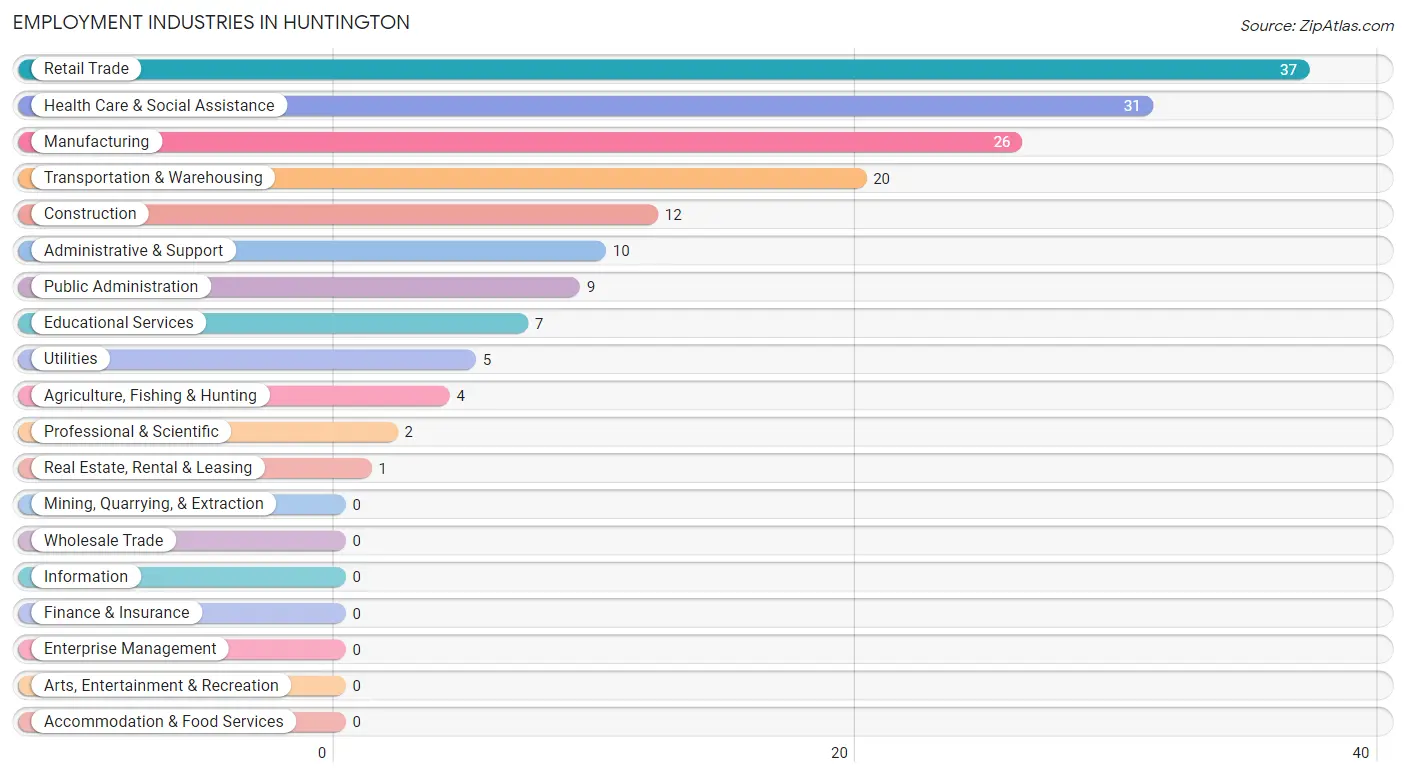
Employment Industries in Huntington
The major employment industries in Huntington include Retail Trade (37 | 21.0%), Health Care & Social Assistance (31 | 17.6%), Manufacturing (26 | 14.8%), Transportation & Warehousing (20 | 11.4%), and Construction (12 | 6.8%).
Employment Industries by Sex in Huntington
The Huntington industries that see more men than women are Agriculture, Fishing & Hunting (100.0%), Construction (100.0%), and Real Estate, Rental & Leasing (100.0%), whereas the industries that tend to have a higher number of women are Utilities (100.0%), Educational Services (100.0%), and Health Care & Social Assistance (100.0%).
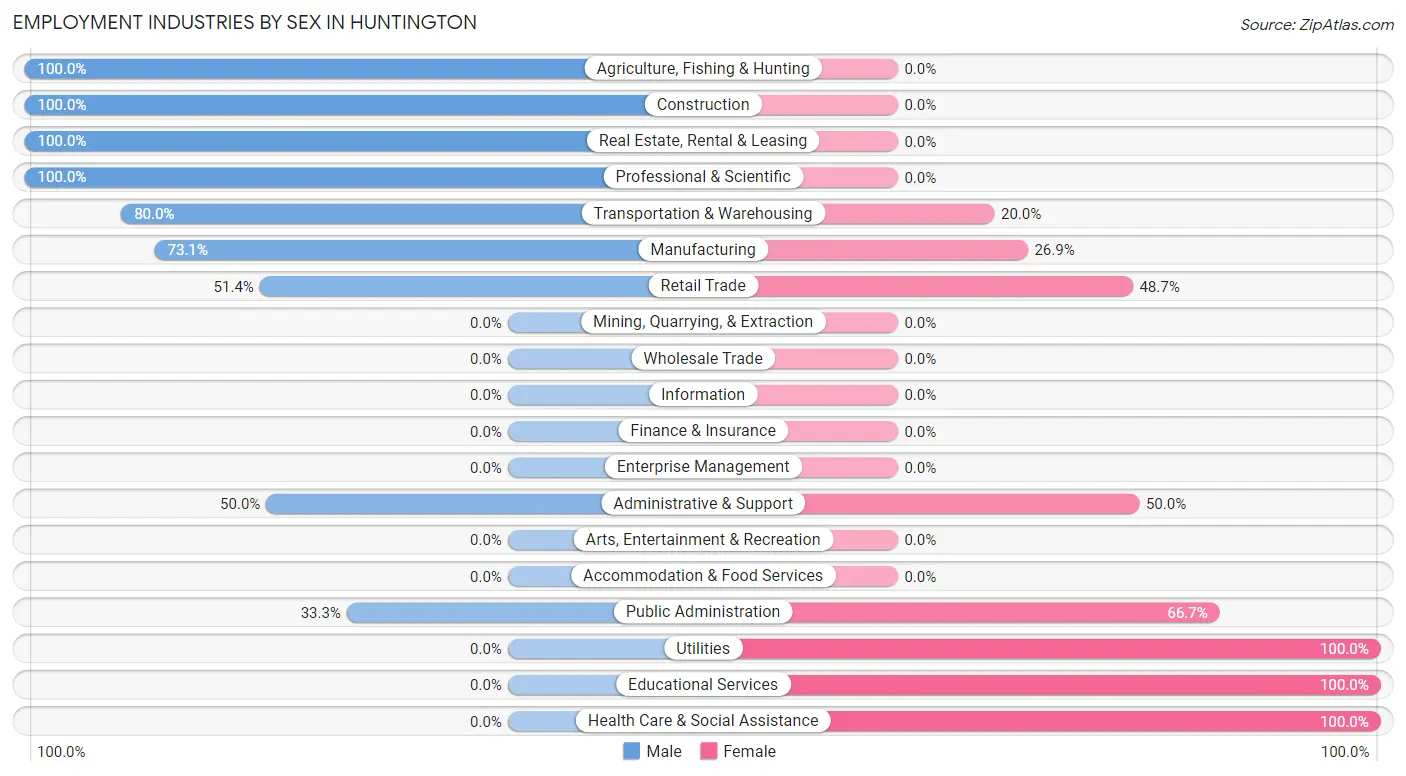
| Industry | Male | Female |
| Agriculture, Fishing & Hunting | 4 (100.0%) | 0 (0.0%) |
| Mining, Quarrying, & Extraction | 0 (0.0%) | 0 (0.0%) |
| Construction | 12 (100.0%) | 0 (0.0%) |
| Manufacturing | 19 (73.1%) | 7 (26.9%) |
| Wholesale Trade | 0 (0.0%) | 0 (0.0%) |
| Retail Trade | 19 (51.3%) | 18 (48.6%) |
| Transportation & Warehousing | 16 (80.0%) | 4 (20.0%) |
| Utilities | 0 (0.0%) | 5 (100.0%) |
| Information | 0 (0.0%) | 0 (0.0%) |
| Finance & Insurance | 0 (0.0%) | 0 (0.0%) |
| Real Estate, Rental & Leasing | 1 (100.0%) | 0 (0.0%) |
| Professional & Scientific | 2 (100.0%) | 0 (0.0%) |
| Enterprise Management | 0 (0.0%) | 0 (0.0%) |
| Administrative & Support | 5 (50.0%) | 5 (50.0%) |
| Educational Services | 0 (0.0%) | 7 (100.0%) |
| Health Care & Social Assistance | 0 (0.0%) | 31 (100.0%) |
| Arts, Entertainment & Recreation | 0 (0.0%) | 0 (0.0%) |
| Accommodation & Food Services | 0 (0.0%) | 0 (0.0%) |
| Public Administration | 3 (33.3%) | 6 (66.7%) |
| Total | 88 (50.0%) | 88 (50.0%) |
Education in Huntington
School Enrollment in Huntington
The most common levels of schooling among the 134 students in Huntington are elementary school (39 | 29.1%), middle school (37 | 27.6%), and high school (25 | 18.7%).
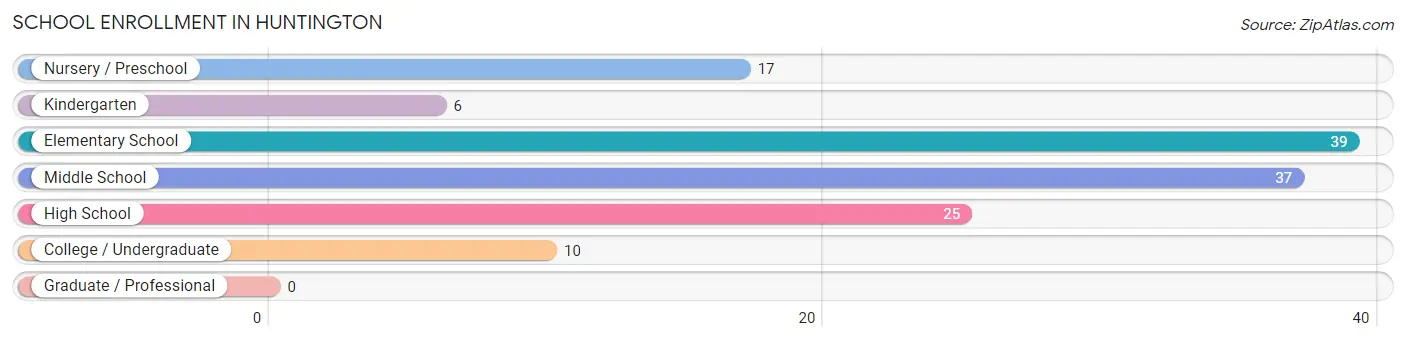
| School Level | # Students | % Students |
| Nursery / Preschool | 17 | 12.7% |
| Kindergarten | 6 | 4.5% |
| Elementary School | 39 | 29.1% |
| Middle School | 37 | 27.6% |
| High School | 25 | 18.7% |
| College / Undergraduate | 10 | 7.5% |
| Graduate / Professional | 0 | 0.0% |
| Total | 134 | 100.0% |
School Enrollment by Age by Funding Source in Huntington
Out of a total of 134 students who are enrolled in schools in Huntington, 23 (17.2%) attend a private institution, while the remaining 111 (82.8%) are enrolled in public schools. The age group of 35 years and over has the highest likelihood of being enrolled in private schools, with 6 (100.0% in the age bracket) enrolled. Conversely, the age group of 15 to 17 year olds has the lowest likelihood of being enrolled in a private school, with 20 (100.0% in the age bracket) attending a public institution.
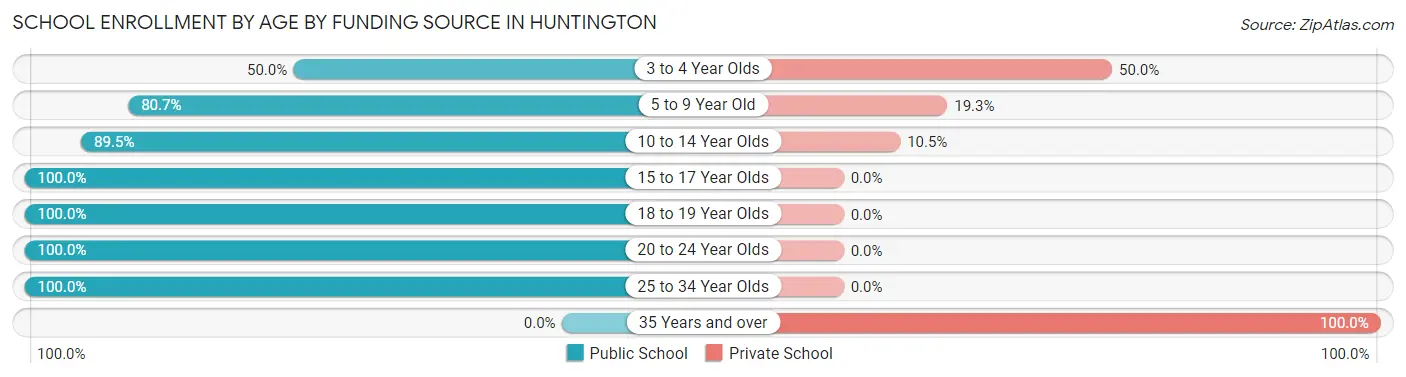
| Age Bracket | Public School | Private School |
| 3 to 4 Year Olds | 2 (50.0%) | 2 (50.0%) |
| 5 to 9 Year Old | 46 (80.7%) | 11 (19.3%) |
| 10 to 14 Year Olds | 34 (89.5%) | 4 (10.5%) |
| 15 to 17 Year Olds | 20 (100.0%) | 0 (0.0%) |
| 18 to 19 Year Olds | 3 (100.0%) | 0 (0.0%) |
| 20 to 24 Year Olds | 1 (100.0%) | 0 (0.0%) |
| 25 to 34 Year Olds | 5 (100.0%) | 0 (0.0%) |
| 35 Years and over | 0 (0.0%) | 6 (100.0%) |
| Total | 111 (82.8%) | 23 (17.2%) |
Educational Attainment by Field of Study in Huntington
Business (13 | 54.2%), liberal arts & history (9 | 37.5%), and bio, nature & agricultural (2 | 8.3%) are the most common fields of study among 24 individuals in Huntington who have obtained a bachelor's degree or higher.
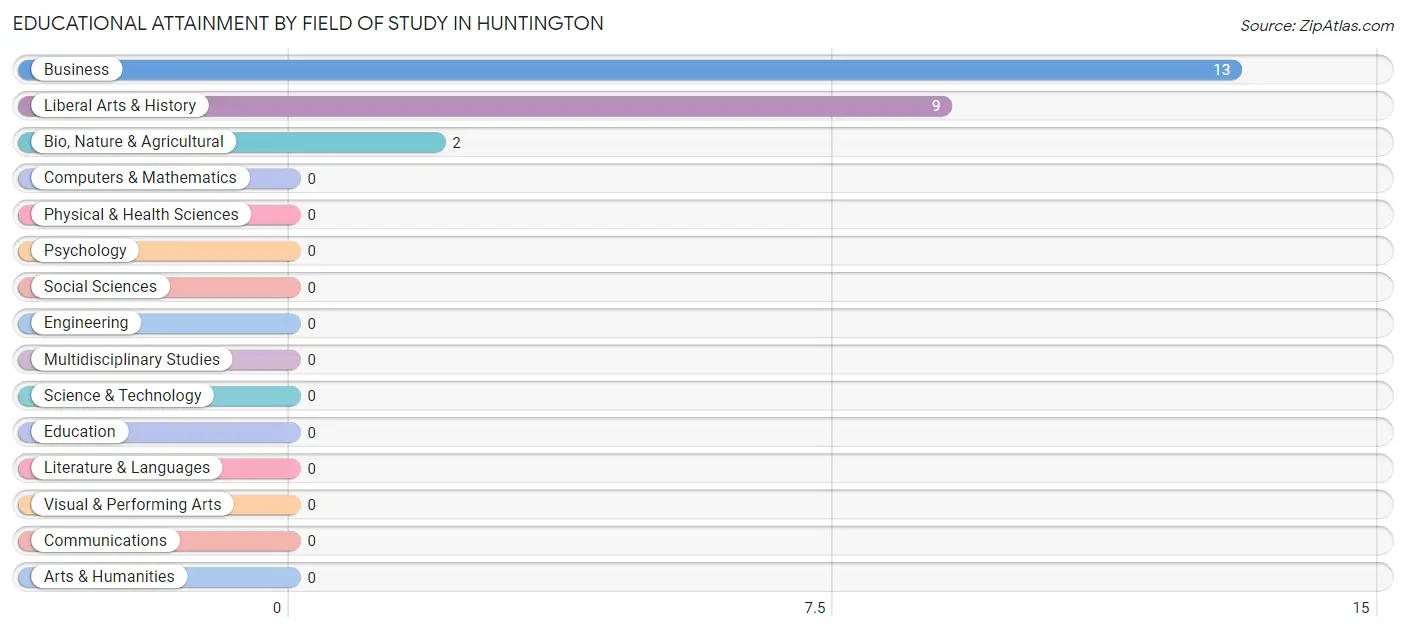
| Field of Study | # Graduates | % Graduates |
| Computers & Mathematics | 0 | 0.0% |
| Bio, Nature & Agricultural | 2 | 8.3% |
| Physical & Health Sciences | 0 | 0.0% |
| Psychology | 0 | 0.0% |
| Social Sciences | 0 | 0.0% |
| Engineering | 0 | 0.0% |
| Multidisciplinary Studies | 0 | 0.0% |
| Science & Technology | 0 | 0.0% |
| Business | 13 | 54.2% |
| Education | 0 | 0.0% |
| Literature & Languages | 0 | 0.0% |
| Liberal Arts & History | 9 | 37.5% |
| Visual & Performing Arts | 0 | 0.0% |
| Communications | 0 | 0.0% |
| Arts & Humanities | 0 | 0.0% |
| Total | 24 | 100.0% |
Transportation & Commute in Huntington
Vehicle Availability by Sex in Huntington
The most prevalent vehicle ownership categories in Huntington are males with 2 vehicles (42, accounting for 48.8%) and females with 2 vehicles (41, making up 50.0%).
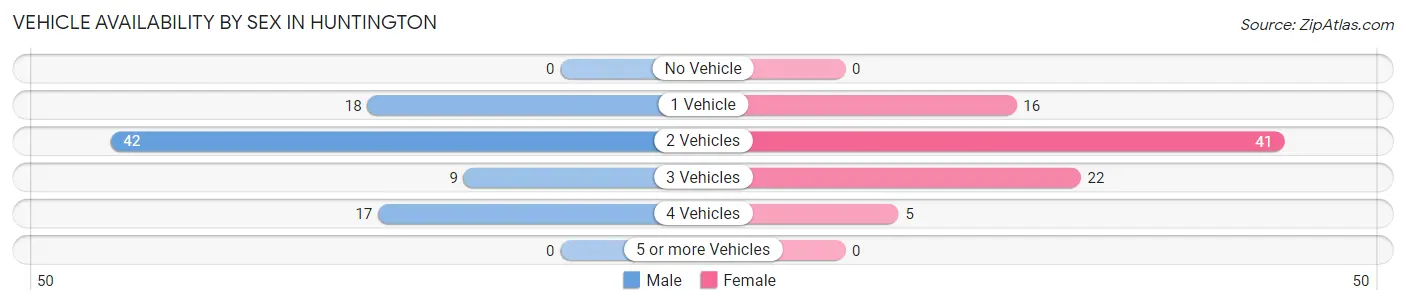
| Vehicles Available | Male | Female |
| No Vehicle | 0 (0.0%) | 0 (0.0%) |
| 1 Vehicle | 18 (20.9%) | 16 (19.1%) |
| 2 Vehicles | 42 (48.8%) | 41 (48.8%) |
| 3 Vehicles | 9 (10.5%) | 22 (26.2%) |
| 4 Vehicles | 17 (19.8%) | 5 (5.9%) |
| 5 or more Vehicles | 0 (0.0%) | 0 (0.0%) |
| Total | 86 (100.0%) | 84 (100.0%) |
Commute Time in Huntington
The most frequently occuring commute durations in Huntington are 30 to 34 minutes (32 commuters, 19.1%), 20 to 24 minutes (29 commuters, 17.3%), and 35 to 39 minutes (27 commuters, 16.1%).
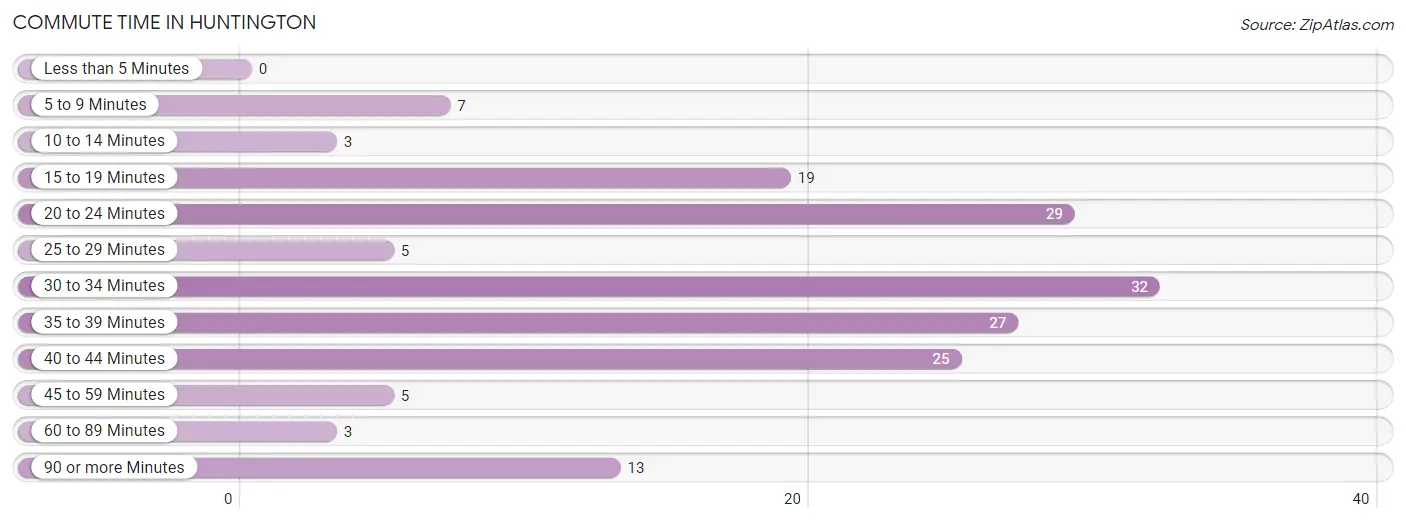
| Commute Time | # Commuters | % Commuters |
| Less than 5 Minutes | 0 | 0.0% |
| 5 to 9 Minutes | 7 | 4.2% |
| 10 to 14 Minutes | 3 | 1.8% |
| 15 to 19 Minutes | 19 | 11.3% |
| 20 to 24 Minutes | 29 | 17.3% |
| 25 to 29 Minutes | 5 | 3.0% |
| 30 to 34 Minutes | 32 | 19.1% |
| 35 to 39 Minutes | 27 | 16.1% |
| 40 to 44 Minutes | 25 | 14.9% |
| 45 to 59 Minutes | 5 | 3.0% |
| 60 to 89 Minutes | 3 | 1.8% |
| 90 or more Minutes | 13 | 7.7% |
Commute Time by Sex in Huntington
The most common commute times in Huntington are 30 to 34 minutes (21 commuters, 25.0%) for males and 20 to 24 minutes (22 commuters, 26.2%) for females.
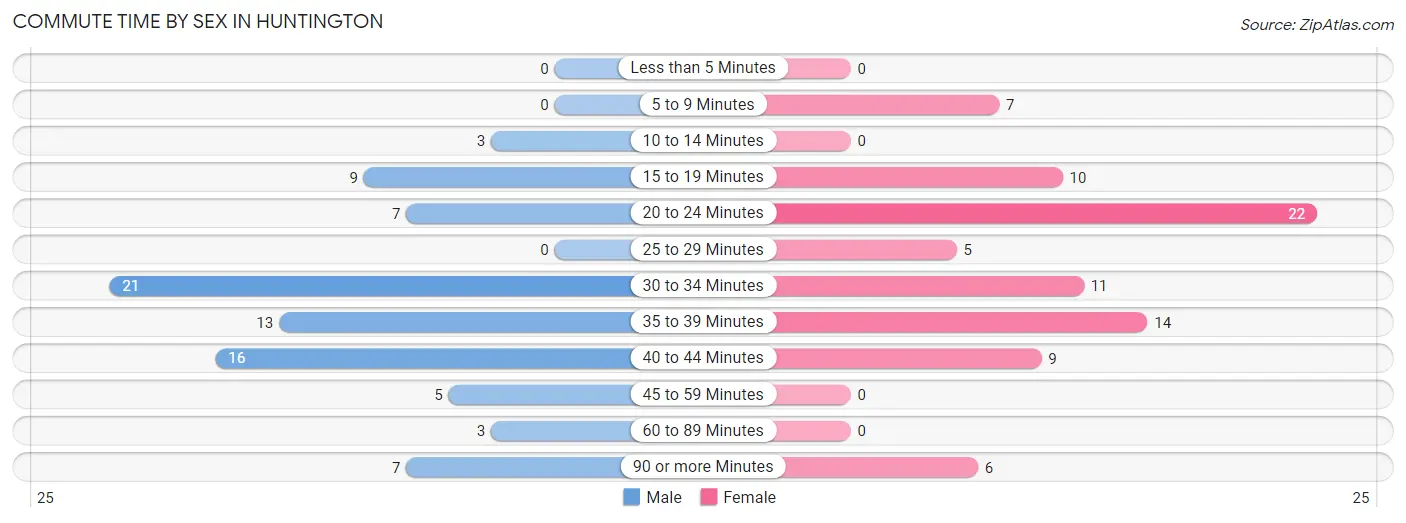
| Commute Time | Male | Female |
| Less than 5 Minutes | 0 (0.0%) | 0 (0.0%) |
| 5 to 9 Minutes | 0 (0.0%) | 7 (8.3%) |
| 10 to 14 Minutes | 3 (3.6%) | 0 (0.0%) |
| 15 to 19 Minutes | 9 (10.7%) | 10 (11.9%) |
| 20 to 24 Minutes | 7 (8.3%) | 22 (26.2%) |
| 25 to 29 Minutes | 0 (0.0%) | 5 (5.9%) |
| 30 to 34 Minutes | 21 (25.0%) | 11 (13.1%) |
| 35 to 39 Minutes | 13 (15.5%) | 14 (16.7%) |
| 40 to 44 Minutes | 16 (19.1%) | 9 (10.7%) |
| 45 to 59 Minutes | 5 (5.9%) | 0 (0.0%) |
| 60 to 89 Minutes | 3 (3.6%) | 0 (0.0%) |
| 90 or more Minutes | 7 (8.3%) | 6 (7.1%) |
Time of Departure to Work by Sex in Huntington
The most frequent times of departure to work in Huntington are 4:00 PM to 11:59 PM (15, 17.9%) for males and 4:00 PM to 11:59 PM (25, 29.8%) for females.
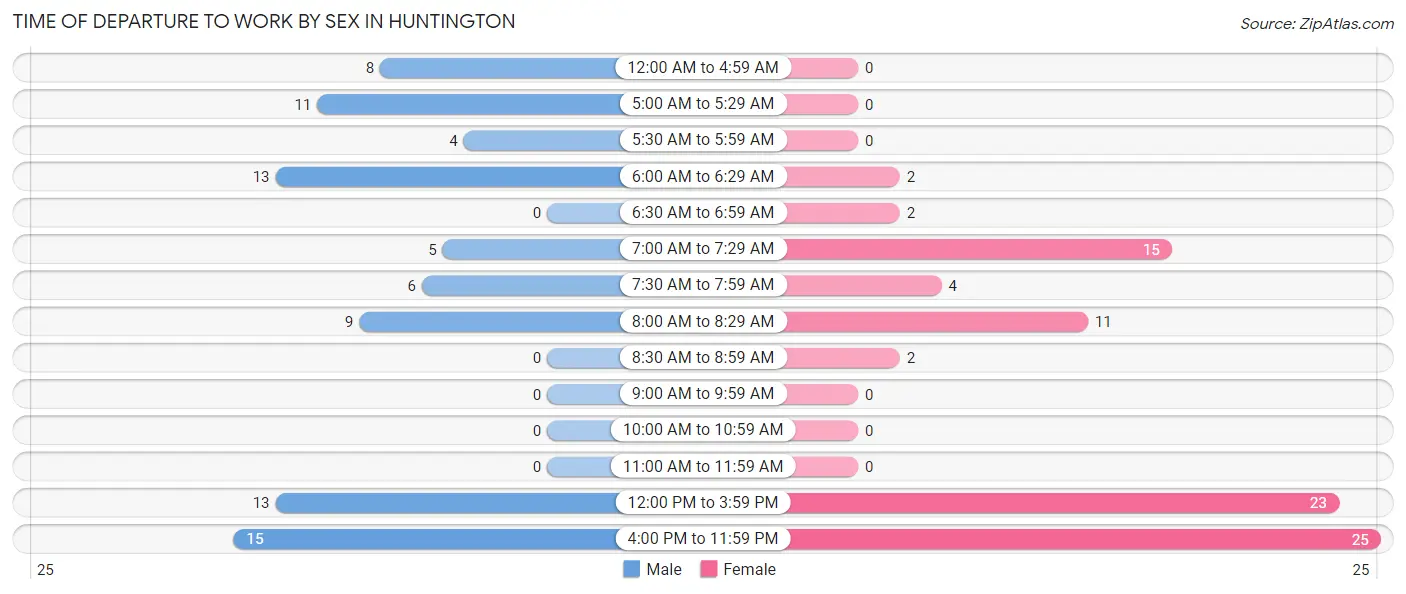
| Time of Departure | Male | Female |
| 12:00 AM to 4:59 AM | 8 (9.5%) | 0 (0.0%) |
| 5:00 AM to 5:29 AM | 11 (13.1%) | 0 (0.0%) |
| 5:30 AM to 5:59 AM | 4 (4.8%) | 0 (0.0%) |
| 6:00 AM to 6:29 AM | 13 (15.5%) | 2 (2.4%) |
| 6:30 AM to 6:59 AM | 0 (0.0%) | 2 (2.4%) |
| 7:00 AM to 7:29 AM | 5 (5.9%) | 15 (17.9%) |
| 7:30 AM to 7:59 AM | 6 (7.1%) | 4 (4.8%) |
| 8:00 AM to 8:29 AM | 9 (10.7%) | 11 (13.1%) |
| 8:30 AM to 8:59 AM | 0 (0.0%) | 2 (2.4%) |
| 9:00 AM to 9:59 AM | 0 (0.0%) | 0 (0.0%) |
| 10:00 AM to 10:59 AM | 0 (0.0%) | 0 (0.0%) |
| 11:00 AM to 11:59 AM | 0 (0.0%) | 0 (0.0%) |
| 12:00 PM to 3:59 PM | 13 (15.5%) | 23 (27.4%) |
| 4:00 PM to 11:59 PM | 15 (17.9%) | 25 (29.8%) |
| Total | 84 (100.0%) | 84 (100.0%) |
Housing Occupancy in Huntington
Occupancy by Ownership in Huntington
Of the total 176 dwellings in Huntington, owner-occupied units account for 112 (63.6%), while renter-occupied units make up 64 (36.4%).
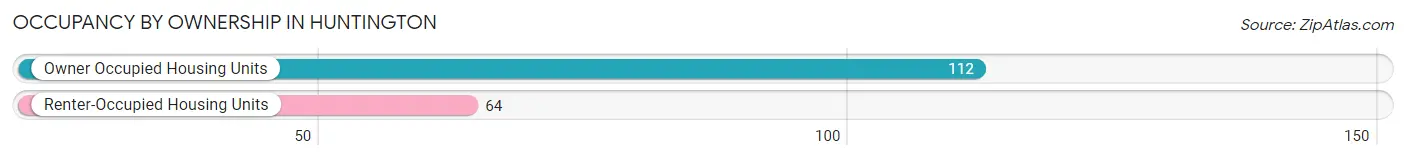
| Occupancy | # Housing Units | % Housing Units |
| Owner Occupied Housing Units | 112 | 63.6% |
| Renter-Occupied Housing Units | 64 | 36.4% |
| Total Occupied Housing Units | 176 | 100.0% |
Occupancy by Household Size in Huntington
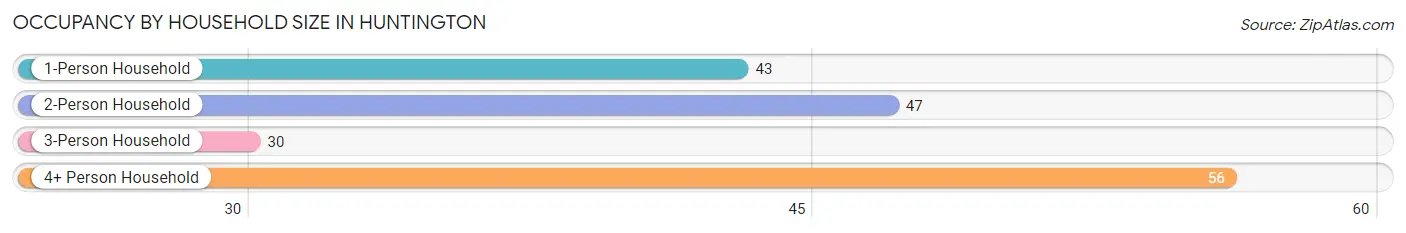
| Household Size | # Housing Units | % Housing Units |
| 1-Person Household | 43 | 24.4% |
| 2-Person Household | 47 | 26.7% |
| 3-Person Household | 30 | 17.1% |
| 4+ Person Household | 56 | 31.8% |
| Total Housing Units | 176 | 100.0% |
Occupancy by Ownership by Household Size in Huntington
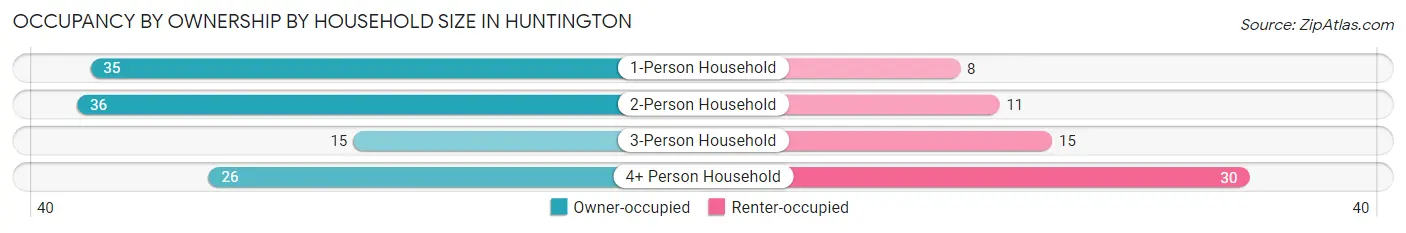
| Household Size | Owner-occupied | Renter-occupied |
| 1-Person Household | 35 (81.4%) | 8 (18.6%) |
| 2-Person Household | 36 (76.6%) | 11 (23.4%) |
| 3-Person Household | 15 (50.0%) | 15 (50.0%) |
| 4+ Person Household | 26 (46.4%) | 30 (53.6%) |
| Total Housing Units | 112 (63.6%) | 64 (36.4%) |
Occupancy by Educational Attainment in Huntington
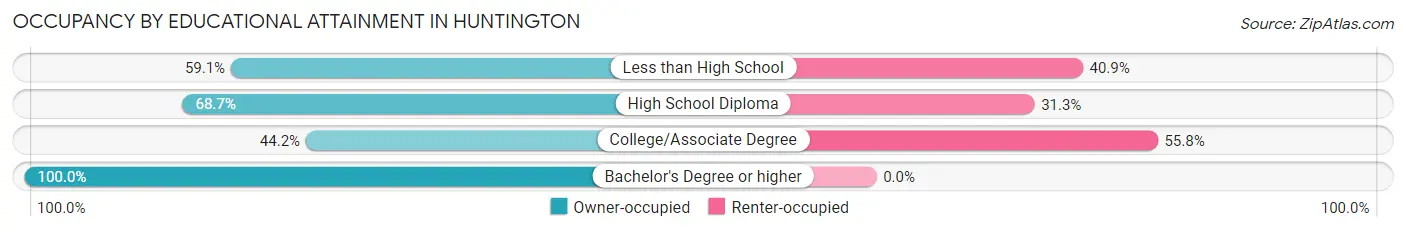
| Household Size | Owner-occupied | Renter-occupied |
| Less than High School | 13 (59.1%) | 9 (40.9%) |
| High School Diploma | 57 (68.7%) | 26 (31.3%) |
| College/Associate Degree | 23 (44.2%) | 29 (55.8%) |
| Bachelor's Degree or higher | 19 (100.0%) | 0 (0.0%) |
Occupancy by Age of Householder in Huntington
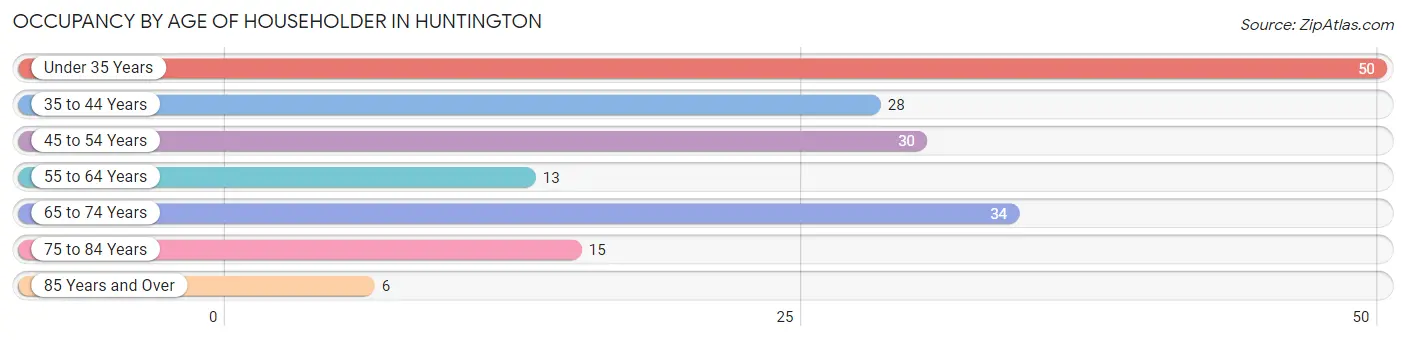
| Age Bracket | # Households | % Households |
| Under 35 Years | 50 | 28.4% |
| 35 to 44 Years | 28 | 15.9% |
| 45 to 54 Years | 30 | 17.1% |
| 55 to 64 Years | 13 | 7.4% |
| 65 to 74 Years | 34 | 19.3% |
| 75 to 84 Years | 15 | 8.5% |
| 85 Years and Over | 6 | 3.4% |
| Total | 176 | 100.0% |
Housing Finances in Huntington
Median Income by Occupancy in Huntington
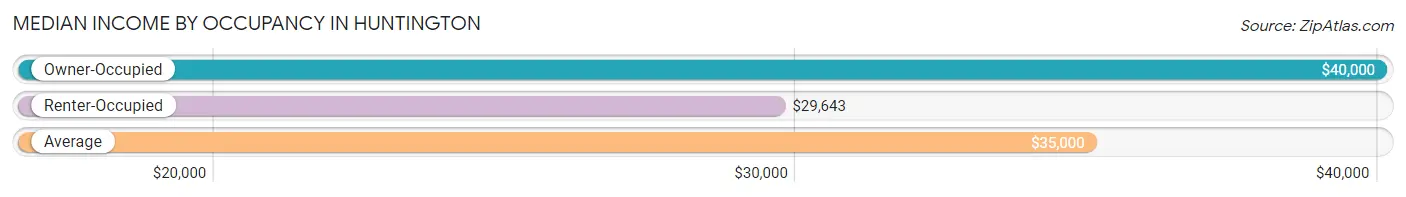
| Occupancy Type | # Households | Median Income |
| Owner-Occupied | 112 (63.6%) | $40,000 |
| Renter-Occupied | 64 (36.4%) | $29,643 |
| Average | 176 (100.0%) | $35,000 |
Occupancy by Householder Income Bracket in Huntington
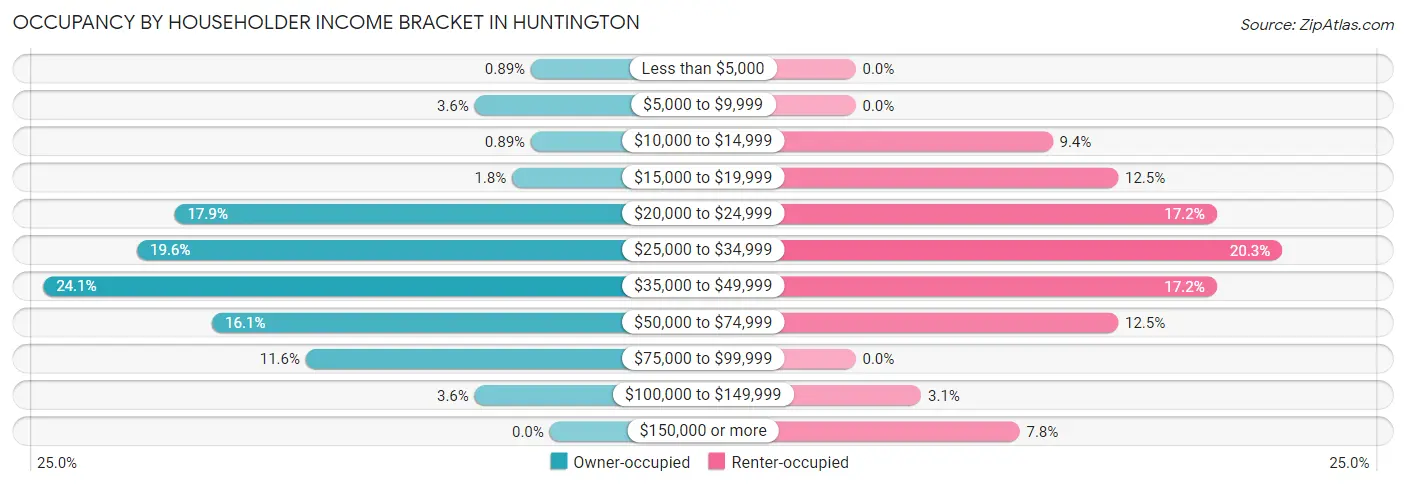
| Income Bracket | Owner-occupied | Renter-occupied |
| Less than $5,000 | 1 (0.9%) | 0 (0.0%) |
| $5,000 to $9,999 | 4 (3.6%) | 0 (0.0%) |
| $10,000 to $14,999 | 1 (0.9%) | 6 (9.4%) |
| $15,000 to $19,999 | 2 (1.8%) | 8 (12.5%) |
| $20,000 to $24,999 | 20 (17.9%) | 11 (17.2%) |
| $25,000 to $34,999 | 22 (19.6%) | 13 (20.3%) |
| $35,000 to $49,999 | 27 (24.1%) | 11 (17.2%) |
| $50,000 to $74,999 | 18 (16.1%) | 8 (12.5%) |
| $75,000 to $99,999 | 13 (11.6%) | 0 (0.0%) |
| $100,000 to $149,999 | 4 (3.6%) | 2 (3.1%) |
| $150,000 or more | 0 (0.0%) | 5 (7.8%) |
| Total | 112 (100.0%) | 64 (100.0%) |
Monthly Housing Cost Tiers in Huntington
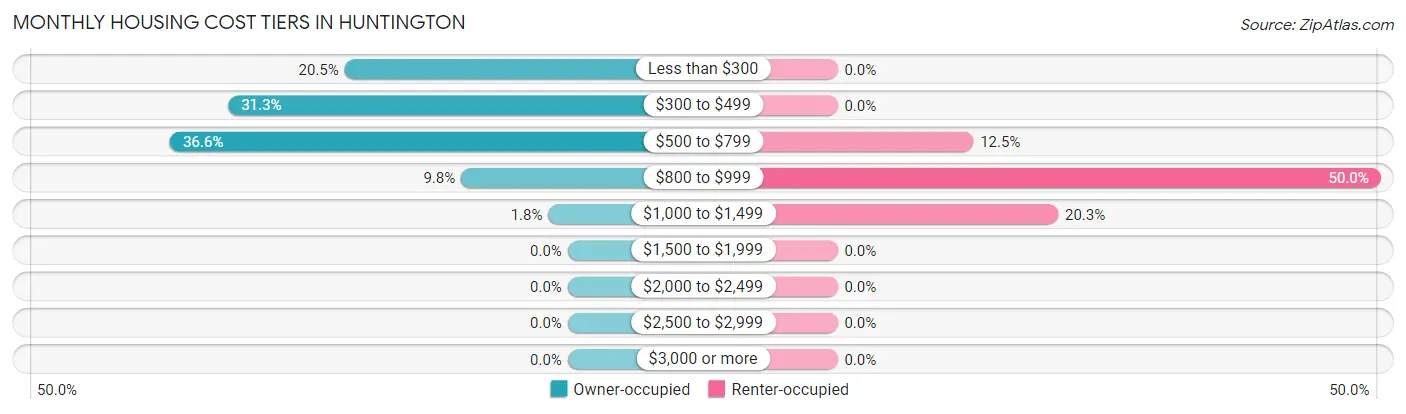
| Monthly Cost | Owner-occupied | Renter-occupied |
| Less than $300 | 23 (20.5%) | 0 (0.0%) |
| $300 to $499 | 35 (31.2%) | 0 (0.0%) |
| $500 to $799 | 41 (36.6%) | 8 (12.5%) |
| $800 to $999 | 11 (9.8%) | 32 (50.0%) |
| $1,000 to $1,499 | 2 (1.8%) | 13 (20.3%) |
| $1,500 to $1,999 | 0 (0.0%) | 0 (0.0%) |
| $2,000 to $2,499 | 0 (0.0%) | 0 (0.0%) |
| $2,500 to $2,999 | 0 (0.0%) | 0 (0.0%) |
| $3,000 or more | 0 (0.0%) | 0 (0.0%) |
| Total | 112 (100.0%) | 64 (100.0%) |
Physical Housing Characteristics in Huntington
Housing Structures in Huntington
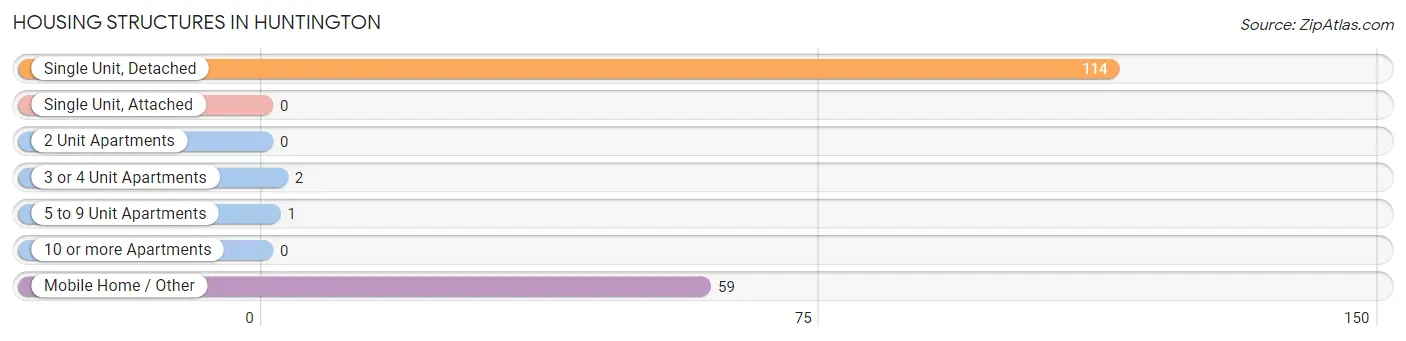
| Structure Type | # Housing Units | % Housing Units |
| Single Unit, Detached | 114 | 64.8% |
| Single Unit, Attached | 0 | 0.0% |
| 2 Unit Apartments | 0 | 0.0% |
| 3 or 4 Unit Apartments | 2 | 1.1% |
| 5 to 9 Unit Apartments | 1 | 0.6% |
| 10 or more Apartments | 0 | 0.0% |
| Mobile Home / Other | 59 | 33.5% |
| Total | 176 | 100.0% |
Housing Structures by Occupancy in Huntington
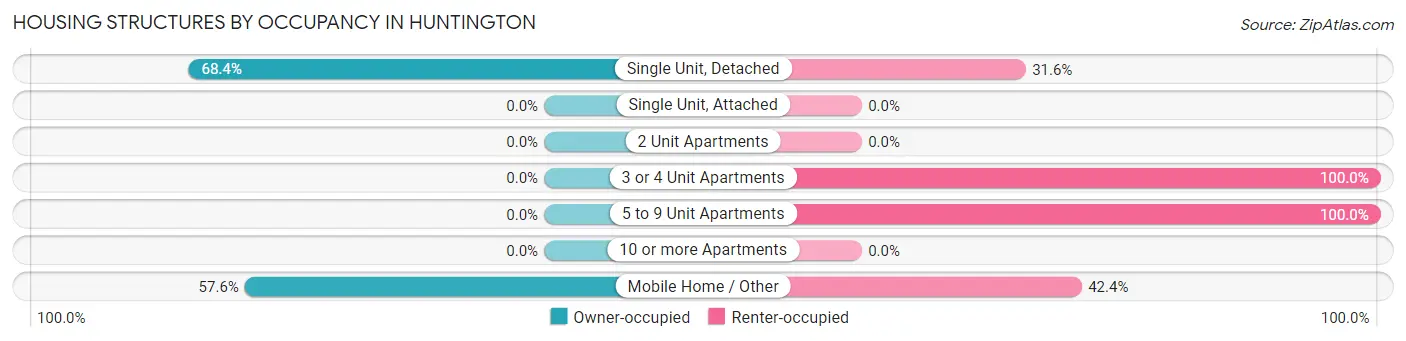
| Structure Type | Owner-occupied | Renter-occupied |
| Single Unit, Detached | 78 (68.4%) | 36 (31.6%) |
| Single Unit, Attached | 0 (0.0%) | 0 (0.0%) |
| 2 Unit Apartments | 0 (0.0%) | 0 (0.0%) |
| 3 or 4 Unit Apartments | 0 (0.0%) | 2 (100.0%) |
| 5 to 9 Unit Apartments | 0 (0.0%) | 1 (100.0%) |
| 10 or more Apartments | 0 (0.0%) | 0 (0.0%) |
| Mobile Home / Other | 34 (57.6%) | 25 (42.4%) |
| Total | 112 (63.6%) | 64 (36.4%) |
Housing Structures by Number of Rooms in Huntington
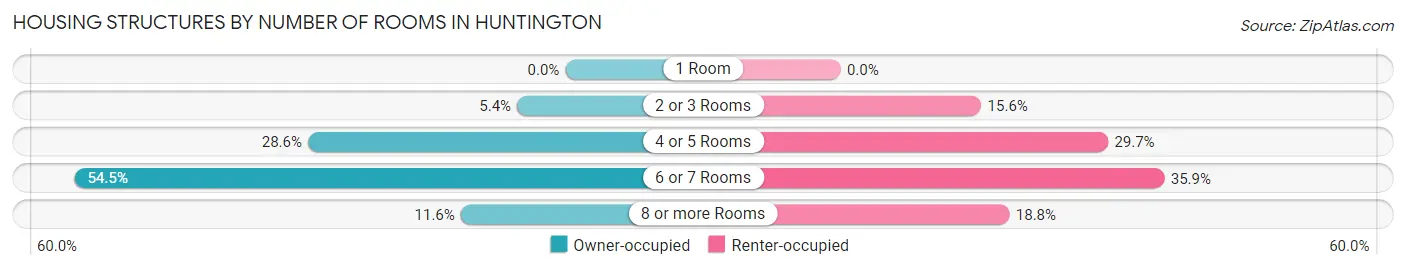
| Number of Rooms | Owner-occupied | Renter-occupied |
| 1 Room | 0 (0.0%) | 0 (0.0%) |
| 2 or 3 Rooms | 6 (5.4%) | 10 (15.6%) |
| 4 or 5 Rooms | 32 (28.6%) | 19 (29.7%) |
| 6 or 7 Rooms | 61 (54.5%) | 23 (35.9%) |
| 8 or more Rooms | 13 (11.6%) | 12 (18.8%) |
| Total | 112 (100.0%) | 64 (100.0%) |
Housing Structure by Heating Type in Huntington
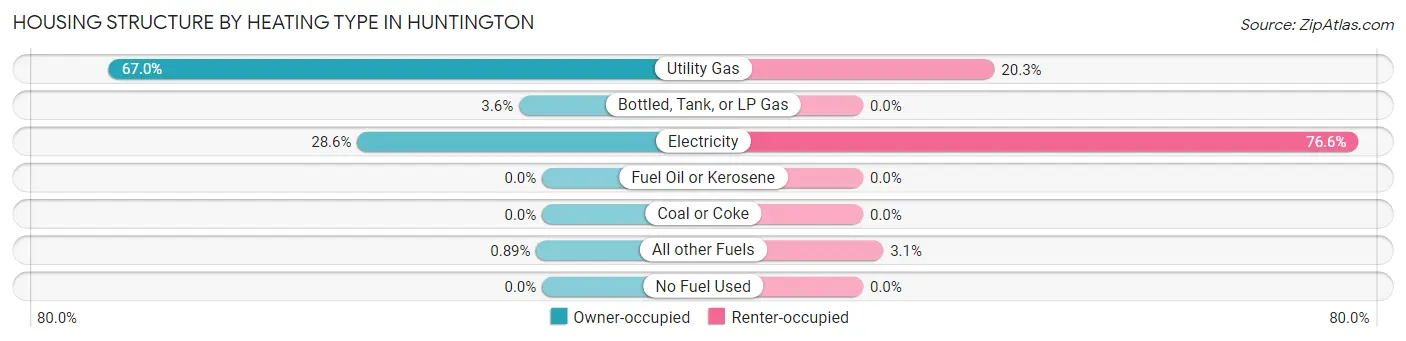
| Heating Type | Owner-occupied | Renter-occupied |
| Utility Gas | 75 (67.0%) | 13 (20.3%) |
| Bottled, Tank, or LP Gas | 4 (3.6%) | 0 (0.0%) |
| Electricity | 32 (28.6%) | 49 (76.6%) |
| Fuel Oil or Kerosene | 0 (0.0%) | 0 (0.0%) |
| Coal or Coke | 0 (0.0%) | 0 (0.0%) |
| All other Fuels | 1 (0.9%) | 2 (3.1%) |
| No Fuel Used | 0 (0.0%) | 0 (0.0%) |
| Total | 112 (100.0%) | 64 (100.0%) |
Household Vehicle Usage in Huntington
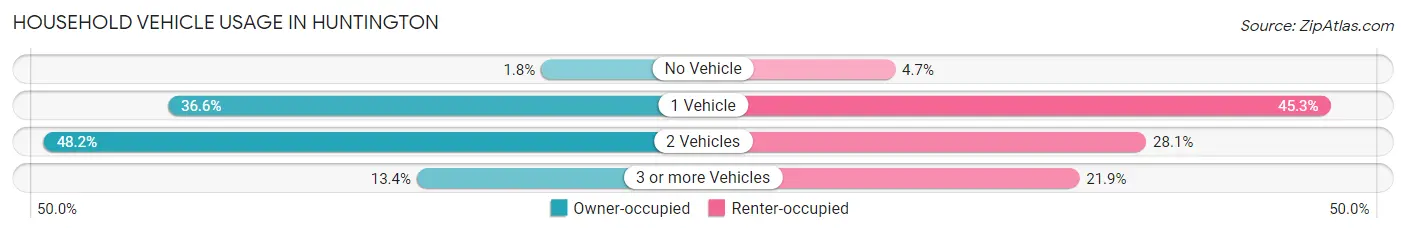
| Vehicles per Household | Owner-occupied | Renter-occupied |
| No Vehicle | 2 (1.8%) | 3 (4.7%) |
| 1 Vehicle | 41 (36.6%) | 29 (45.3%) |
| 2 Vehicles | 54 (48.2%) | 18 (28.1%) |
| 3 or more Vehicles | 15 (13.4%) | 14 (21.9%) |
| Total | 112 (100.0%) | 64 (100.0%) |
Real Estate & Mortgages in Huntington
Real Estate and Mortgage Overview in Huntington
| Characteristic | Without Mortgage | With Mortgage |
| Housing Units | 72 | 40 |
| Median Property Value | $31,500 | $80,000 |
| Median Household Income | $45,455 | $0 |
| Monthly Housing Costs | $363 | $0 |
| Real Estate Taxes | - | - |
Property Value by Mortgage Status in Huntington
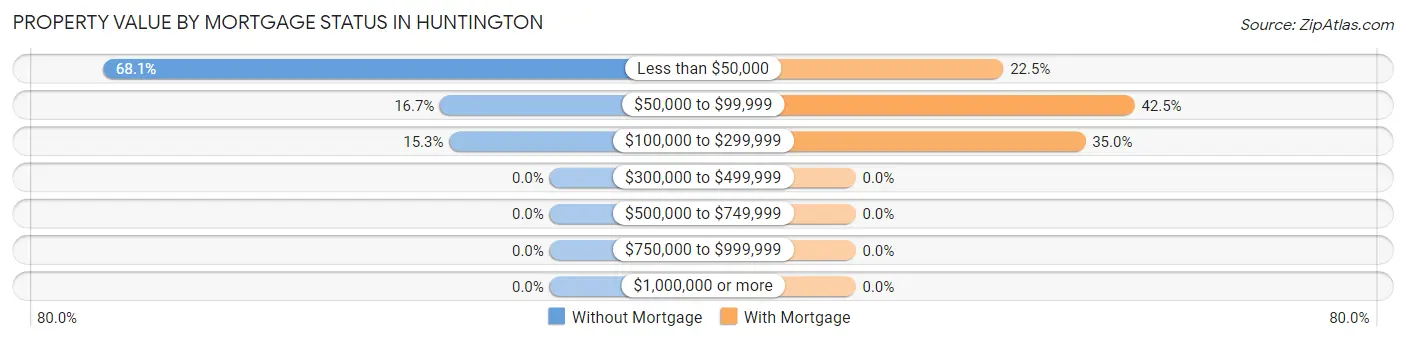
| Property Value | Without Mortgage | With Mortgage |
| Less than $50,000 | 49 (68.1%) | 9 (22.5%) |
| $50,000 to $99,999 | 12 (16.7%) | 17 (42.5%) |
| $100,000 to $299,999 | 11 (15.3%) | 14 (35.0%) |
| $300,000 to $499,999 | 0 (0.0%) | 0 (0.0%) |
| $500,000 to $749,999 | 0 (0.0%) | 0 (0.0%) |
| $750,000 to $999,999 | 0 (0.0%) | 0 (0.0%) |
| $1,000,000 or more | 0 (0.0%) | 0 (0.0%) |
| Total | 72 (100.0%) | 40 (100.0%) |
Household Income by Mortgage Status in Huntington
| Household Income | Without Mortgage | With Mortgage |
| Less than $10,000 | 5 (6.9%) | 0 (0.0%) |
| $10,000 to $24,999 | 15 (20.8%) | 0 (0.0%) |
| $25,000 to $34,999 | 7 (9.7%) | 8 (20.0%) |
| $35,000 to $49,999 | 18 (25.0%) | 15 (37.5%) |
| $50,000 to $74,999 | 12 (16.7%) | 9 (22.5%) |
| $75,000 to $99,999 | 13 (18.1%) | 6 (15.0%) |
| $100,000 to $149,999 | 2 (2.8%) | 0 (0.0%) |
| $150,000 or more | 0 (0.0%) | 2 (5.0%) |
| Total | 72 (100.0%) | 40 (100.0%) |
Property Value to Household Income Ratio in Huntington
| Value-to-Income Ratio | Without Mortgage | With Mortgage |
| Less than 2.0x | 57 (79.2%) | 32,143 (80,357.5%) |
| 2.0x to 2.9x | 6 (8.3%) | 18 (45.0%) |
| 3.0x to 3.9x | 0 (0.0%) | 10 (25.0%) |
| 4.0x or more | 9 (12.5%) | 0 (0.0%) |
| Total | 72 (100.0%) | 40 (100.0%) |
Real Estate Taxes by Mortgage Status in Huntington
| Property Taxes | Without Mortgage | With Mortgage |
| Less than $800 | 55 (76.4%) | 0 (0.0%) |
| $800 to $1,499 | 7 (9.7%) | 37 (92.5%) |
| $800 to $1,499 | 0 (0.0%) | 2 (5.0%) |
| Total | 72 (100.0%) | 40 (100.0%) |
Health & Disability in Huntington
Health Insurance Coverage by Age in Huntington
| Age Bracket | With Coverage | Without Coverage |
| Under 6 Years | 60 (100.0%) | 0 (0.0%) |
| 6 to 18 Years | 97 (94.2%) | 6 (5.8%) |
| 19 to 25 Years | 27 (90.0%) | 3 (10.0%) |
| 26 to 34 Years | 47 (66.2%) | 24 (33.8%) |
| 35 to 44 Years | 46 (70.8%) | 19 (29.2%) |
| 45 to 54 Years | 46 (82.1%) | 10 (17.9%) |
| 55 to 64 Years | 32 (88.9%) | 4 (11.1%) |
| 65 to 74 Years | 40 (100.0%) | 0 (0.0%) |
| 75 Years and older | 29 (100.0%) | 0 (0.0%) |
| Total | 424 (86.5%) | 66 (13.5%) |
Health Insurance Coverage by Citizenship Status in Huntington
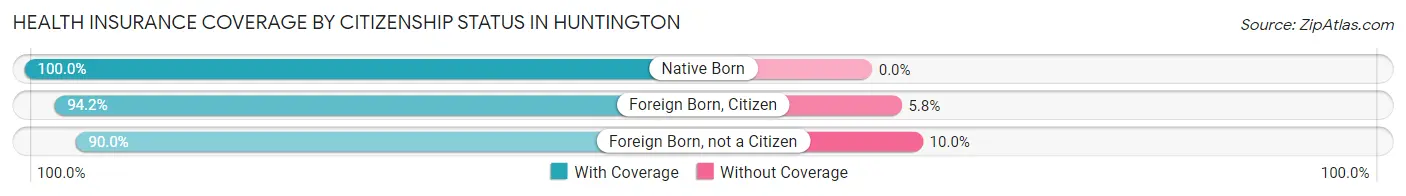
| Citizenship Status | With Coverage | Without Coverage |
| Native Born | 60 (100.0%) | 0 (0.0%) |
| Foreign Born, Citizen | 97 (94.2%) | 6 (5.8%) |
| Foreign Born, not a Citizen | 27 (90.0%) | 3 (10.0%) |
Health Insurance Coverage by Household Income in Huntington
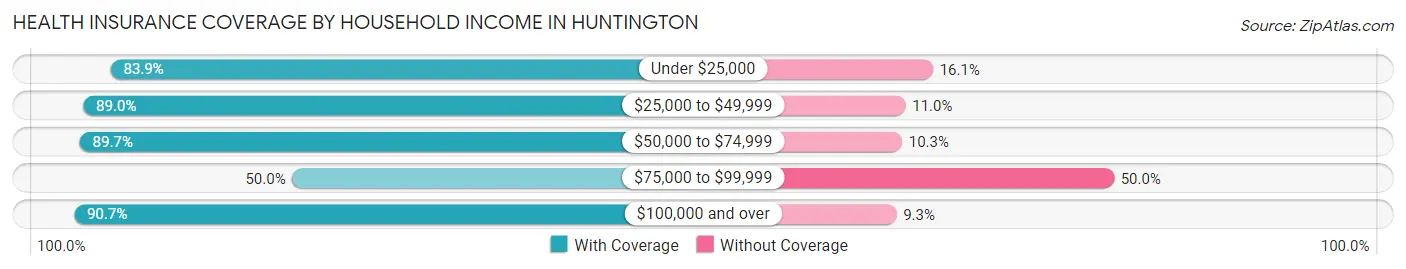
| Household Income | With Coverage | Without Coverage |
| Under $25,000 | 73 (83.9%) | 14 (16.1%) |
| $25,000 to $49,999 | 203 (89.0%) | 25 (11.0%) |
| $50,000 to $74,999 | 87 (89.7%) | 10 (10.3%) |
| $75,000 to $99,999 | 12 (50.0%) | 12 (50.0%) |
| $100,000 and over | 49 (90.7%) | 5 (9.3%) |
Public vs Private Health Insurance Coverage by Age in Huntington
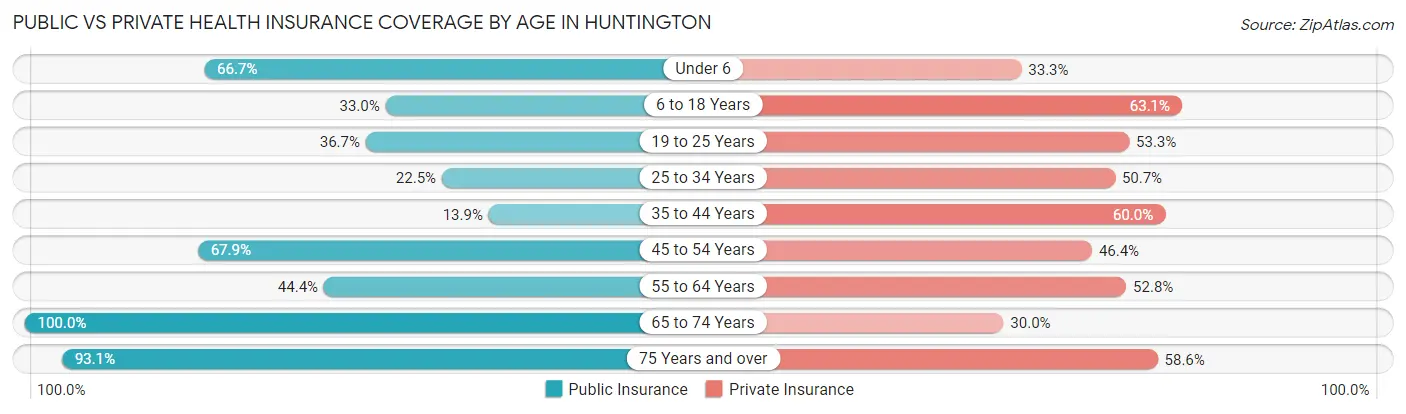
| Age Bracket | Public Insurance | Private Insurance |
| Under 6 | 40 (66.7%) | 20 (33.3%) |
| 6 to 18 Years | 34 (33.0%) | 65 (63.1%) |
| 19 to 25 Years | 11 (36.7%) | 16 (53.3%) |
| 25 to 34 Years | 16 (22.5%) | 36 (50.7%) |
| 35 to 44 Years | 9 (13.9%) | 39 (60.0%) |
| 45 to 54 Years | 38 (67.9%) | 26 (46.4%) |
| 55 to 64 Years | 16 (44.4%) | 19 (52.8%) |
| 65 to 74 Years | 40 (100.0%) | 12 (30.0%) |
| 75 Years and over | 27 (93.1%) | 17 (58.6%) |
| Total | 231 (47.1%) | 250 (51.0%) |
Disability Status by Sex by Age in Huntington
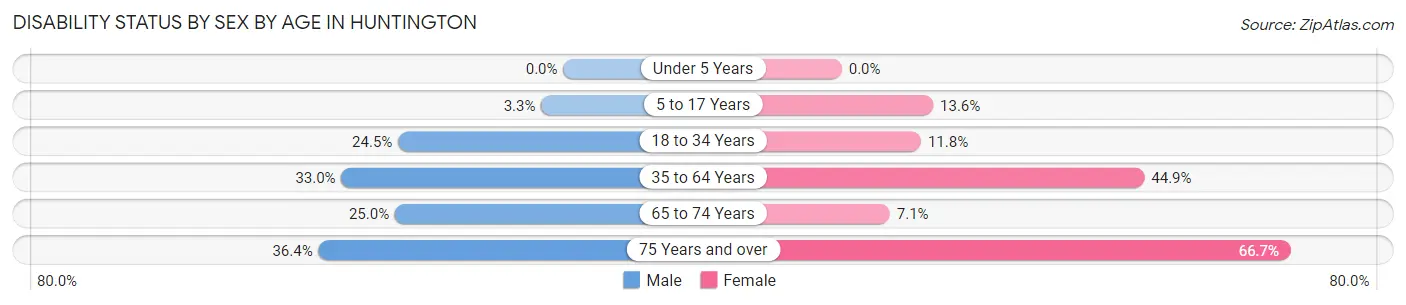
| Age Bracket | Male | Female |
| Under 5 Years | 0 (0.0%) | 0 (0.0%) |
| 5 to 17 Years | 2 (3.3%) | 8 (13.6%) |
| 18 to 34 Years | 13 (24.5%) | 6 (11.8%) |
| 35 to 64 Years | 29 (33.0%) | 31 (44.9%) |
| 65 to 74 Years | 3 (25.0%) | 2 (7.1%) |
| 75 Years and over | 4 (36.4%) | 12 (66.7%) |
Disability Class by Sex by Age in Huntington
Disability Class: Hearing Difficulty
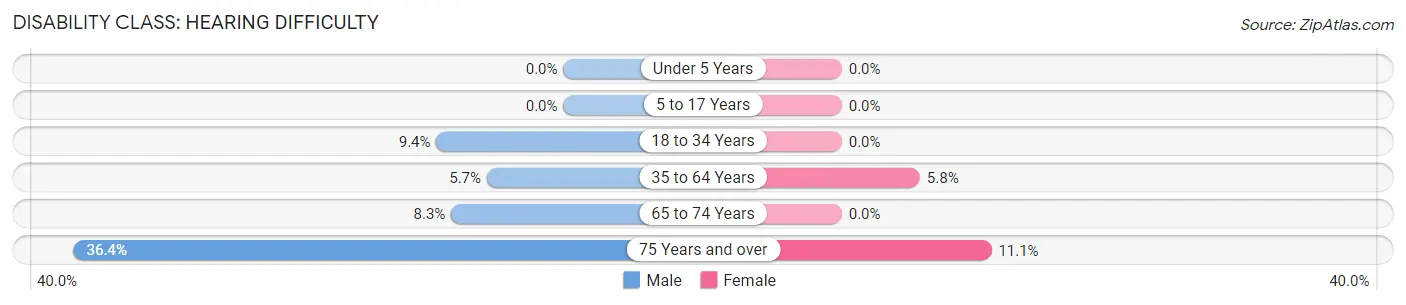
| Age Bracket | Male | Female |
| Under 5 Years | 0 (0.0%) | 0 (0.0%) |
| 5 to 17 Years | 0 (0.0%) | 0 (0.0%) |
| 18 to 34 Years | 5 (9.4%) | 0 (0.0%) |
| 35 to 64 Years | 5 (5.7%) | 4 (5.8%) |
| 65 to 74 Years | 1 (8.3%) | 0 (0.0%) |
| 75 Years and over | 4 (36.4%) | 2 (11.1%) |
Disability Class: Vision Difficulty
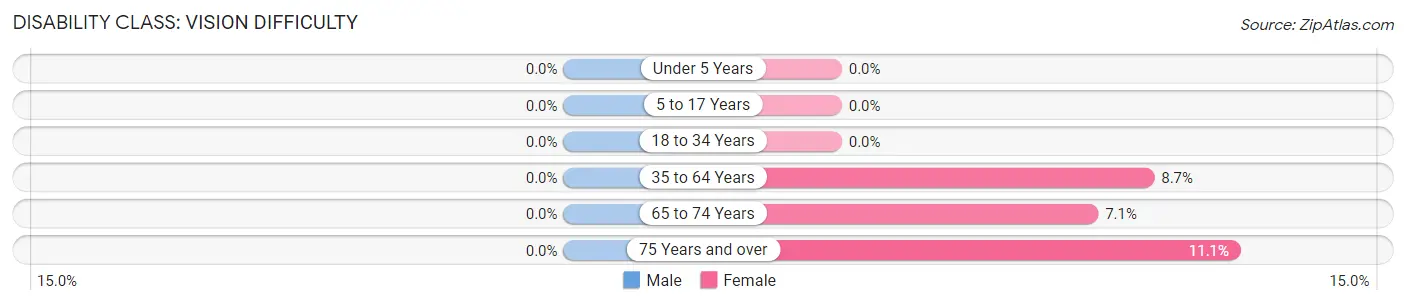
| Age Bracket | Male | Female |
| Under 5 Years | 0 (0.0%) | 0 (0.0%) |
| 5 to 17 Years | 0 (0.0%) | 0 (0.0%) |
| 18 to 34 Years | 0 (0.0%) | 0 (0.0%) |
| 35 to 64 Years | 0 (0.0%) | 6 (8.7%) |
| 65 to 74 Years | 0 (0.0%) | 2 (7.1%) |
| 75 Years and over | 0 (0.0%) | 2 (11.1%) |
Disability Class: Cognitive Difficulty
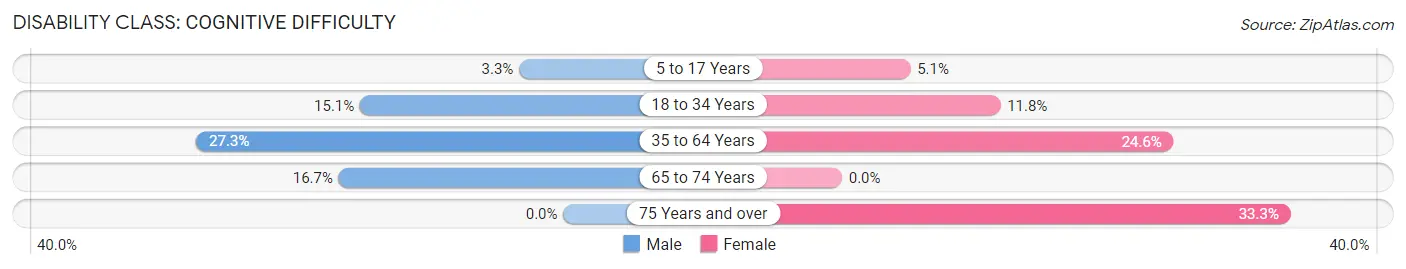
| Age Bracket | Male | Female |
| 5 to 17 Years | 2 (3.3%) | 3 (5.1%) |
| 18 to 34 Years | 8 (15.1%) | 6 (11.8%) |
| 35 to 64 Years | 24 (27.3%) | 17 (24.6%) |
| 65 to 74 Years | 2 (16.7%) | 0 (0.0%) |
| 75 Years and over | 0 (0.0%) | 6 (33.3%) |
Disability Class: Ambulatory Difficulty
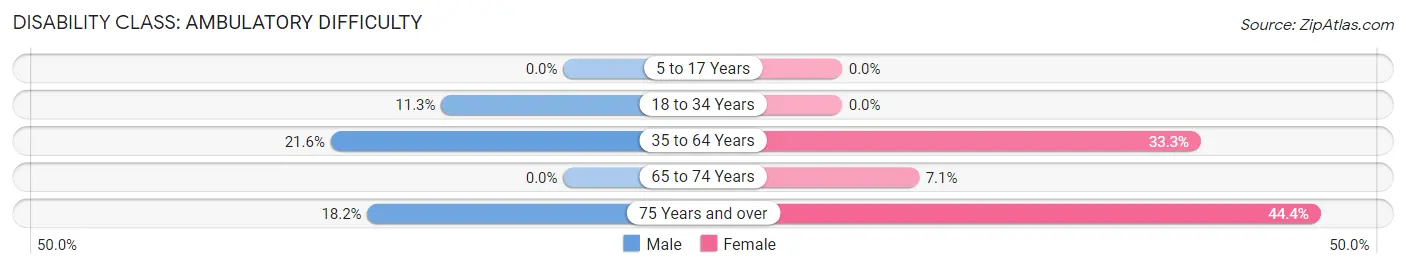
| Age Bracket | Male | Female |
| 5 to 17 Years | 0 (0.0%) | 0 (0.0%) |
| 18 to 34 Years | 6 (11.3%) | 0 (0.0%) |
| 35 to 64 Years | 19 (21.6%) | 23 (33.3%) |
| 65 to 74 Years | 0 (0.0%) | 2 (7.1%) |
| 75 Years and over | 2 (18.2%) | 8 (44.4%) |
Disability Class: Self-Care Difficulty
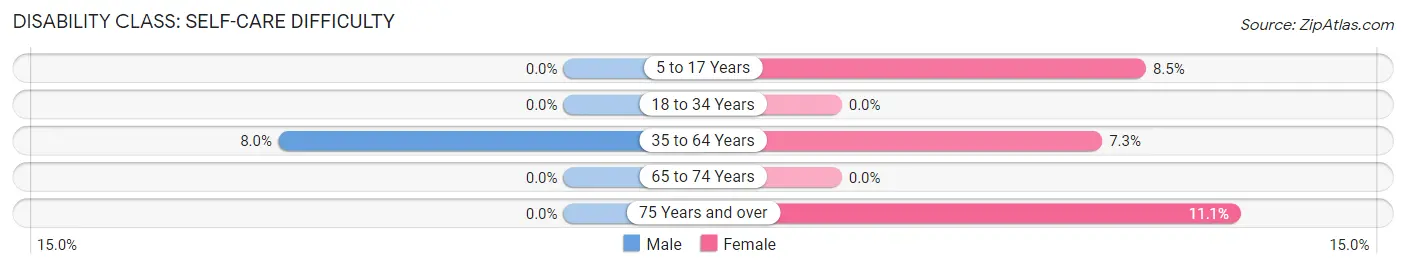
| Age Bracket | Male | Female |
| 5 to 17 Years | 0 (0.0%) | 5 (8.5%) |
| 18 to 34 Years | 0 (0.0%) | 0 (0.0%) |
| 35 to 64 Years | 7 (8.0%) | 5 (7.2%) |
| 65 to 74 Years | 0 (0.0%) | 0 (0.0%) |
| 75 Years and over | 0 (0.0%) | 2 (11.1%) |
Technology Access in Huntington
Computing Device Access in Huntington
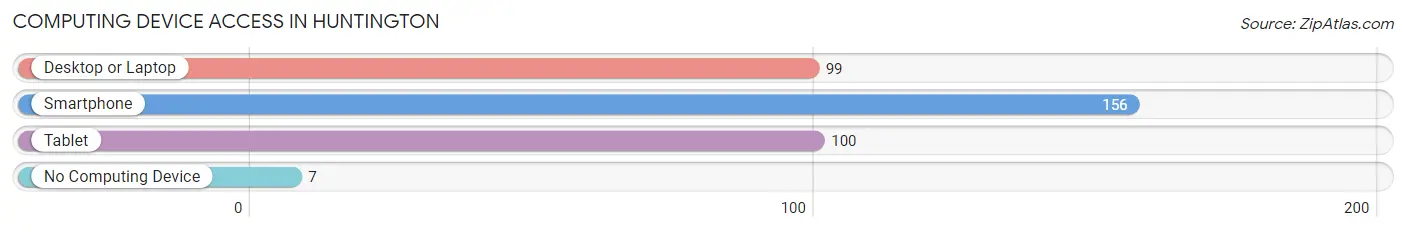
| Device Type | # Households | % Households |
| Desktop or Laptop | 99 | 56.2% |
| Smartphone | 156 | 88.6% |
| Tablet | 100 | 56.8% |
| No Computing Device | 7 | 4.0% |
| Total | 176 | 100.0% |
Internet Access in Huntington
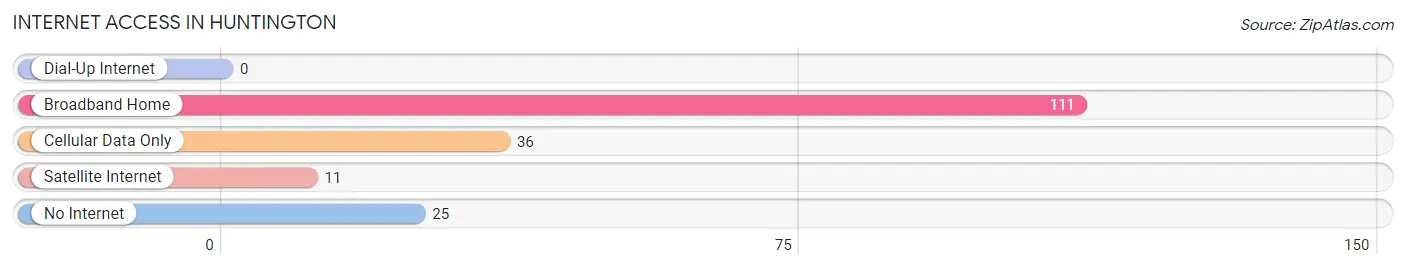
| Internet Type | # Households | % Households |
| Dial-Up Internet | 0 | 0.0% |
| Broadband Home | 111 | 63.1% |
| Cellular Data Only | 36 | 20.4% |
| Satellite Internet | 11 | 6.2% |
| No Internet | 25 | 14.2% |
| Total | 176 | 100.0% |
Huntington Summary
Huntington, Arkansas is a small town located in the northwest corner of the state, in the foothills of the Ozark Mountains. It is situated in the White River Valley, and is the county seat of Carroll County. The town was founded in 1871, and has a population of approximately 1,000 people.
Geography
Huntington is located in the northwest corner of Arkansas, in the foothills of the Ozark Mountains. It is situated in the White River Valley, and is the county seat of Carroll County. The town is located at the intersection of US Highway 412 and Arkansas Highway 21. The town is surrounded by rolling hills and forests, and is located near the Buffalo National River.
Climate
Huntington has a humid subtropical climate, with hot, humid summers and mild winters. The average annual temperature is around 63°F, with an average high of around 87°F in the summer and an average low of around 37°F in the winter. The average annual precipitation is around 45 inches, with most of the rain falling in the spring and summer months.
Economy
Huntington’s economy is largely based on agriculture and tourism. The town is home to several small businesses, including a grocery store, a hardware store, and a few restaurants. The town is also home to a few small manufacturing companies, including a furniture factory and a woodworking shop. The town is also home to a few small farms, which produce a variety of crops, including corn, soybeans, and hay.
Tourism is also an important part of the local economy. The town is home to several attractions, including the historic Carroll County Courthouse, the Buffalo National River, and the Ozark National Forest. The town also hosts several festivals throughout the year, including the annual Carroll County Fair and the White River Festival.
Demographics
As of the 2010 census, Huntington had a population of 1,000 people. The racial makeup of the town was 97.2% White, 0.7% African American, 0.3% Native American, 0.2% Asian, 0.1% Pacific Islander, 0.3% from other races, and 1.3% from two or more races. Hispanic or Latino of any race were 1.3% of the population.
The median income for a household in Huntington was $30,000, and the median income for a family was $35,000. The per capita income for the town was $15,000. About 17.5% of the population was below the poverty line.
History
Huntington was founded in 1871, and was named after the town’s first postmaster, William Huntington. The town was originally a small farming community, and was home to several small businesses, including a general store, a blacksmith shop, and a sawmill. The town was also home to a few small manufacturing companies, including a furniture factory and a woodworking shop.
In the early 1900s, the town began to grow, and several new businesses opened, including a bank, a hotel, and a movie theater. The town was also home to several churches, and was the site of the first public school in Carroll County.
In the 1950s, the town began to decline, as many of the businesses closed and the population began to decline. In the 1970s, the town began to experience a resurgence, as new businesses opened and the population began to grow. Today, Huntington is a small, but vibrant town, with a population of around 1,000 people.
Common Questions
What is Per Capita Income in Huntington?
Per Capita income in Huntington is $16,646.
What is the Median Family Income in Huntington?
Median Family Income in Huntington is $43,438.
What is the Median Household income in Huntington?
Median Household Income in Huntington is $35,000.
What is Income or Wage Gap in Huntington?
Income or Wage Gap in Huntington is 31.8%.
Women in Huntington earn 68.2 cents for every dollar earned by a man.
What is Family Income Deficit in Huntington?
Family Income Deficit in Huntington is $3,880.
Families that are below poverty line in Huntington earn $3,880 less on average than the poverty threshold level.
What is Inequality or Gini Index in Huntington?
Inequality or Gini Index in Huntington is 0.35.
What is the Total Population of Huntington?
Total Population of Huntington is 490.
What is the Total Male Population of Huntington?
Total Male Population of Huntington is 252.
What is the Total Female Population of Huntington?
Total Female Population of Huntington is 238.
What is the Ratio of Males per 100 Females in Huntington?
There are 105.88 Males per 100 Females in Huntington.
What is the Ratio of Females per 100 Males in Huntington?
There are 94.44 Females per 100 Males in Huntington.
What is the Median Population Age in Huntington?
Median Population Age in Huntington is 34.3 Years.
What is the Average Family Size in Huntington
Average Family Size in Huntington is 3.4 People.
What is the Average Household Size in Huntington
Average Household Size in Huntington is 2.8 People.
How Large is the Labor Force in Huntington?
There are 188 People in the Labor Forcein in Huntington.
What is the Percentage of People in the Labor Force in Huntington?
54.8% of People are in the Labor Force in Huntington.
What is the Unemployment Rate in Huntington?
Unemployment Rate in Huntington is 6.4%.