Newton County, AR Map & Demographics
Newton County Map
Newton County Overview
$26,544
PER CAPITA INCOME
$66,066
AVG FAMILY INCOME
$50,699
AVG HOUSEHOLD INCOME
16.8%
WAGE / INCOME GAP [ % ]
83.2¢/ $1
WAGE / INCOME GAP [ $ ]
$7,080
FAMILY INCOME DEFICIT
0.42
INEQUALITY / GINI INDEX
7,243
TOTAL POPULATION
3,724
MALE POPULATION
3,519
FEMALE POPULATION
105.83
MALES / 100 FEMALES
94.50
FEMALES / 100 MALES
48.7
MEDIAN AGE
3.0
AVG FAMILY SIZE
2.5
AVG HOUSEHOLD SIZE
3,025
LABOR FORCE [ PEOPLE ]
49.6%
PERCENT IN LABOR FORCE
3.8%
UNEMPLOYMENT RATE
Income in Newton County
Income Overview in Newton County
Per Capita Income in Newton County is $26,544, while median incomes of families and households are $66,066 and $50,699 respectively.
| Characteristic | Number | Measure |
| Per Capita Income | 7,243 | $26,544 |
| Median Family Income | 1,919 | $66,066 |
| Mean Family Income | 1,919 | $76,963 |
| Median Household Income | 2,905 | $50,699 |
| Mean Household Income | 2,905 | $65,087 |
| Income Deficit | 1,919 | $7,080 |
| Wage / Income Gap (%) | 7,243 | 16.85% |
| Wage / Income Gap ($) | 7,243 | 83.15¢ per $1 |
| Gini / Inequality Index | 7,243 | 0.42 |
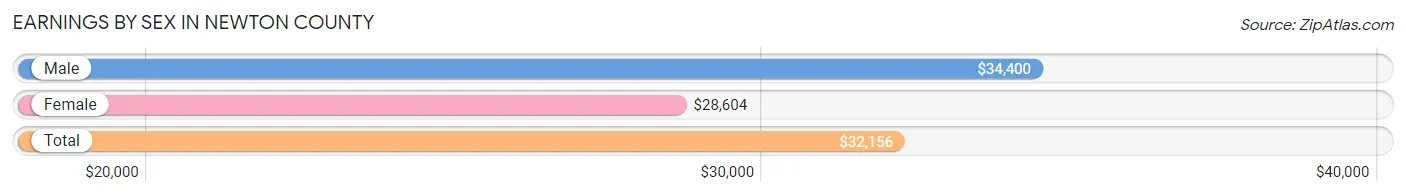
Earnings by Sex in Newton County
Average Earnings in Newton County are $32,156, $34,400 for men and $28,604 for women, a difference of 16.9%.
| Sex | Number | Average Earnings |
| Male | 1,821 (55.4%) | $34,400 |
| Female | 1,467 (44.6%) | $28,604 |
| Total | 3,288 (100.0%) | $32,156 |
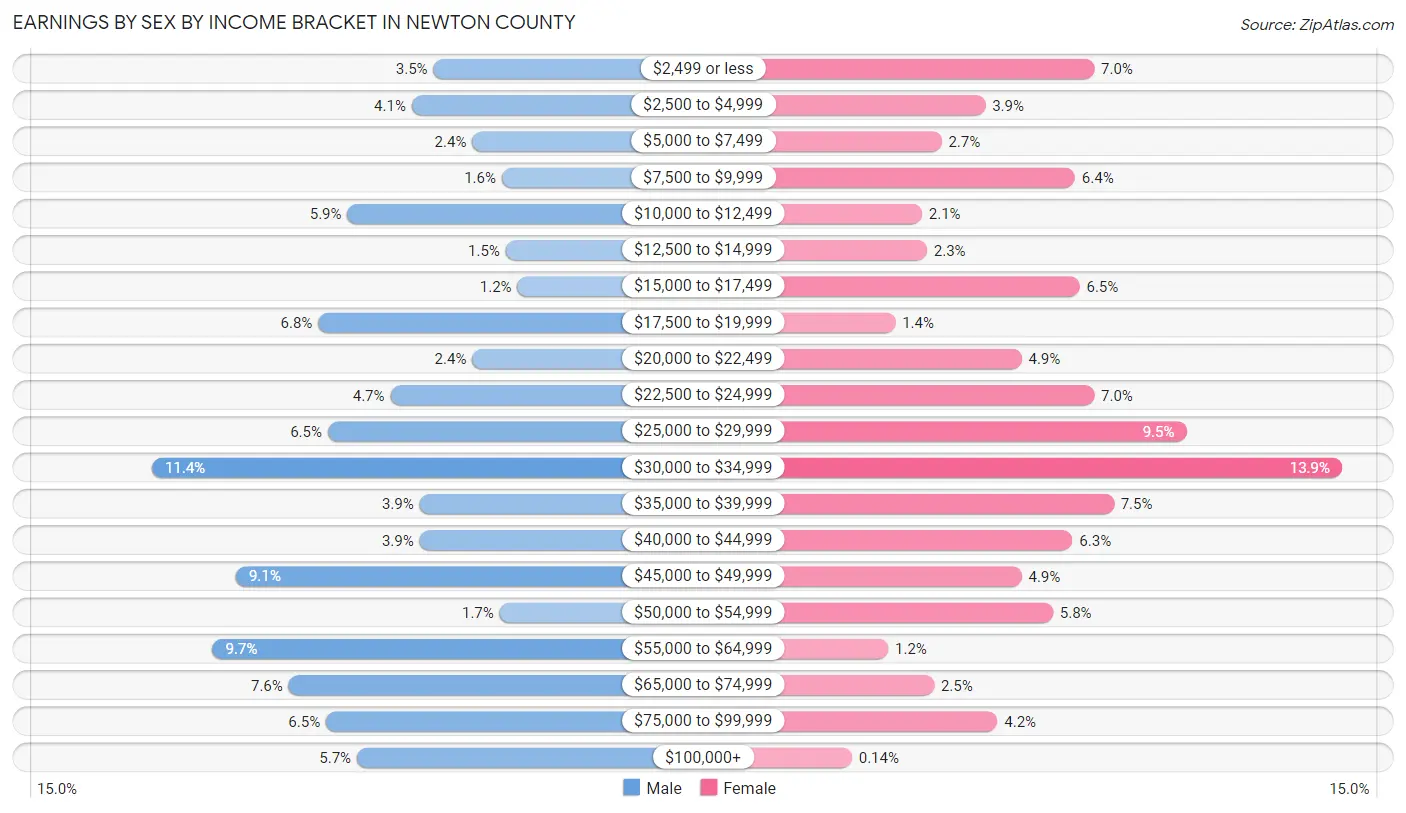
Earnings by Sex by Income Bracket in Newton County
The most common earnings brackets in Newton County are $30,000 to $34,999 for men (208 | 11.4%) and $30,000 to $34,999 for women (204 | 13.9%).
| Income | Male | Female |
| $2,499 or less | 64 (3.5%) | 102 (7.0%) |
| $2,500 to $4,999 | 75 (4.1%) | 57 (3.9%) |
| $5,000 to $7,499 | 44 (2.4%) | 39 (2.7%) |
| $7,500 to $9,999 | 29 (1.6%) | 94 (6.4%) |
| $10,000 to $12,499 | 108 (5.9%) | 31 (2.1%) |
| $12,500 to $14,999 | 27 (1.5%) | 33 (2.2%) |
| $15,000 to $17,499 | 21 (1.1%) | 96 (6.5%) |
| $17,500 to $19,999 | 123 (6.8%) | 20 (1.4%) |
| $20,000 to $22,499 | 44 (2.4%) | 72 (4.9%) |
| $22,500 to $24,999 | 86 (4.7%) | 102 (7.0%) |
| $25,000 to $29,999 | 118 (6.5%) | 140 (9.5%) |
| $30,000 to $34,999 | 208 (11.4%) | 204 (13.9%) |
| $35,000 to $39,999 | 71 (3.9%) | 110 (7.5%) |
| $40,000 to $44,999 | 71 (3.9%) | 93 (6.3%) |
| $45,000 to $49,999 | 165 (9.1%) | 72 (4.9%) |
| $50,000 to $54,999 | 30 (1.7%) | 85 (5.8%) |
| $55,000 to $64,999 | 177 (9.7%) | 17 (1.2%) |
| $65,000 to $74,999 | 138 (7.6%) | 36 (2.5%) |
| $75,000 to $99,999 | 119 (6.5%) | 62 (4.2%) |
| $100,000+ | 103 (5.7%) | 2 (0.1%) |
| Total | 1,821 (100.0%) | 1,467 (100.0%) |
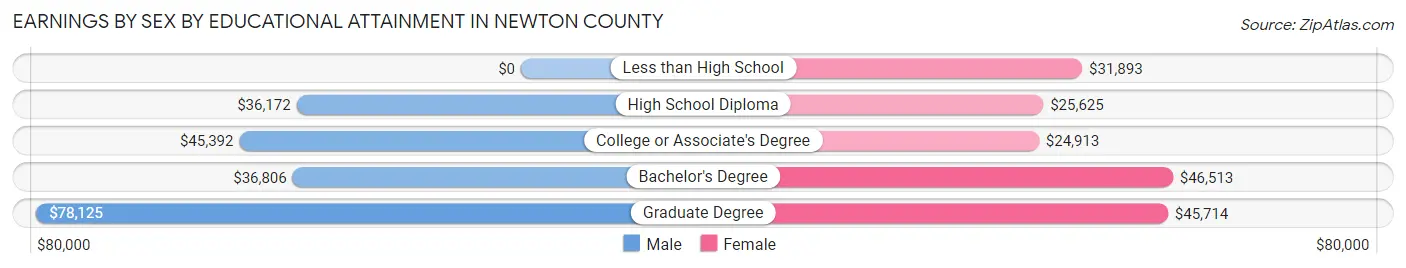
Earnings by Sex by Educational Attainment in Newton County
Average earnings in Newton County are $37,390 for men and $28,856 for women, a difference of 22.8%. Men with an educational attainment of graduate degree enjoy the highest average annual earnings of $78,125, while those with high school diploma education earn the least with $36,172. Women with an educational attainment of bachelor's degree earn the most with the average annual earnings of $46,513, while those with college or associate's degree education have the smallest earnings of $24,913.
| Educational Attainment | Male Income | Female Income |
| Less than High School | - | - |
| High School Diploma | $36,172 | $25,625 |
| College or Associate's Degree | $45,392 | $24,913 |
| Bachelor's Degree | $36,806 | $46,513 |
| Graduate Degree | $78,125 | $45,714 |
| Total | $37,390 | $28,856 |
Family Income in Newton County
Family Income Brackets in Newton County
According to the Newton County family income data, there are 420 families falling into the $75,000 to $99,999 income range, which is the most common income bracket and makes up 21.9% of all families. Conversely, the $10,000 to $14,999 income bracket is the least frequent group with only 27 families (1.4%) belonging to this category.
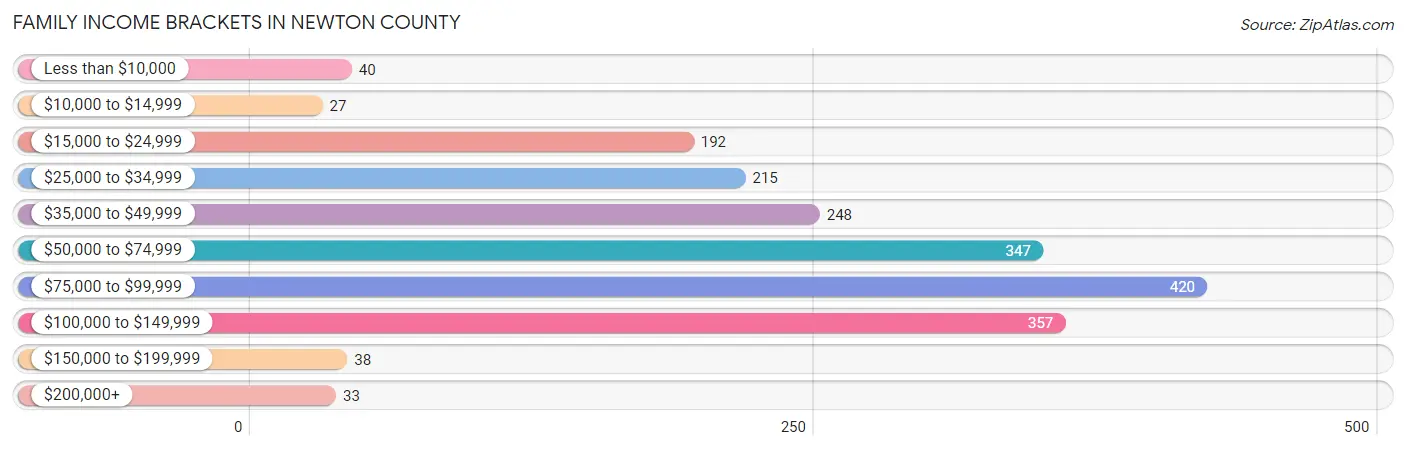
| Income Bracket | # Families | % Families |
| Less than $10,000 | 40 | 2.1% |
| $10,000 to $14,999 | 27 | 1.4% |
| $15,000 to $24,999 | 192 | 10.0% |
| $25,000 to $34,999 | 215 | 11.2% |
| $35,000 to $49,999 | 248 | 12.9% |
| $50,000 to $74,999 | 347 | 18.1% |
| $75,000 to $99,999 | 420 | 21.9% |
| $100,000 to $149,999 | 357 | 18.6% |
| $150,000 to $199,999 | 38 | 2.0% |
| $200,000+ | 33 | 1.7% |
Family Income by Famaliy Size in Newton County
5-person families (42 | 2.2%) account for the highest median family income in Newton County with $102,045 per family, while 3-person families (415 | 21.6%) have the highest median income of $31,233 per family member.
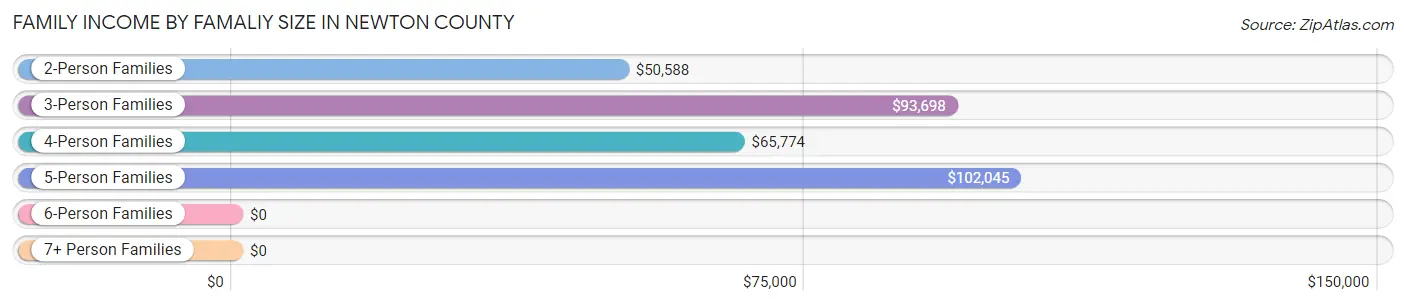
| Income Bracket | # Families | Median Income |
| 2-Person Families | 1,208 (62.9%) | $50,588 |
| 3-Person Families | 415 (21.6%) | $93,698 |
| 4-Person Families | 221 (11.5%) | $65,774 |
| 5-Person Families | 42 (2.2%) | $102,045 |
| 6-Person Families | 26 (1.3%) | $0 |
| 7+ Person Families | 7 (0.4%) | $0 |
| Total | 1,919 (100.0%) | $66,066 |
Family Income by Number of Earners in Newton County
The median family income in Newton County is $66,066, with families comprising 3+ earners (101) having the highest median family income of $126,354, while families with no earners (458) have the lowest median family income of $36,000, accounting for 5.3% and 23.9% of families, respectively.
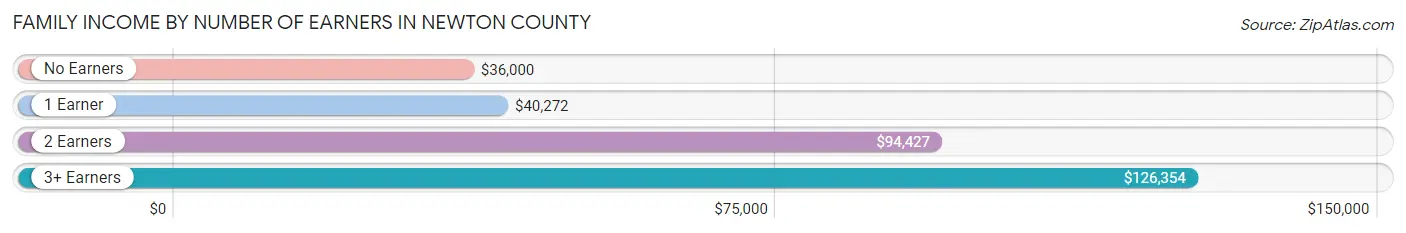
| Number of Earners | # Families | Median Income |
| No Earners | 458 (23.9%) | $36,000 |
| 1 Earner | 527 (27.5%) | $40,272 |
| 2 Earners | 833 (43.4%) | $94,427 |
| 3+ Earners | 101 (5.3%) | $126,354 |
| Total | 1,919 (100.0%) | $66,066 |
Household Income in Newton County
Household Income Brackets in Newton County
With 529 households falling in the category, the $75,000 to $99,999 income range is the most frequent in Newton County, accounting for 18.2% of all households. In contrast, only 38 households (1.3%) fall into the $150,000 to $199,999 income bracket, making it the least populous group.
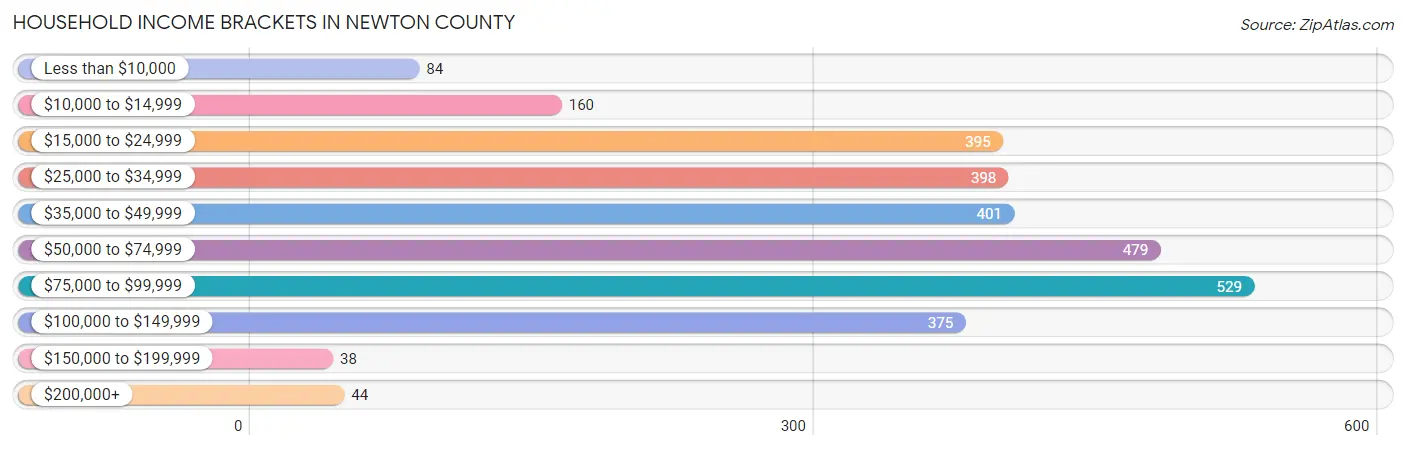
| Income Bracket | # Households | % Households |
| Less than $10,000 | 84 | 2.9% |
| $10,000 to $14,999 | 160 | 5.5% |
| $15,000 to $24,999 | 395 | 13.6% |
| $25,000 to $34,999 | 398 | 13.7% |
| $35,000 to $49,999 | 401 | 13.8% |
| $50,000 to $74,999 | 479 | 16.5% |
| $75,000 to $99,999 | 529 | 18.2% |
| $100,000 to $149,999 | 375 | 12.9% |
| $150,000 to $199,999 | 38 | 1.3% |
| $200,000+ | 44 | 1.5% |
Household Income by Householder Age in Newton County
The median household income in Newton County is $50,699, with the highest median household income of $68,527 found in the 45 to 64 years age bracket for the primary householder. A total of 1,087 households (37.4%) fall into this category. Meanwhile, the 15 to 24 years age bracket for the primary householder has the lowest median household income of $33,125, with 101 households (3.5%) in this group.
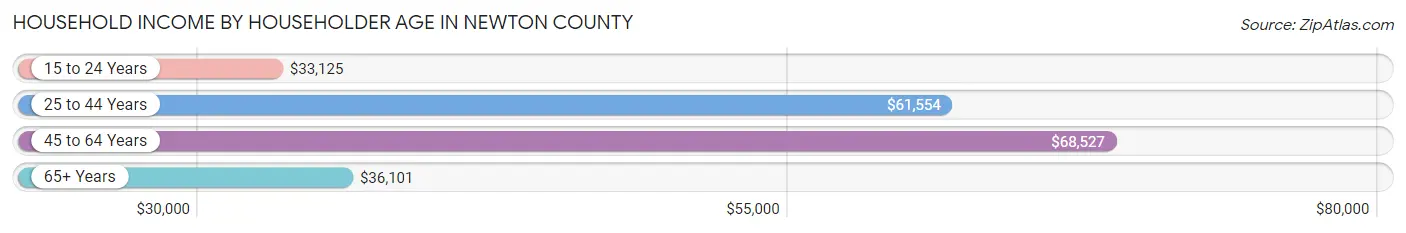
| Income Bracket | # Households | Median Income |
| 15 to 24 Years | 101 (3.5%) | $33,125 |
| 25 to 44 Years | 630 (21.7%) | $61,554 |
| 45 to 64 Years | 1,087 (37.4%) | $68,527 |
| 65+ Years | 1,087 (37.4%) | $36,101 |
| Total | 2,905 (100.0%) | $50,699 |
Poverty in Newton County
Income Below Poverty by Sex and Age in Newton County
With 10.2% poverty level for males and 12.6% for females among the residents of Newton County, under 5 year old males and under 5 year old females are the most vulnerable to poverty, with 74 males (44.1%) and 43 females (27.9%) in their respective age groups living below the poverty level.
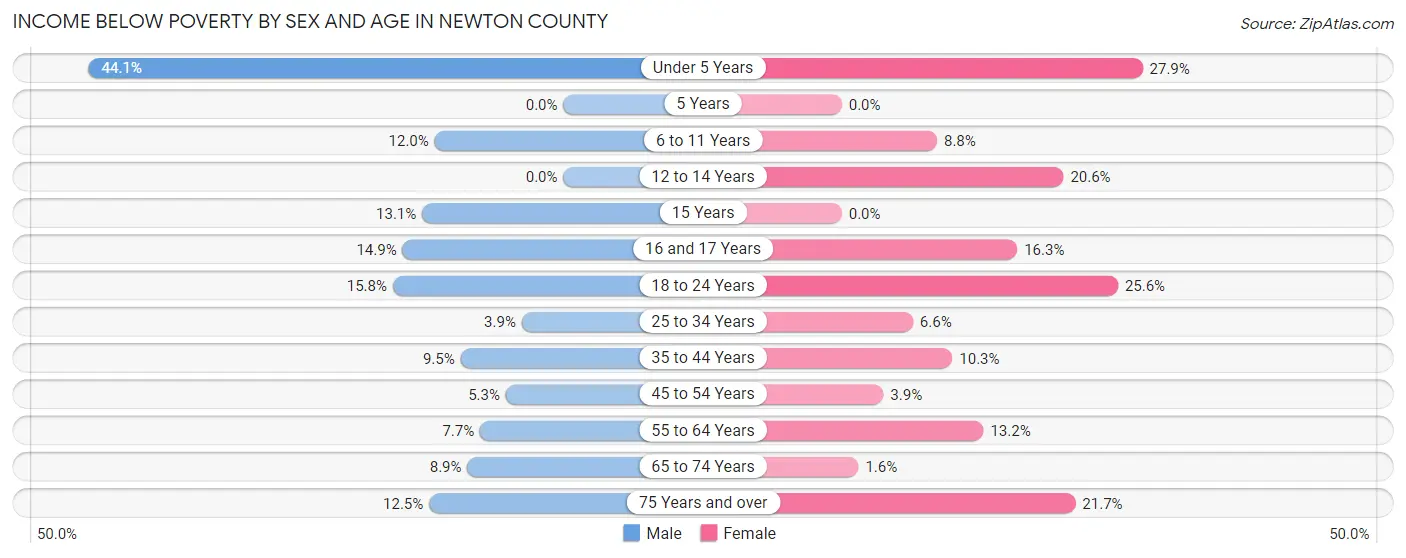
| Age Bracket | Male | Female |
| Under 5 Years | 74 (44.1%) | 43 (27.9%) |
| 5 Years | 0 (0.0%) | 0 (0.0%) |
| 6 to 11 Years | 19 (11.9%) | 22 (8.8%) |
| 12 to 14 Years | 0 (0.0%) | 29 (20.6%) |
| 15 Years | 8 (13.1%) | 0 (0.0%) |
| 16 and 17 Years | 20 (14.9%) | 21 (16.3%) |
| 18 to 24 Years | 38 (15.8%) | 92 (25.6%) |
| 25 to 34 Years | 14 (3.9%) | 14 (6.6%) |
| 35 to 44 Years | 35 (9.5%) | 35 (10.3%) |
| 45 to 54 Years | 23 (5.3%) | 16 (3.9%) |
| 55 to 64 Years | 47 (7.7%) | 73 (13.2%) |
| 65 to 74 Years | 55 (8.9%) | 8 (1.5%) |
| 75 Years and over | 43 (12.5%) | 85 (21.7%) |
| Total | 376 (10.2%) | 438 (12.6%) |
Income Above Poverty by Sex and Age in Newton County
According to the poverty statistics in Newton County, males aged 5 years and females aged 5 years are the age groups that are most secure financially, with 100.0% of males and 100.0% of females in these age groups living above the poverty line.
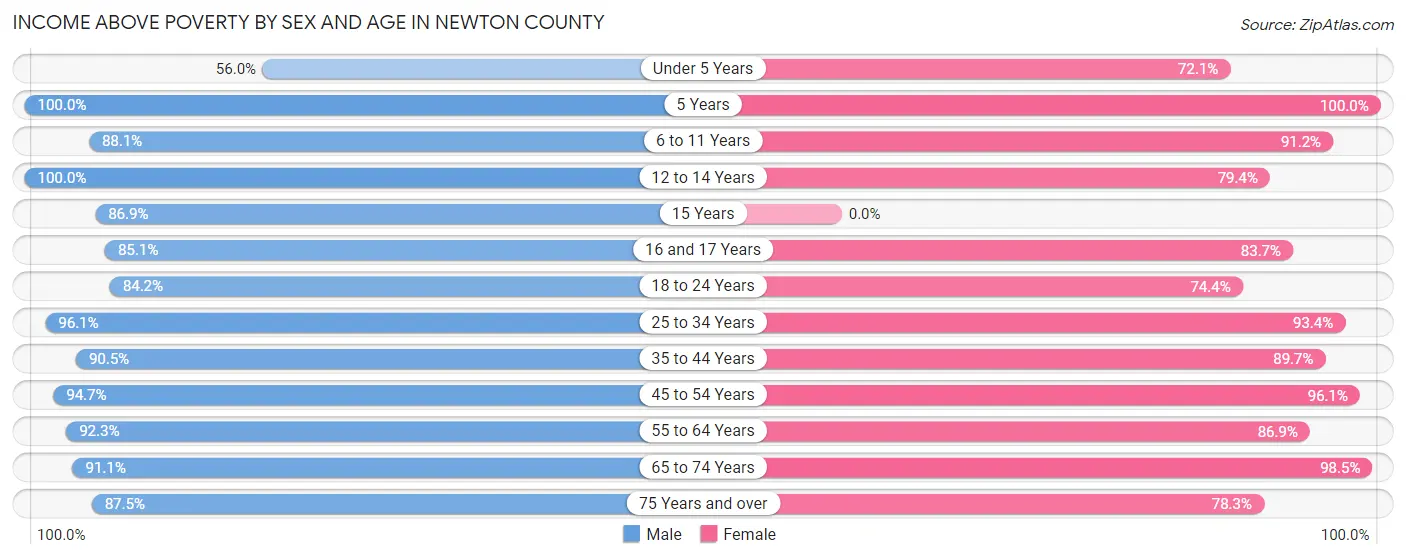
| Age Bracket | Male | Female |
| Under 5 Years | 94 (55.9%) | 111 (72.1%) |
| 5 Years | 85 (100.0%) | 6 (100.0%) |
| 6 to 11 Years | 140 (88.0%) | 227 (91.2%) |
| 12 to 14 Years | 122 (100.0%) | 112 (79.4%) |
| 15 Years | 53 (86.9%) | 0 (0.0%) |
| 16 and 17 Years | 114 (85.1%) | 108 (83.7%) |
| 18 to 24 Years | 202 (84.2%) | 267 (74.4%) |
| 25 to 34 Years | 349 (96.1%) | 198 (93.4%) |
| 35 to 44 Years | 332 (90.5%) | 306 (89.7%) |
| 45 to 54 Years | 408 (94.7%) | 398 (96.1%) |
| 55 to 64 Years | 561 (92.3%) | 482 (86.9%) |
| 65 to 74 Years | 562 (91.1%) | 509 (98.5%) |
| 75 Years and over | 302 (87.5%) | 307 (78.3%) |
| Total | 3,324 (89.8%) | 3,031 (87.4%) |
Income Below Poverty Among Married-Couple Families in Newton County
The poverty statistics for married-couple families in Newton County show that 4.0% or 64 of the total 1,584 families live below the poverty line. Families with no children have the highest poverty rate of 5.3%, comprising of 64 families. On the other hand, families with 1 or 2 children have the lowest poverty rate of 0.0%, which includes 0 families.
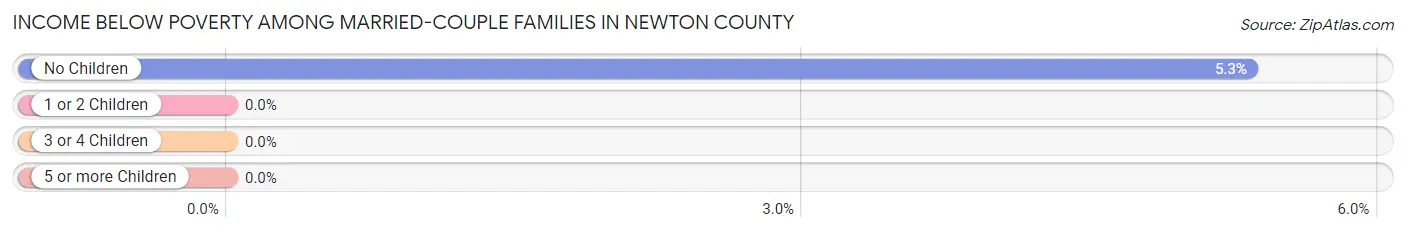
| Children | Above Poverty | Below Poverty |
| No Children | 1,137 (94.7%) | 64 (5.3%) |
| 1 or 2 Children | 324 (100.0%) | 0 (0.0%) |
| 3 or 4 Children | 59 (100.0%) | 0 (0.0%) |
| 5 or more Children | 0 (0.0%) | 0 (0.0%) |
| Total | 1,520 (96.0%) | 64 (4.0%) |
Income Below Poverty Among Single-Parent Households in Newton County
According to the poverty data in Newton County, 23.9% or 22 single-father households and 25.5% or 62 single-mother households are living below the poverty line. Among single-father households, those with 3 or 4 children have the highest poverty rate, with 11 households (68.8%) experiencing poverty. Likewise, among single-mother households, those with 3 or 4 children have the highest poverty rate, with 4 households (100.0%) falling below the poverty line.
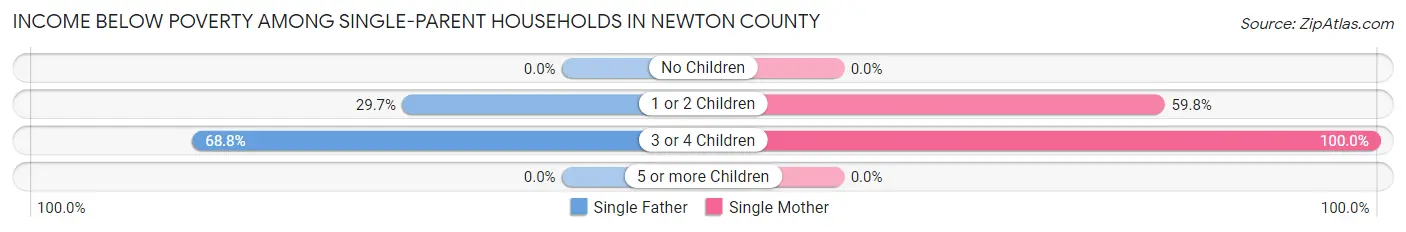
| Children | Single Father | Single Mother |
| No Children | 0 (0.0%) | 0 (0.0%) |
| 1 or 2 Children | 11 (29.7%) | 58 (59.8%) |
| 3 or 4 Children | 11 (68.8%) | 4 (100.0%) |
| 5 or more Children | 0 (0.0%) | 0 (0.0%) |
| Total | 22 (23.9%) | 62 (25.5%) |
Income Below Poverty Among Married-Couple vs Single-Parent Households in Newton County
The poverty data for Newton County shows that 64 of the married-couple family households (4.0%) and 84 of the single-parent households (25.1%) are living below the poverty level. Within the married-couple family households, those with no children have the highest poverty rate, with 64 households (5.3%) falling below the poverty line. Among the single-parent households, those with 3 or 4 children have the highest poverty rate, with 15 household (75.0%) living below poverty.
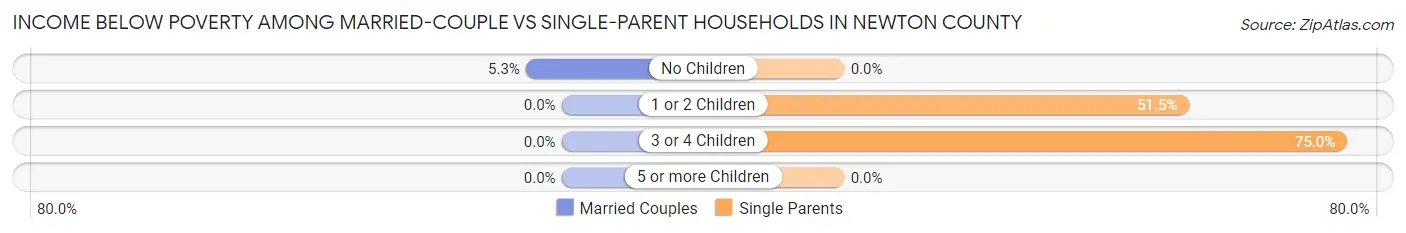
| Children | Married-Couple Families | Single-Parent Households |
| No Children | 64 (5.3%) | 0 (0.0%) |
| 1 or 2 Children | 0 (0.0%) | 69 (51.5%) |
| 3 or 4 Children | 0 (0.0%) | 15 (75.0%) |
| 5 or more Children | 0 (0.0%) | 0 (0.0%) |
| Total | 64 (4.0%) | 84 (25.1%) |
Race in Newton County
The most populous races in Newton County are White / Caucasian (6,734 | 93.0%), Two or more Races (335 | 4.6%), and Hispanic or Latino (132 | 1.8%).
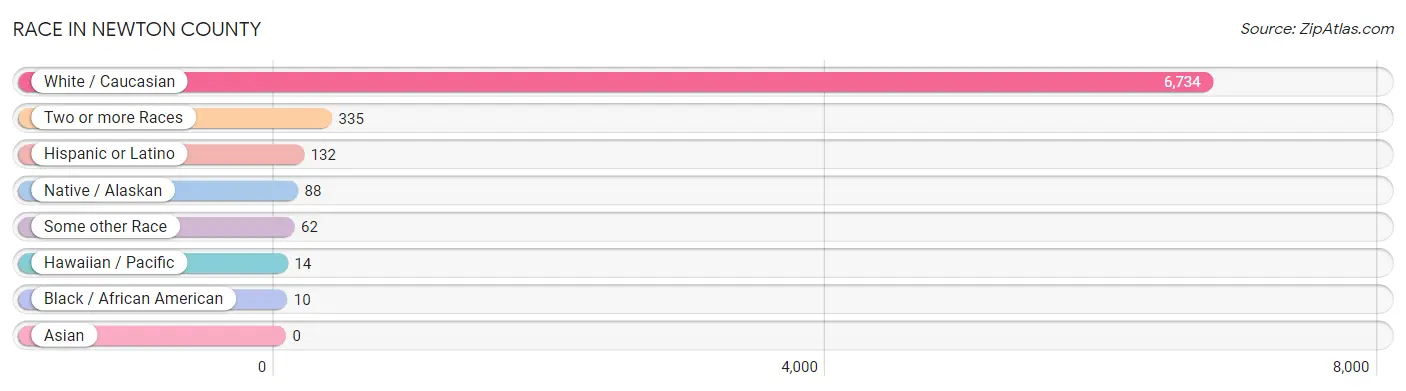
| Race | # Population | % Population |
| Asian | 0 | 0.0% |
| Black / African American | 10 | 0.1% |
| Hawaiian / Pacific | 14 | 0.2% |
| Hispanic or Latino | 132 | 1.8% |
| Native / Alaskan | 88 | 1.2% |
| White / Caucasian | 6,734 | 93.0% |
| Two or more Races | 335 | 4.6% |
| Some other Race | 62 | 0.9% |
| Total | 7,243 | 100.0% |
Ancestry in Newton County
The most populous ancestries reported in Newton County are English (797 | 11.0%), German (789 | 10.9%), Irish (706 | 9.8%), American (542 | 7.5%), and French (204 | 2.8%), together accounting for 41.9% of all Newton County residents.
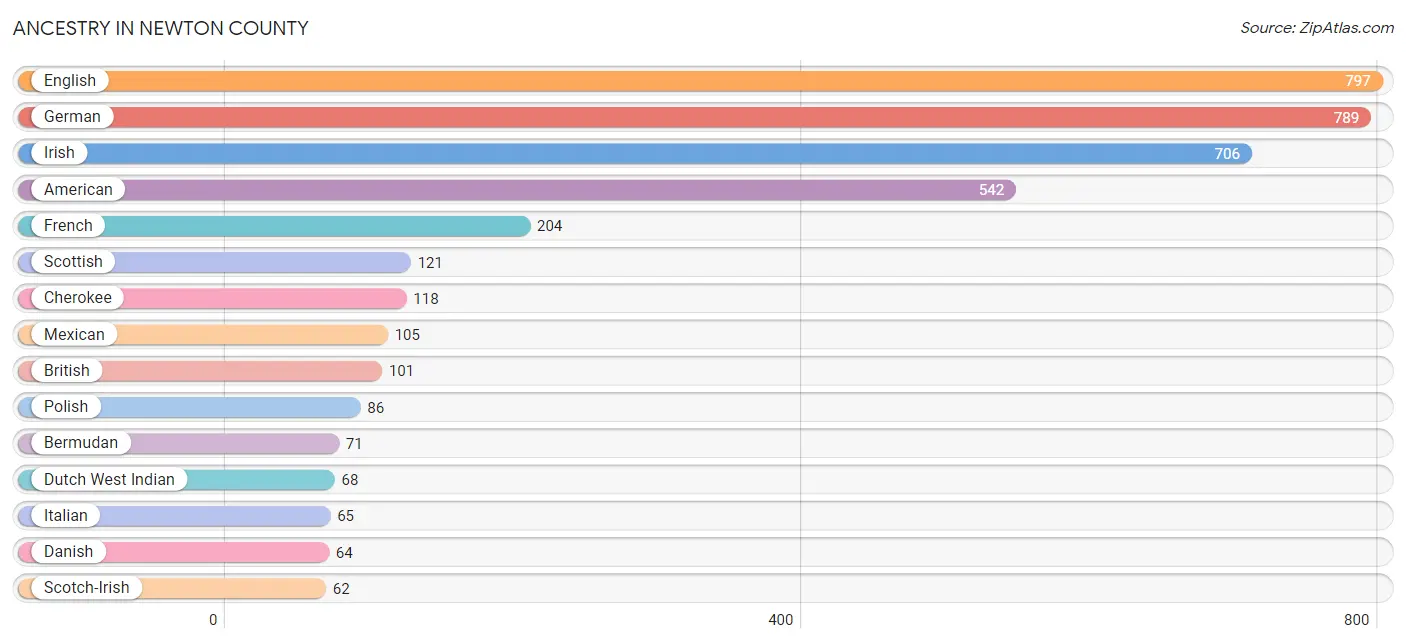
| Ancestry | # Population | % Population |
| American | 542 | 7.5% |
| Bermudan | 71 | 1.0% |
| Blackfeet | 12 | 0.2% |
| British | 101 | 1.4% |
| Central American | 19 | 0.3% |
| Cherokee | 118 | 1.6% |
| Danish | 64 | 0.9% |
| Dutch | 18 | 0.3% |
| Dutch West Indian | 68 | 0.9% |
| English | 797 | 11.0% |
| European | 23 | 0.3% |
| French | 204 | 2.8% |
| French Canadian | 20 | 0.3% |
| German | 789 | 10.9% |
| Hungarian | 5 | 0.1% |
| Irish | 706 | 9.8% |
| Italian | 65 | 0.9% |
| Mexican | 105 | 1.5% |
| Northern European | 17 | 0.2% |
| Norwegian | 40 | 0.5% |
| Polish | 86 | 1.2% |
| Salvadoran | 19 | 0.3% |
| Scandinavian | 7 | 0.1% |
| Scotch-Irish | 62 | 0.9% |
| Scottish | 121 | 1.7% |
| Slavic | 4 | 0.1% |
| Spaniard | 8 | 0.1% |
| Swedish | 29 | 0.4% |
| Swiss | 44 | 0.6% |
| Ukrainian | 17 | 0.2% |
| Welsh | 41 | 0.6% | View All 31 Rows |
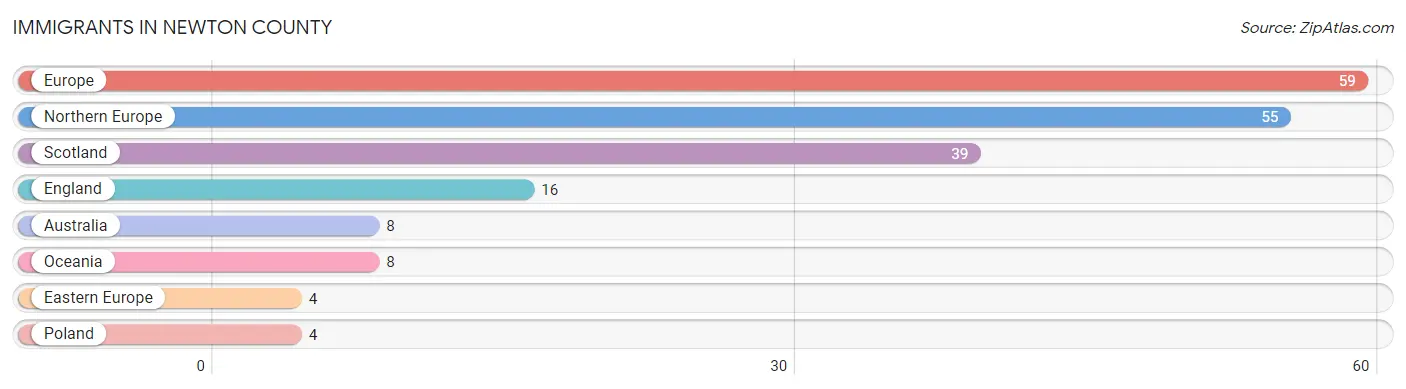
Immigrants in Newton County
The most numerous immigrant groups reported in Newton County came from Europe (59 | 0.8%), Northern Europe (55 | 0.8%), Scotland (39 | 0.5%), England (16 | 0.2%), and Australia (8 | 0.1%), together accounting for 2.4% of all Newton County residents.
| Immigration Origin | # Population | % Population |
| Australia | 8 | 0.1% |
| Eastern Europe | 4 | 0.1% |
| England | 16 | 0.2% |
| Europe | 59 | 0.8% |
| Northern Europe | 55 | 0.8% |
| Oceania | 8 | 0.1% |
| Poland | 4 | 0.1% |
| Scotland | 39 | 0.5% | View All 8 Rows |
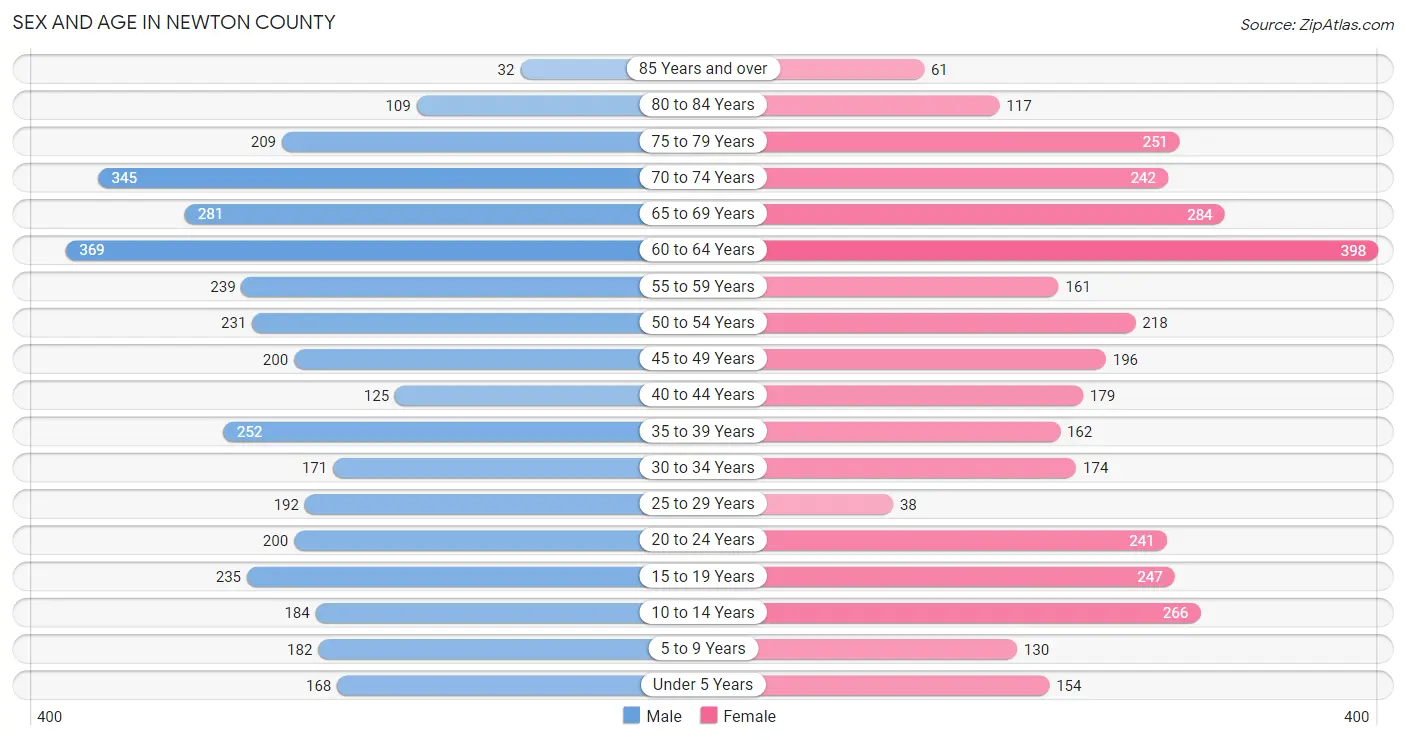
Sex and Age in Newton County
Sex and Age in Newton County
The most populous age groups in Newton County are 60 to 64 Years (369 | 9.9%) for men and 60 to 64 Years (398 | 11.3%) for women.
| Age Bracket | Male | Female |
| Under 5 Years | 168 (4.5%) | 154 (4.4%) |
| 5 to 9 Years | 182 (4.9%) | 130 (3.7%) |
| 10 to 14 Years | 184 (4.9%) | 266 (7.6%) |
| 15 to 19 Years | 235 (6.3%) | 247 (7.0%) |
| 20 to 24 Years | 200 (5.4%) | 241 (6.9%) |
| 25 to 29 Years | 192 (5.2%) | 38 (1.1%) |
| 30 to 34 Years | 171 (4.6%) | 174 (4.9%) |
| 35 to 39 Years | 252 (6.8%) | 162 (4.6%) |
| 40 to 44 Years | 125 (3.4%) | 179 (5.1%) |
| 45 to 49 Years | 200 (5.4%) | 196 (5.6%) |
| 50 to 54 Years | 231 (6.2%) | 218 (6.2%) |
| 55 to 59 Years | 239 (6.4%) | 161 (4.6%) |
| 60 to 64 Years | 369 (9.9%) | 398 (11.3%) |
| 65 to 69 Years | 281 (7.5%) | 284 (8.1%) |
| 70 to 74 Years | 345 (9.3%) | 242 (6.9%) |
| 75 to 79 Years | 209 (5.6%) | 251 (7.1%) |
| 80 to 84 Years | 109 (2.9%) | 117 (3.3%) |
| 85 Years and over | 32 (0.9%) | 61 (1.7%) |
| Total | 3,724 (100.0%) | 3,519 (100.0%) |
Families and Households in Newton County
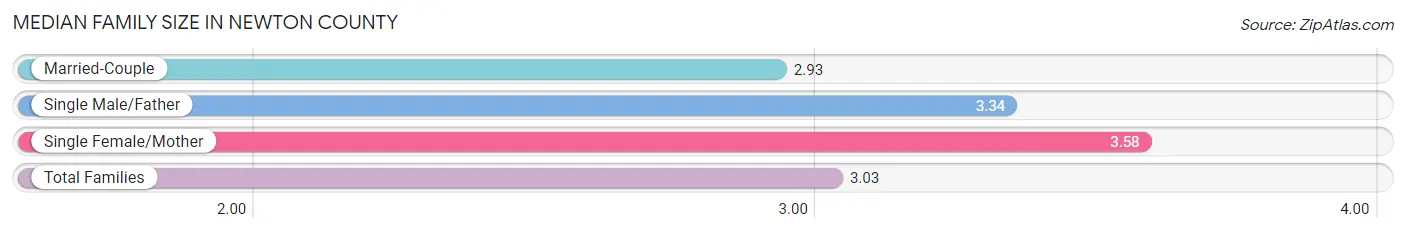
Median Family Size in Newton County
The median family size in Newton County is 3.03 persons per family, with single female/mother families (243 | 12.7%) accounting for the largest median family size of 3.58 persons per family. On the other hand, married-couple families (1,584 | 82.5%) represent the smallest median family size with 2.93 persons per family.
| Family Type | # Families | Family Size |
| Married-Couple | 1,584 (82.5%) | 2.93 |
| Single Male/Father | 92 (4.8%) | 3.34 |
| Single Female/Mother | 243 (12.7%) | 3.58 |
| Total Families | 1,919 (100.0%) | 3.03 |
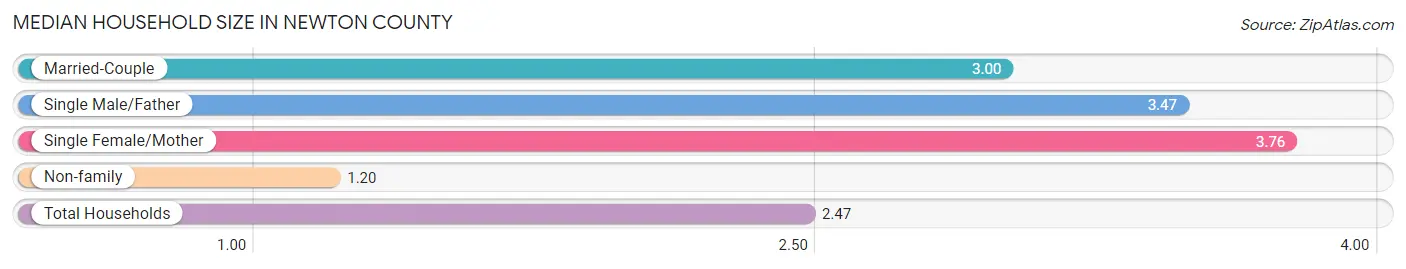
Median Household Size in Newton County
The median household size in Newton County is 2.47 persons per household, with single female/mother households (243 | 8.4%) accounting for the largest median household size of 3.76 persons per household. non-family households (986 | 33.9%) represent the smallest median household size with 1.20 persons per household.
| Household Type | # Households | Household Size |
| Married-Couple | 1,584 (54.5%) | 3.00 |
| Single Male/Father | 92 (3.2%) | 3.47 |
| Single Female/Mother | 243 (8.4%) | 3.76 |
| Non-family | 986 (33.9%) | 1.20 |
| Total Households | 2,905 (100.0%) | 2.47 |
Household Size by Marriage Status in Newton County
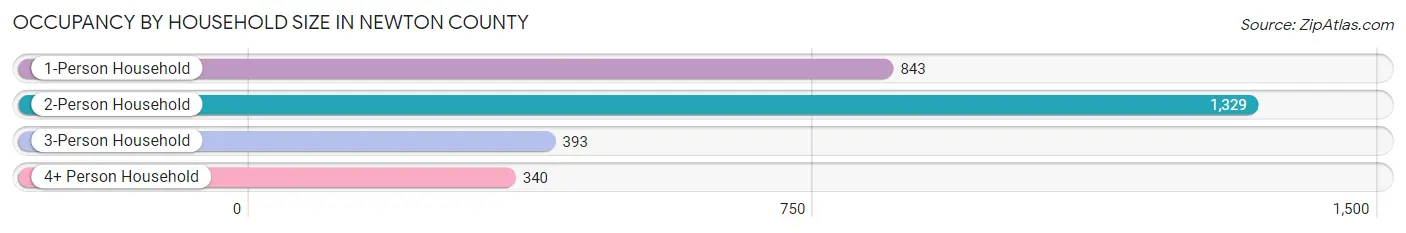
Out of a total of 2,905 households in Newton County, 1,919 (66.1%) are family households, while 986 (33.9%) are nonfamily households. The most numerous type of family households are 2-person households, comprising 1,186, and the most common type of nonfamily households are 1-person households, comprising 843.
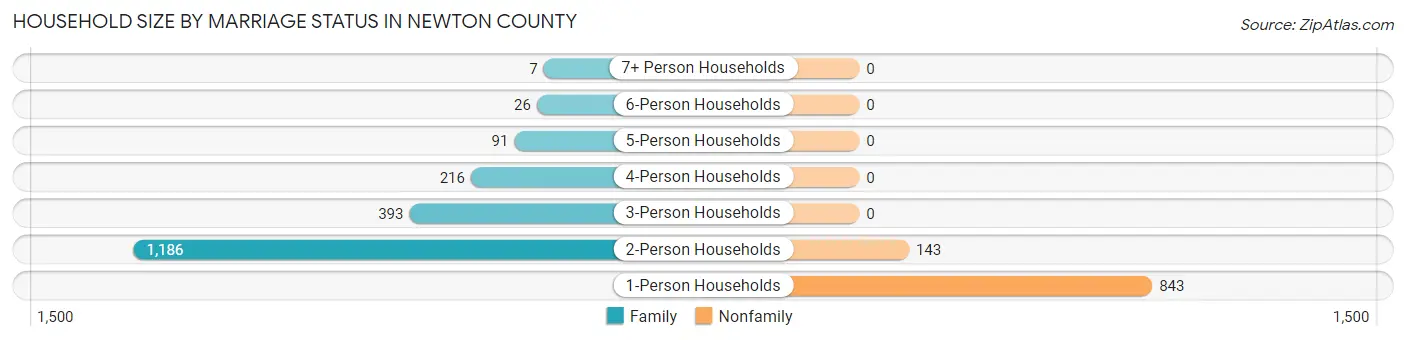
| Household Size | Family Households | Nonfamily Households |
| 1-Person Households | - | 843 (29.0%) |
| 2-Person Households | 1,186 (40.8%) | 143 (4.9%) |
| 3-Person Households | 393 (13.5%) | 0 (0.0%) |
| 4-Person Households | 216 (7.4%) | 0 (0.0%) |
| 5-Person Households | 91 (3.1%) | 0 (0.0%) |
| 6-Person Households | 26 (0.9%) | 0 (0.0%) |
| 7+ Person Households | 7 (0.2%) | 0 (0.0%) |
| Total | 1,919 (66.1%) | 986 (33.9%) |
Female Fertility in Newton County
Fertility by Age in Newton County
Average fertility rate in Newton County is 34.0 births per 1,000 women. Women in the age bracket of 20 to 34 years have the highest fertility rate with 84.0 births per 1,000 women. Women in the age bracket of 20 to 34 years acount for 86.4% of all women with births.
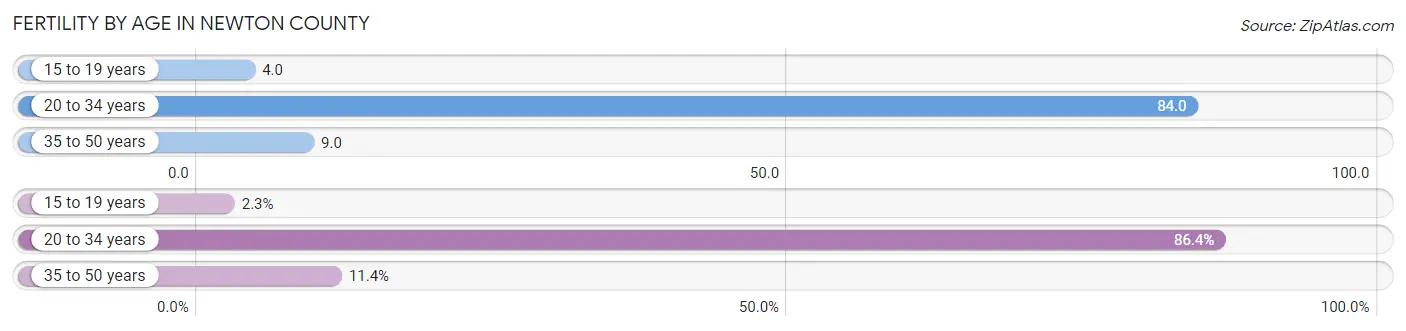
| Age Bracket | Women with Births | Births / 1,000 Women |
| 15 to 19 years | 1 (2.3%) | 4.0 |
| 20 to 34 years | 38 (86.4%) | 84.0 |
| 35 to 50 years | 5 (11.4%) | 9.0 |
| Total | 44 (100.0%) | 34.0 |
Fertility by Age by Marriage Status in Newton County
61.4% of women with births (44) in Newton County are married. The highest percentage of unmarried women with births falls into 35 to 50 years age bracket with 100.0% of them unmarried at the time of birth, while the lowest percentage of unmarried women with births belong to 15 to 19 years age bracket with 0.0% of them unmarried.
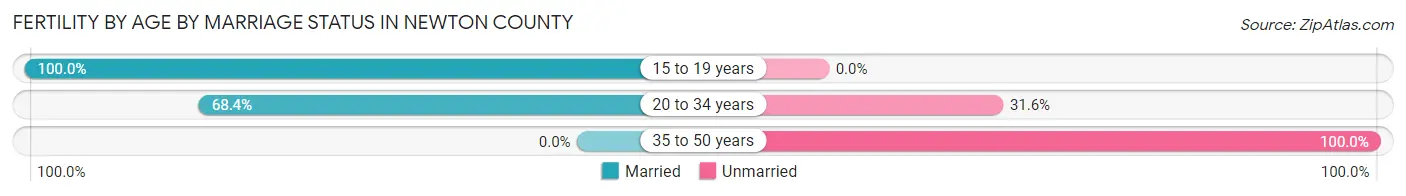
| Age Bracket | Married | Unmarried |
| 15 to 19 years | 1 (100.0%) | 0 (0.0%) |
| 20 to 34 years | 26 (68.4%) | 12 (31.6%) |
| 35 to 50 years | 0 (0.0%) | 5 (100.0%) |
| Total | 27 (61.4%) | 17 (38.6%) |
Fertility by Education in Newton County
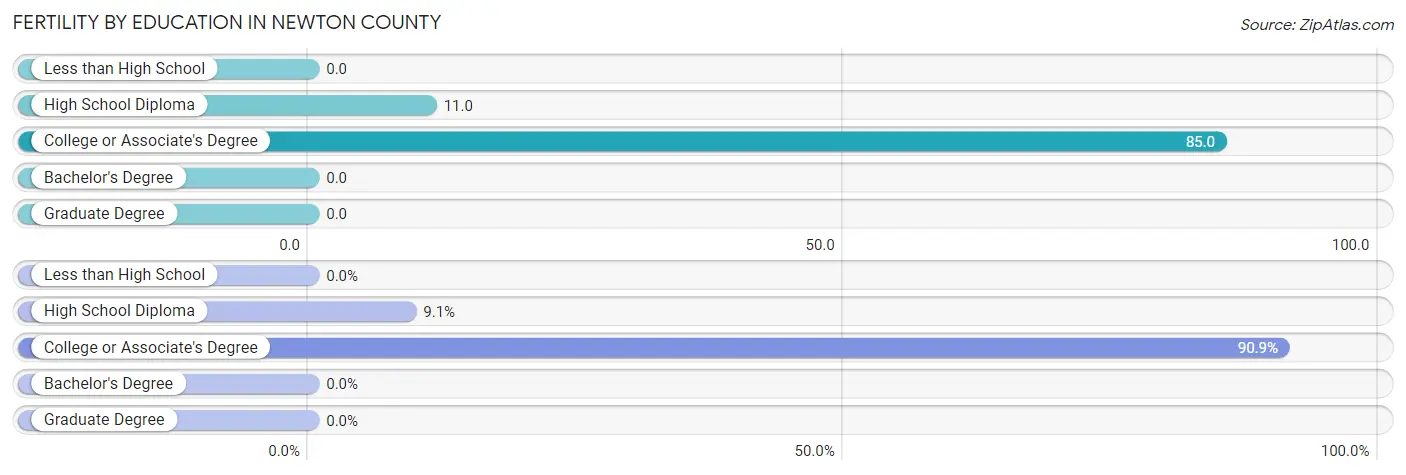
| Educational Attainment | Women with Births | Births / 1,000 Women |
| Less than High School | 0 (0.0%) | 0.0 |
| High School Diploma | 4 (9.1%) | 11.0 |
| College or Associate's Degree | 40 (90.9%) | 85.0 |
| Bachelor's Degree | 0 (0.0%) | 0.0 |
| Graduate Degree | 0 (0.0%) | 0.0 |
| Total | 44 (100.0%) | 34.0 |
Fertility by Education by Marriage Status in Newton County
38.6% of women with births in Newton County are unmarried. Women with the educational attainment of college or associate's degree are most likely to be married with 67.5% of them married at childbirth, while women with the educational attainment of high school diploma are least likely to be married with 100.0% of them unmarried at childbirth.
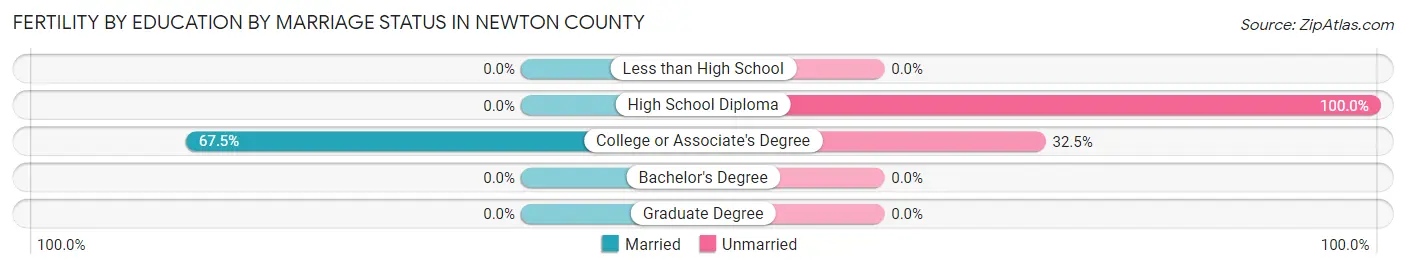
| Educational Attainment | Married | Unmarried |
| Less than High School | 0 (0.0%) | 0 (0.0%) |
| High School Diploma | 0 (0.0%) | 4 (100.0%) |
| College or Associate's Degree | 27 (67.5%) | 13 (32.5%) |
| Bachelor's Degree | 0 (0.0%) | 0 (0.0%) |
| Graduate Degree | 0 (0.0%) | 0 (0.0%) |
| Total | 27 (61.4%) | 17 (38.6%) |
Employment Characteristics in Newton County
Employment by Class of Employer in Newton County
Among the 2,785 employed individuals in Newton County, private company employees (1,719 | 61.7%), self-employed (not incorporated) (361 | 13.0%), and state government employees (281 | 10.1%) make up the most common classes of employment.
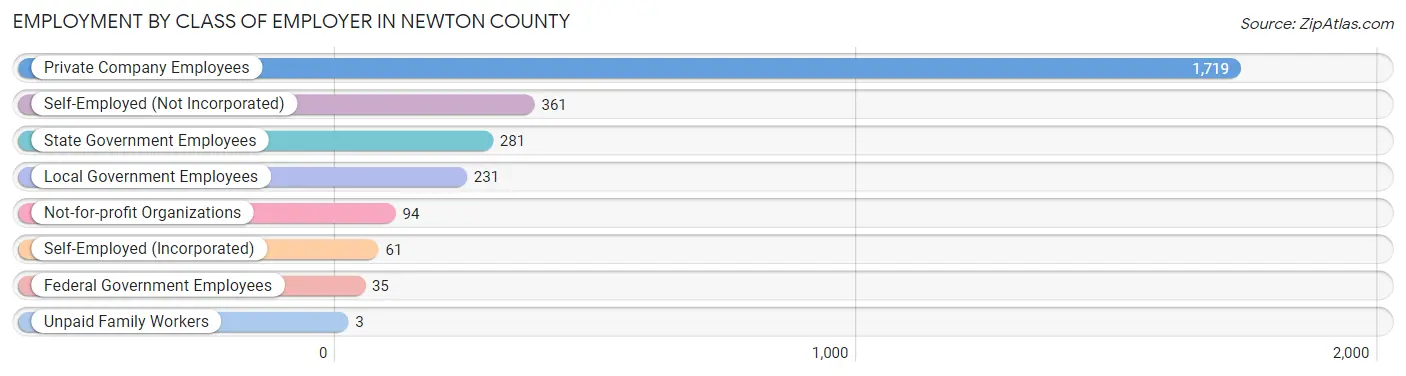
| Employer Class | # Employees | % Employees |
| Private Company Employees | 1,719 | 61.7% |
| Self-Employed (Incorporated) | 61 | 2.2% |
| Self-Employed (Not Incorporated) | 361 | 13.0% |
| Not-for-profit Organizations | 94 | 3.4% |
| Local Government Employees | 231 | 8.3% |
| State Government Employees | 281 | 10.1% |
| Federal Government Employees | 35 | 1.3% |
| Unpaid Family Workers | 3 | 0.1% |
| Total | 2,785 | 100.0% |
Employment Status by Age in Newton County
According to the labor force statistics for Newton County, out of the total population over 16 years of age (6,098), 49.6% or 3,025 individuals are in the labor force, with 3.8% or 115 of them unemployed. The age group with the highest labor force participation rate is 30 to 34 years, with 95.4% or 329 individuals in the labor force. Within the labor force, the 30 to 34 years age range has the highest percentage of unemployed individuals, with 18.8% or 62 of them being unemployed.
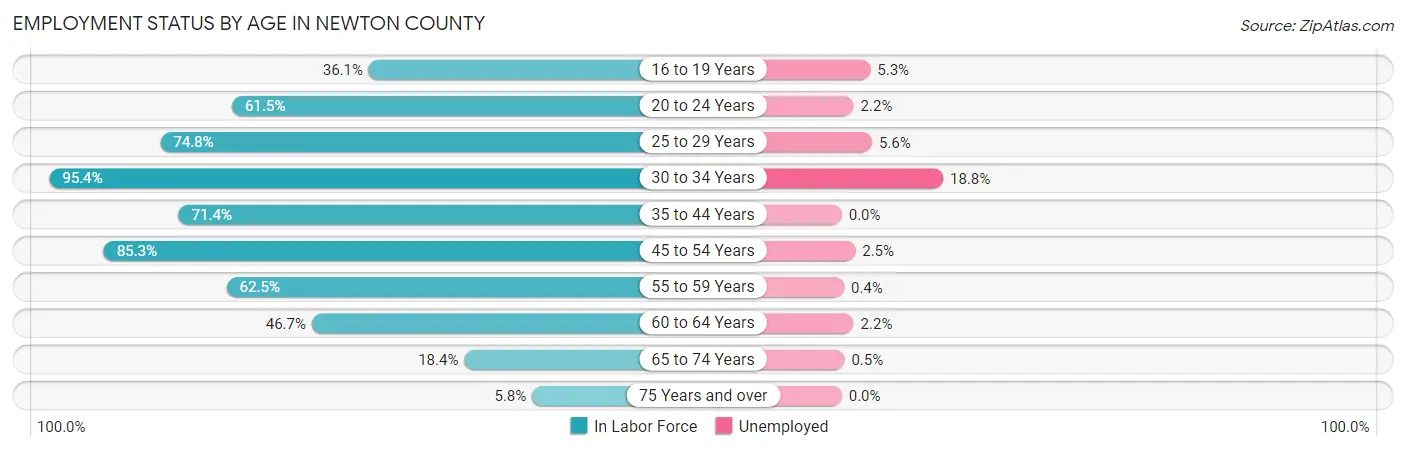
| Age Bracket | In Labor Force | Unemployed |
| 16 to 19 Years | 152 (36.1%) | 8 (5.3%) |
| 20 to 24 Years | 271 (61.5%) | 6 (2.2%) |
| 25 to 29 Years | 172 (74.8%) | 10 (5.6%) |
| 30 to 34 Years | 329 (95.4%) | 62 (18.8%) |
| 35 to 44 Years | 513 (71.4%) | 0 (0.0%) |
| 45 to 54 Years | 721 (85.3%) | 18 (2.5%) |
| 55 to 59 Years | 250 (62.5%) | 1 (0.4%) |
| 60 to 64 Years | 358 (46.7%) | 8 (2.2%) |
| 65 to 74 Years | 212 (18.4%) | 1 (0.5%) |
| 75 Years and over | 45 (5.8%) | 0 (0.0%) |
| Total | 3,025 (49.6%) | 115 (3.8%) |
Employment Status by Educational Attainment in Newton County
According to labor force statistics for Newton County, 70.9% of individuals (2,343) out of the total population between 25 and 64 years of age (3,305) are in the labor force, with 4.2% or 98 of them being unemployed. The group with the highest labor force participation rate are those with the educational attainment of bachelor's degree or higher, with 83.8% or 388 individuals in the labor force. Within the labor force, individuals with less than high school education have the highest percentage of unemployment, with 38.3% or 62 of them being unemployed.
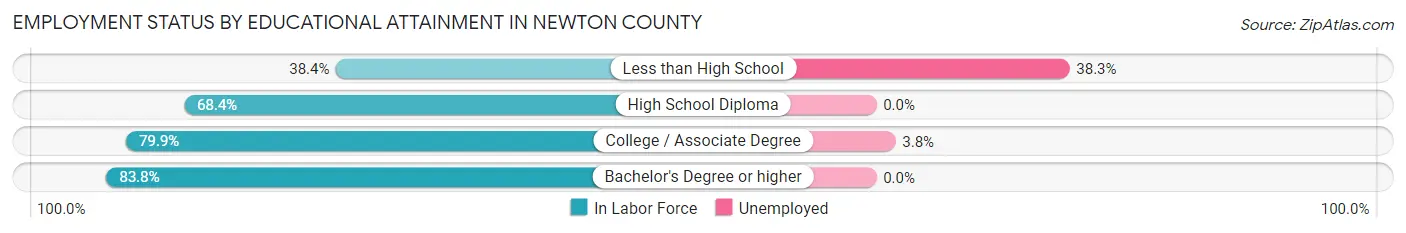
| Educational Attainment | In Labor Force | Unemployed |
| Less than High School | 162 (38.4%) | 162 (38.3%) |
| High School Diploma | 838 (68.4%) | 0 (0.0%) |
| College / Associate Degree | 955 (79.9%) | 45 (3.8%) |
| Bachelor's Degree or higher | 388 (83.8%) | 0 (0.0%) |
| Total | 2,343 (70.9%) | 139 (4.2%) |
Employment Occupations by Sex in Newton County
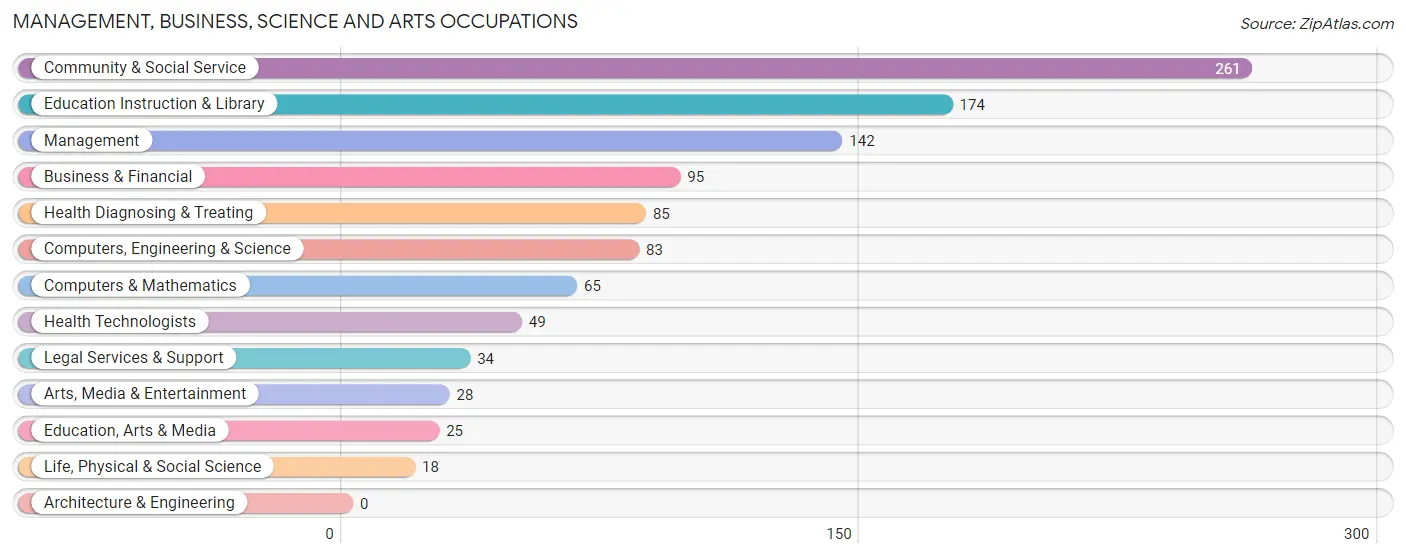
Management, Business, Science and Arts Occupations
The most common Management, Business, Science and Arts occupations in Newton County are Community & Social Service (261 | 9.0%), Education Instruction & Library (174 | 6.0%), Management (142 | 4.9%), Business & Financial (95 | 3.3%), and Health Diagnosing & Treating (85 | 2.9%).
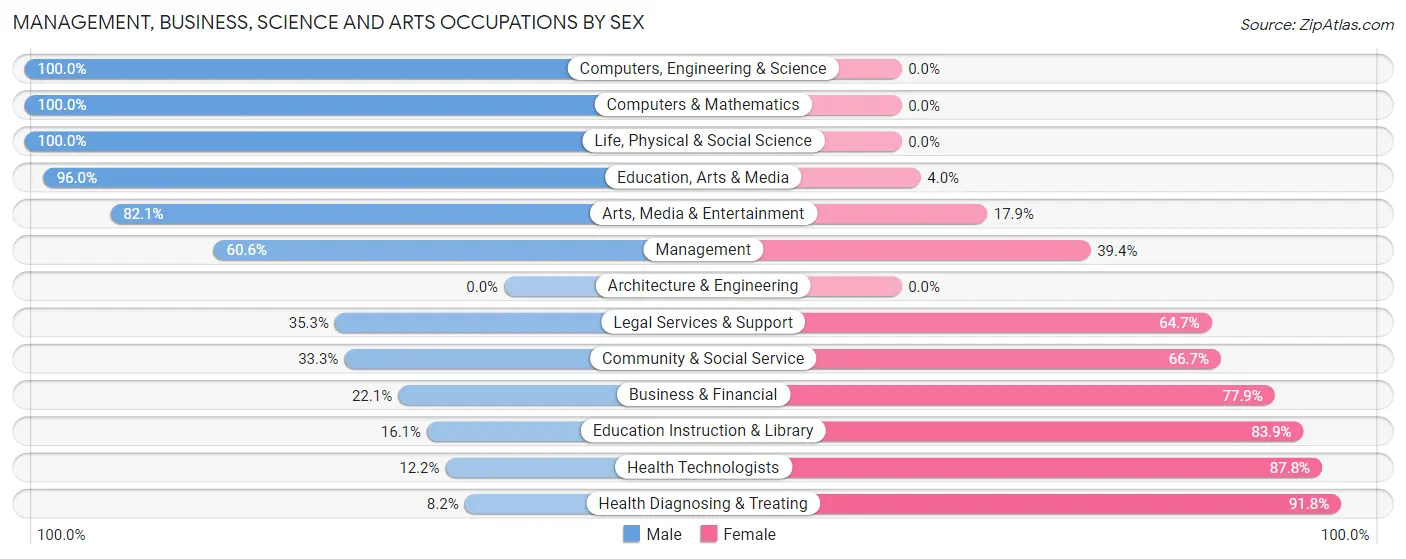
Management, Business, Science and Arts Occupations by Sex
Within the Management, Business, Science and Arts occupations in Newton County, the most male-oriented occupations are Computers, Engineering & Science (100.0%), Computers & Mathematics (100.0%), and Life, Physical & Social Science (100.0%), while the most female-oriented occupations are Health Diagnosing & Treating (91.8%), Health Technologists (87.8%), and Education Instruction & Library (83.9%).
| Occupation | Male | Female |
| Management | 86 (60.6%) | 56 (39.4%) |
| Business & Financial | 21 (22.1%) | 74 (77.9%) |
| Computers, Engineering & Science | 83 (100.0%) | 0 (0.0%) |
| Computers & Mathematics | 65 (100.0%) | 0 (0.0%) |
| Architecture & Engineering | 0 (0.0%) | 0 (0.0%) |
| Life, Physical & Social Science | 18 (100.0%) | 0 (0.0%) |
| Community & Social Service | 87 (33.3%) | 174 (66.7%) |
| Education, Arts & Media | 24 (96.0%) | 1 (4.0%) |
| Legal Services & Support | 12 (35.3%) | 22 (64.7%) |
| Education Instruction & Library | 28 (16.1%) | 146 (83.9%) |
| Arts, Media & Entertainment | 23 (82.1%) | 5 (17.9%) |
| Health Diagnosing & Treating | 7 (8.2%) | 78 (91.8%) |
| Health Technologists | 6 (12.2%) | 43 (87.8%) |
| Total (Category) | 284 (42.6%) | 382 (57.4%) |
| Total (Overall) | 1,666 (57.5%) | 1,232 (42.5%) |
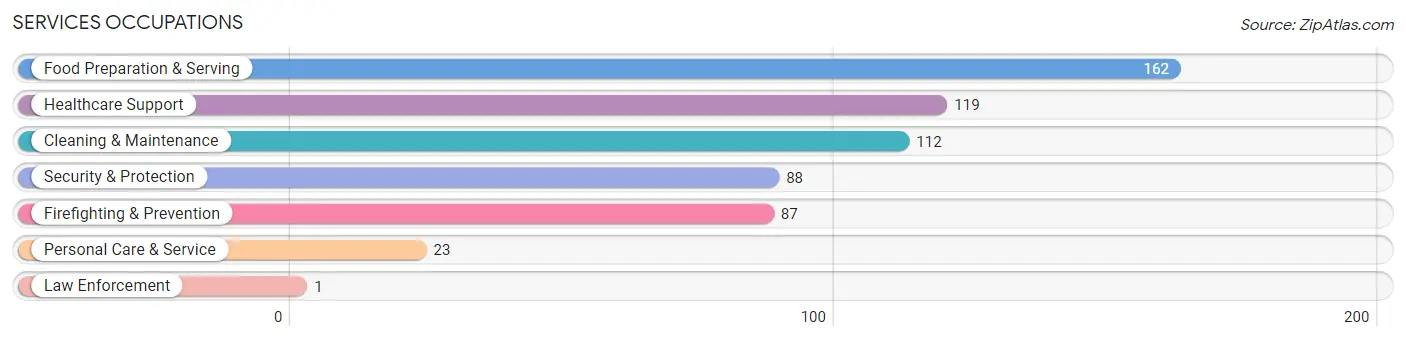
Services Occupations
The most common Services occupations in Newton County are Food Preparation & Serving (162 | 5.6%), Healthcare Support (119 | 4.1%), Cleaning & Maintenance (112 | 3.9%), Security & Protection (88 | 3.0%), and Firefighting & Prevention (87 | 3.0%).
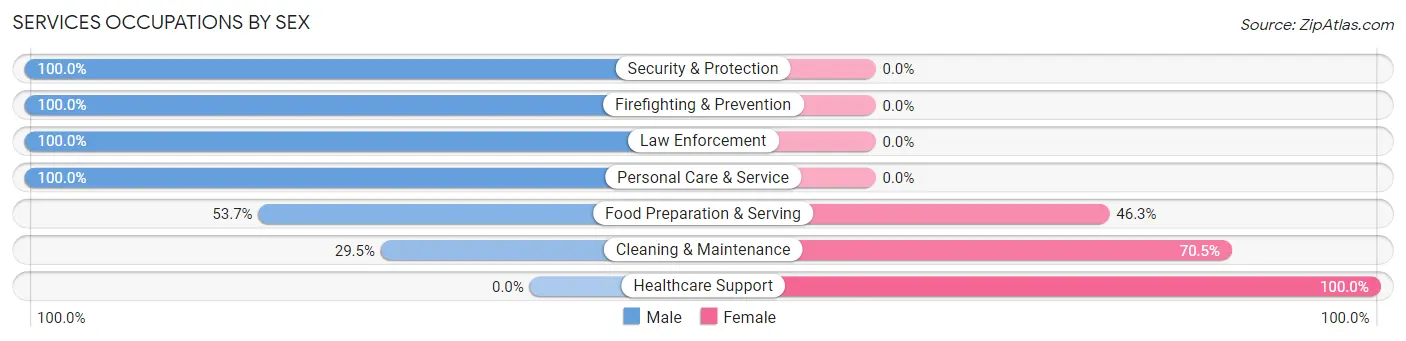
Services Occupations by Sex
Within the Services occupations in Newton County, the most male-oriented occupations are Security & Protection (100.0%), Firefighting & Prevention (100.0%), and Law Enforcement (100.0%), while the most female-oriented occupations are Healthcare Support (100.0%), Cleaning & Maintenance (70.5%), and Food Preparation & Serving (46.3%).
| Occupation | Male | Female |
| Healthcare Support | 0 (0.0%) | 119 (100.0%) |
| Security & Protection | 88 (100.0%) | 0 (0.0%) |
| Firefighting & Prevention | 87 (100.0%) | 0 (0.0%) |
| Law Enforcement | 1 (100.0%) | 0 (0.0%) |
| Food Preparation & Serving | 87 (53.7%) | 75 (46.3%) |
| Cleaning & Maintenance | 33 (29.5%) | 79 (70.5%) |
| Personal Care & Service | 23 (100.0%) | 0 (0.0%) |
| Total (Category) | 231 (45.8%) | 273 (54.2%) |
| Total (Overall) | 1,666 (57.5%) | 1,232 (42.5%) |
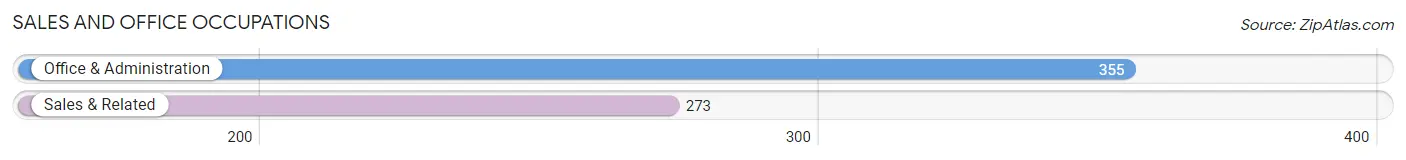
Sales and Office Occupations
The most common Sales and Office occupations in Newton County are Office & Administration (355 | 12.2%), and Sales & Related (273 | 9.4%).
Sales and Office Occupations by Sex
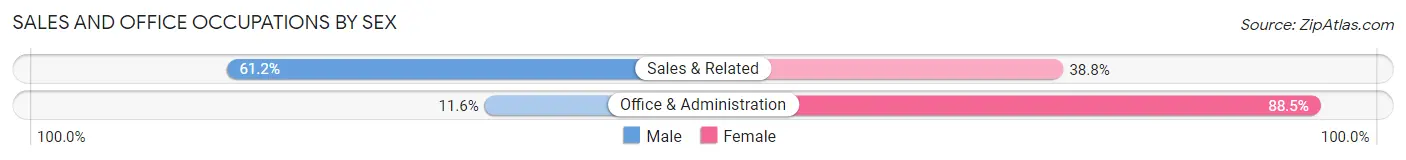
| Occupation | Male | Female |
| Sales & Related | 167 (61.2%) | 106 (38.8%) |
| Office & Administration | 41 (11.6%) | 314 (88.4%) |
| Total (Category) | 208 (33.1%) | 420 (66.9%) |
| Total (Overall) | 1,666 (57.5%) | 1,232 (42.5%) |
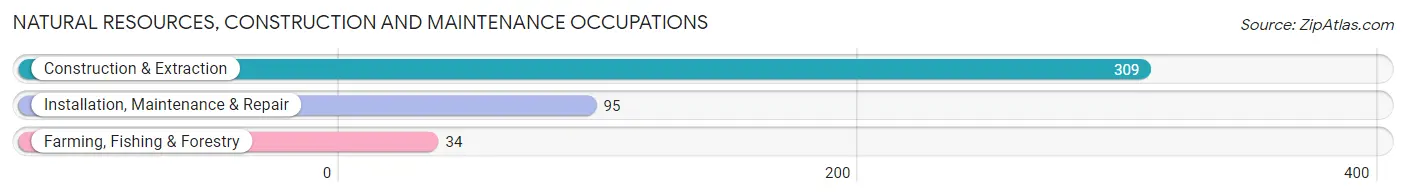
Natural Resources, Construction and Maintenance Occupations
The most common Natural Resources, Construction and Maintenance occupations in Newton County are Construction & Extraction (309 | 10.7%), Installation, Maintenance & Repair (95 | 3.3%), and Farming, Fishing & Forestry (34 | 1.2%).
Natural Resources, Construction and Maintenance Occupations by Sex
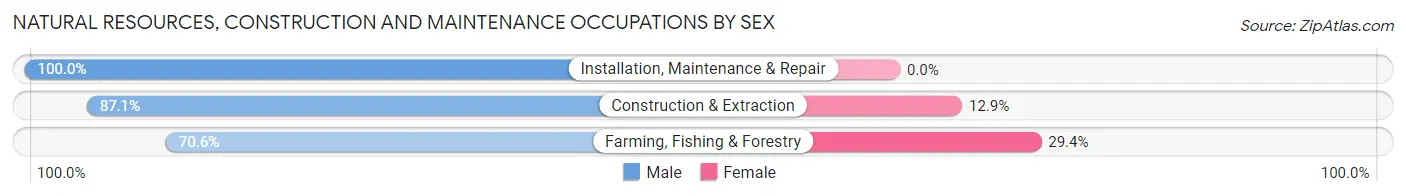
| Occupation | Male | Female |
| Farming, Fishing & Forestry | 24 (70.6%) | 10 (29.4%) |
| Construction & Extraction | 269 (87.1%) | 40 (12.9%) |
| Installation, Maintenance & Repair | 95 (100.0%) | 0 (0.0%) |
| Total (Category) | 388 (88.6%) | 50 (11.4%) |
| Total (Overall) | 1,666 (57.5%) | 1,232 (42.5%) |
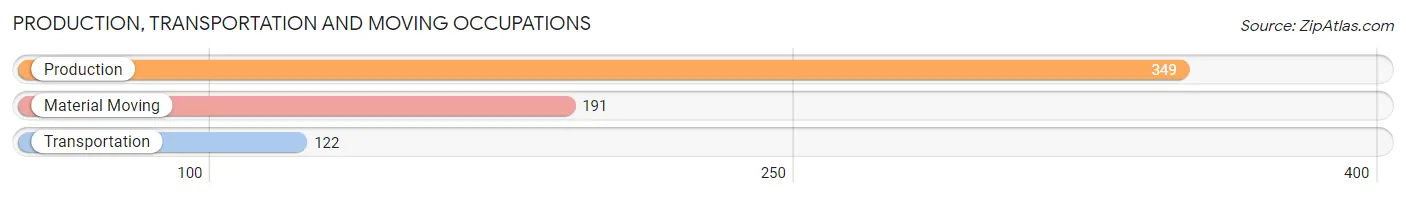
Production, Transportation and Moving Occupations
The most common Production, Transportation and Moving occupations in Newton County are Production (349 | 12.0%), Material Moving (191 | 6.6%), and Transportation (122 | 4.2%).
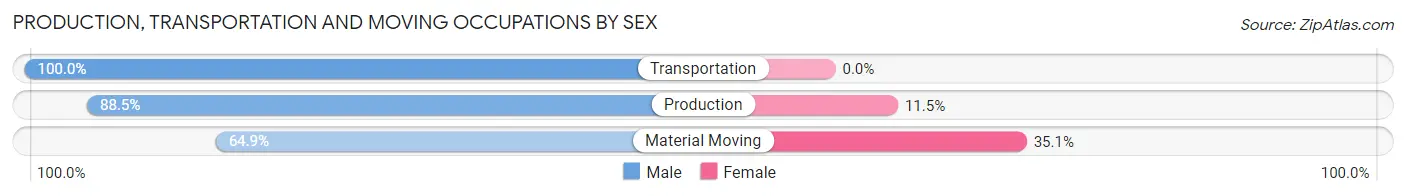
Production, Transportation and Moving Occupations by Sex
| Occupation | Male | Female |
| Production | 309 (88.5%) | 40 (11.5%) |
| Transportation | 122 (100.0%) | 0 (0.0%) |
| Material Moving | 124 (64.9%) | 67 (35.1%) |
| Total (Category) | 555 (83.8%) | 107 (16.2%) |
| Total (Overall) | 1,666 (57.5%) | 1,232 (42.5%) |
Employment Industries by Sex in Newton County
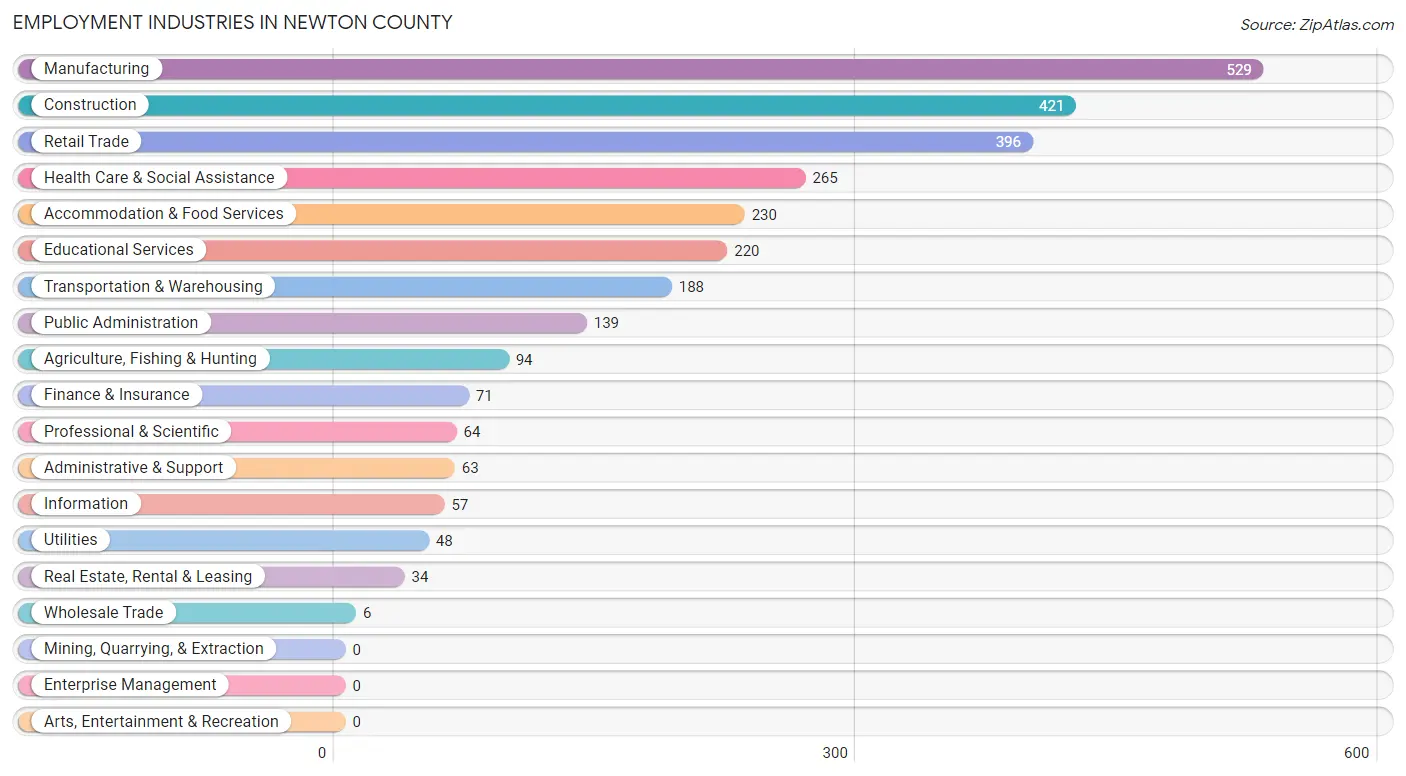
Employment Industries in Newton County
The major employment industries in Newton County include Manufacturing (529 | 18.2%), Construction (421 | 14.5%), Retail Trade (396 | 13.7%), Health Care & Social Assistance (265 | 9.1%), and Accommodation & Food Services (230 | 7.9%).
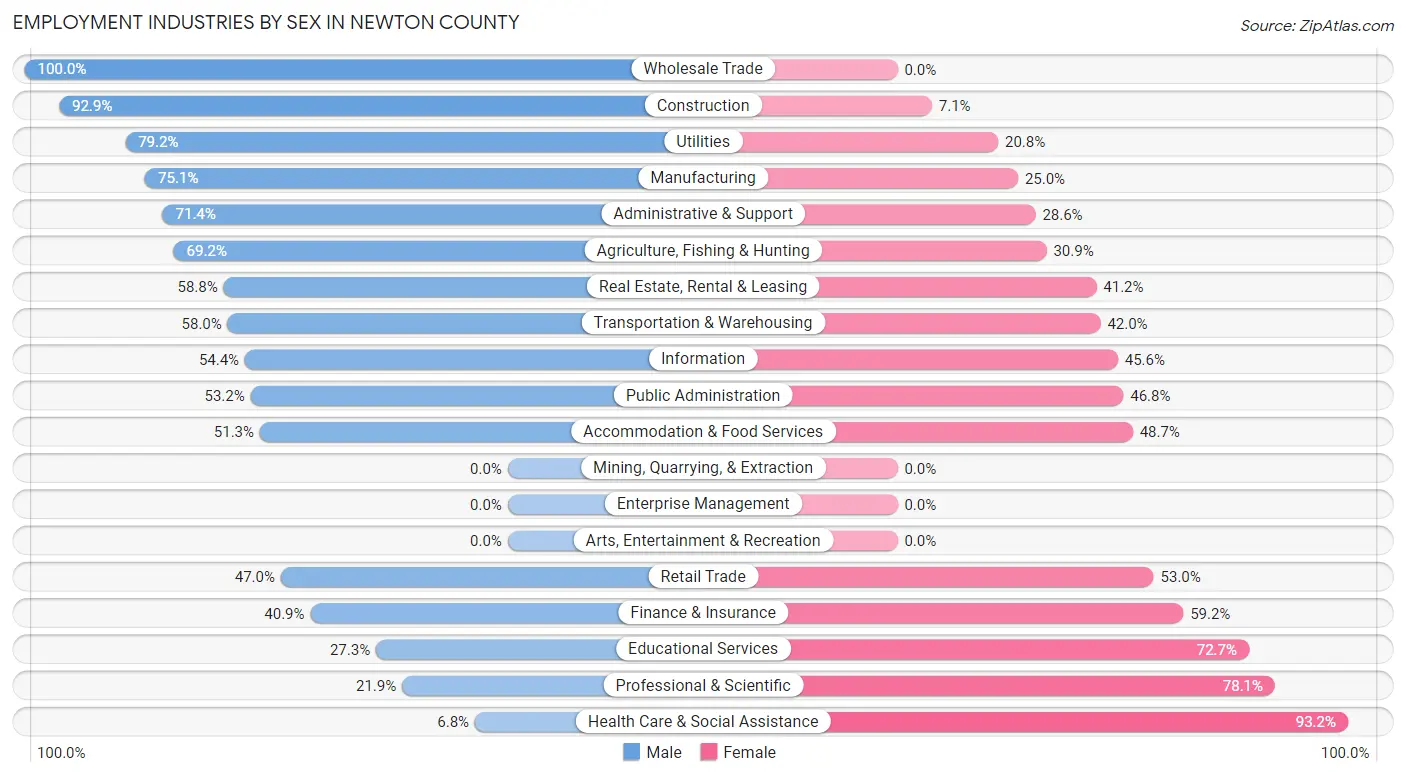
Employment Industries by Sex in Newton County
The Newton County industries that see more men than women are Wholesale Trade (100.0%), Construction (92.9%), and Utilities (79.2%), whereas the industries that tend to have a higher number of women are Health Care & Social Assistance (93.2%), Professional & Scientific (78.1%), and Educational Services (72.7%).
| Industry | Male | Female |
| Agriculture, Fishing & Hunting | 65 (69.2%) | 29 (30.8%) |
| Mining, Quarrying, & Extraction | 0 (0.0%) | 0 (0.0%) |
| Construction | 391 (92.9%) | 30 (7.1%) |
| Manufacturing | 397 (75.0%) | 132 (24.9%) |
| Wholesale Trade | 6 (100.0%) | 0 (0.0%) |
| Retail Trade | 186 (47.0%) | 210 (53.0%) |
| Transportation & Warehousing | 109 (58.0%) | 79 (42.0%) |
| Utilities | 38 (79.2%) | 10 (20.8%) |
| Information | 31 (54.4%) | 26 (45.6%) |
| Finance & Insurance | 29 (40.8%) | 42 (59.2%) |
| Real Estate, Rental & Leasing | 20 (58.8%) | 14 (41.2%) |
| Professional & Scientific | 14 (21.9%) | 50 (78.1%) |
| Enterprise Management | 0 (0.0%) | 0 (0.0%) |
| Administrative & Support | 45 (71.4%) | 18 (28.6%) |
| Educational Services | 60 (27.3%) | 160 (72.7%) |
| Health Care & Social Assistance | 18 (6.8%) | 247 (93.2%) |
| Arts, Entertainment & Recreation | 0 (0.0%) | 0 (0.0%) |
| Accommodation & Food Services | 118 (51.3%) | 112 (48.7%) |
| Public Administration | 74 (53.2%) | 65 (46.8%) |
| Total | 1,666 (57.5%) | 1,232 (42.5%) |
Education in Newton County
School Enrollment in Newton County
The most common levels of schooling among the 1,194 students in Newton County are middle school (329 | 27.6%), high school (266 | 22.3%), and elementary school (199 | 16.7%).
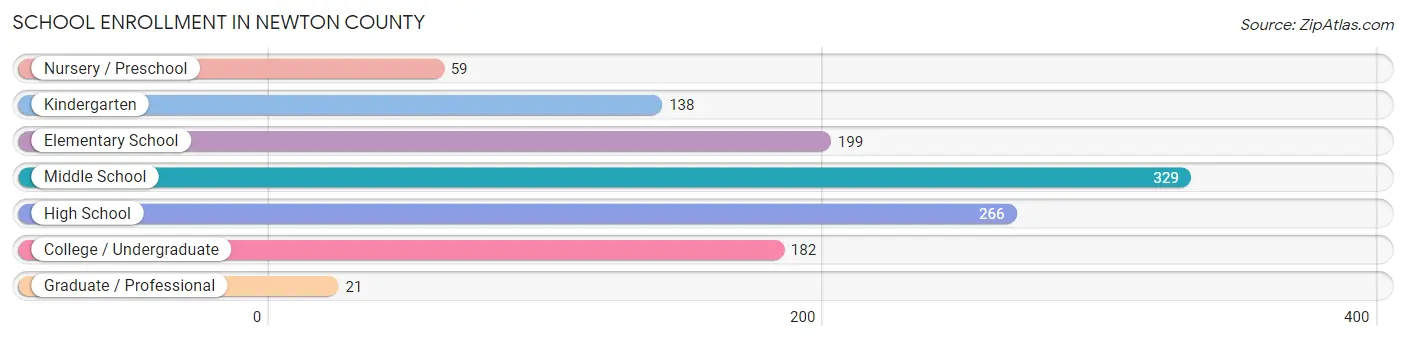
| School Level | # Students | % Students |
| Nursery / Preschool | 59 | 4.9% |
| Kindergarten | 138 | 11.6% |
| Elementary School | 199 | 16.7% |
| Middle School | 329 | 27.6% |
| High School | 266 | 22.3% |
| College / Undergraduate | 182 | 15.2% |
| Graduate / Professional | 21 | 1.8% |
| Total | 1,194 | 100.0% |
School Enrollment by Age by Funding Source in Newton County
Out of a total of 1,194 students who are enrolled in schools in Newton County, 215 (18.0%) attend a private institution, while the remaining 979 (82.0%) are enrolled in public schools. The age group of 25 to 34 year olds has the highest likelihood of being enrolled in private schools, with 8 (25.0% in the age bracket) enrolled. Conversely, the age group of 3 to 4 year olds has the lowest likelihood of being enrolled in a private school, with 46 (100.0% in the age bracket) attending a public institution.
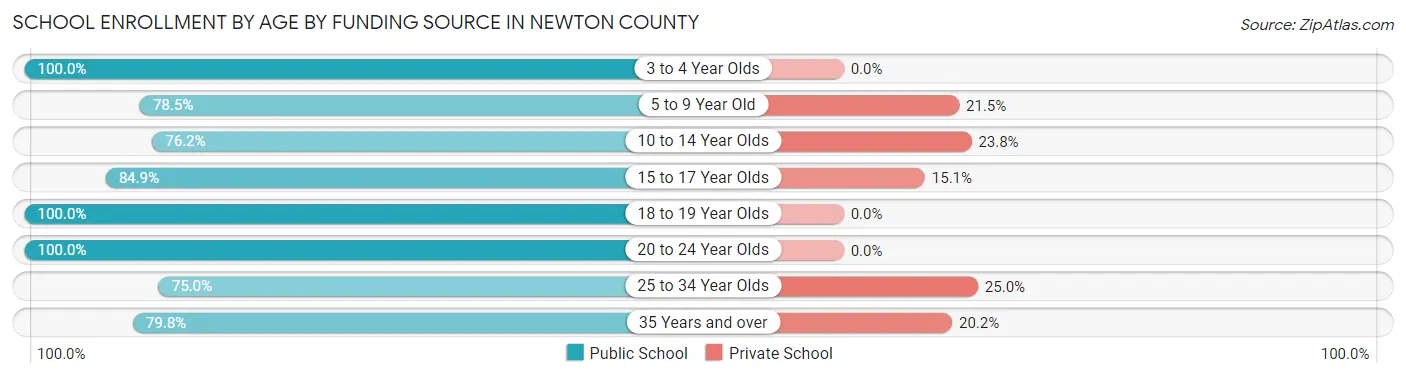
| Age Bracket | Public School | Private School |
| 3 to 4 Year Olds | 46 (100.0%) | 0 (0.0%) |
| 5 to 9 Year Old | 241 (78.5%) | 66 (21.5%) |
| 10 to 14 Year Olds | 253 (76.2%) | 79 (23.8%) |
| 15 to 17 Year Olds | 219 (84.9%) | 39 (15.1%) |
| 18 to 19 Year Olds | 95 (100.0%) | 0 (0.0%) |
| 20 to 24 Year Olds | 10 (100.0%) | 0 (0.0%) |
| 25 to 34 Year Olds | 24 (75.0%) | 8 (25.0%) |
| 35 Years and over | 91 (79.8%) | 23 (20.2%) |
| Total | 979 (82.0%) | 215 (18.0%) |
Educational Attainment by Field of Study in Newton County
Education (213 | 26.7%), bio, nature & agricultural (126 | 15.8%), business (108 | 13.5%), science & technology (97 | 12.2%), and psychology (45 | 5.6%) are the most common fields of study among 798 individuals in Newton County who have obtained a bachelor's degree or higher.
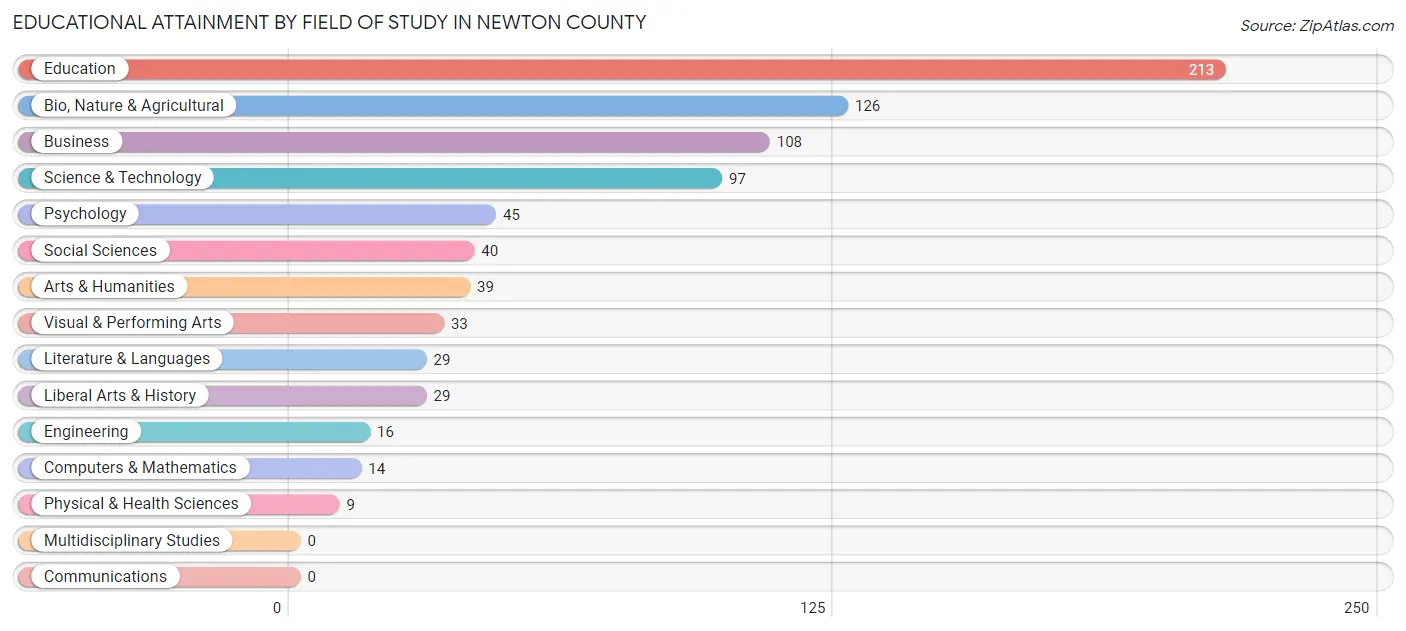
| Field of Study | # Graduates | % Graduates |
| Computers & Mathematics | 14 | 1.8% |
| Bio, Nature & Agricultural | 126 | 15.8% |
| Physical & Health Sciences | 9 | 1.1% |
| Psychology | 45 | 5.6% |
| Social Sciences | 40 | 5.0% |
| Engineering | 16 | 2.0% |
| Multidisciplinary Studies | 0 | 0.0% |
| Science & Technology | 97 | 12.2% |
| Business | 108 | 13.5% |
| Education | 213 | 26.7% |
| Literature & Languages | 29 | 3.6% |
| Liberal Arts & History | 29 | 3.6% |
| Visual & Performing Arts | 33 | 4.1% |
| Communications | 0 | 0.0% |
| Arts & Humanities | 39 | 4.9% |
| Total | 798 | 100.0% |
Transportation & Commute in Newton County
Vehicle Availability by Sex in Newton County
The most prevalent vehicle ownership categories in Newton County are males with 3 vehicles (675, accounting for 41.0%) and females with 3 vehicles (334, making up 59.3%).
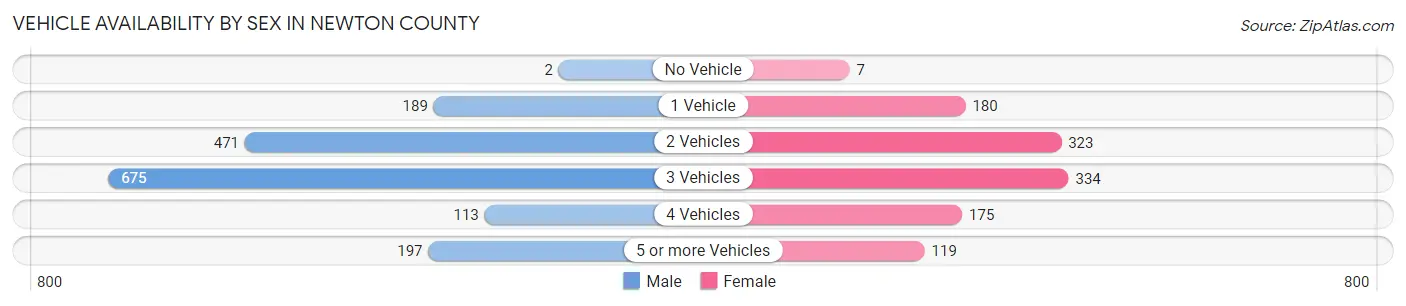
| Vehicles Available | Male | Female |
| No Vehicle | 2 (0.1%) | 7 (0.6%) |
| 1 Vehicle | 189 (11.5%) | 180 (15.8%) |
| 2 Vehicles | 471 (28.6%) | 323 (28.4%) |
| 3 Vehicles | 675 (41.0%) | 334 (29.3%) |
| 4 Vehicles | 113 (6.9%) | 175 (15.4%) |
| 5 or more Vehicles | 197 (12.0%) | 119 (10.5%) |
| Total | 1,647 (100.0%) | 1,138 (100.0%) |
Commute Time in Newton County
The most frequently occuring commute durations in Newton County are 30 to 34 minutes (552 commuters, 23.6%), 45 to 59 minutes (492 commuters, 21.1%), and 20 to 24 minutes (274 commuters, 11.7%).
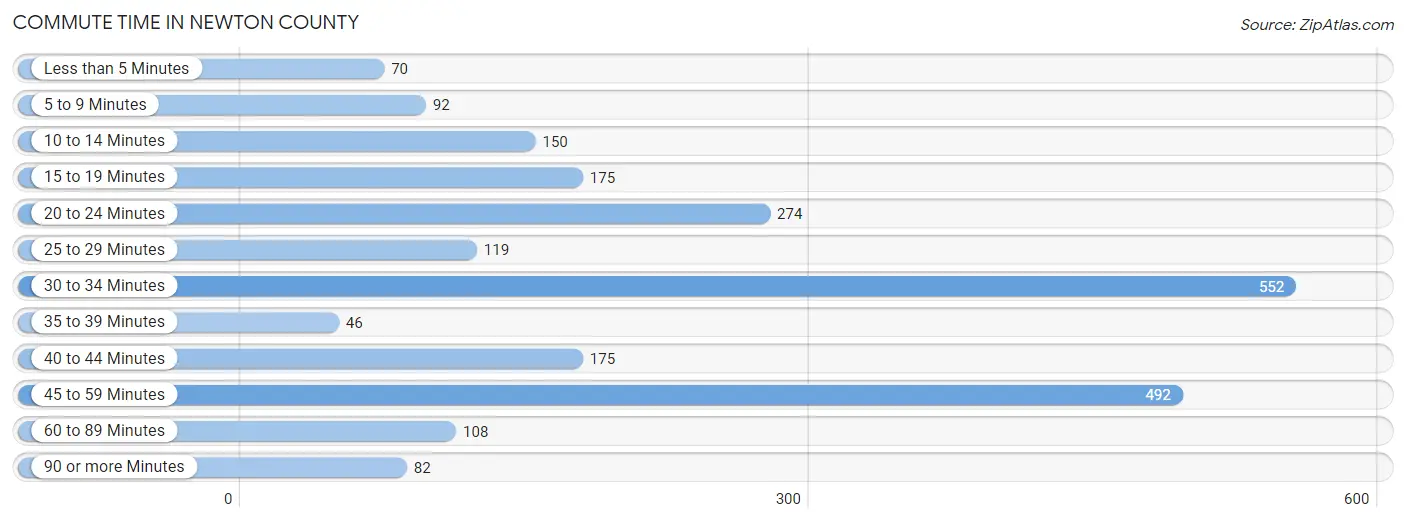
| Commute Time | # Commuters | % Commuters |
| Less than 5 Minutes | 70 | 3.0% |
| 5 to 9 Minutes | 92 | 3.9% |
| 10 to 14 Minutes | 150 | 6.4% |
| 15 to 19 Minutes | 175 | 7.5% |
| 20 to 24 Minutes | 274 | 11.7% |
| 25 to 29 Minutes | 119 | 5.1% |
| 30 to 34 Minutes | 552 | 23.6% |
| 35 to 39 Minutes | 46 | 2.0% |
| 40 to 44 Minutes | 175 | 7.5% |
| 45 to 59 Minutes | 492 | 21.1% |
| 60 to 89 Minutes | 108 | 4.6% |
| 90 or more Minutes | 82 | 3.5% |
Commute Time by Sex in Newton County
The most common commute times in Newton County are 30 to 34 minutes (304 commuters, 23.2%) for males and 45 to 59 minutes (315 commuters, 30.8%) for females.
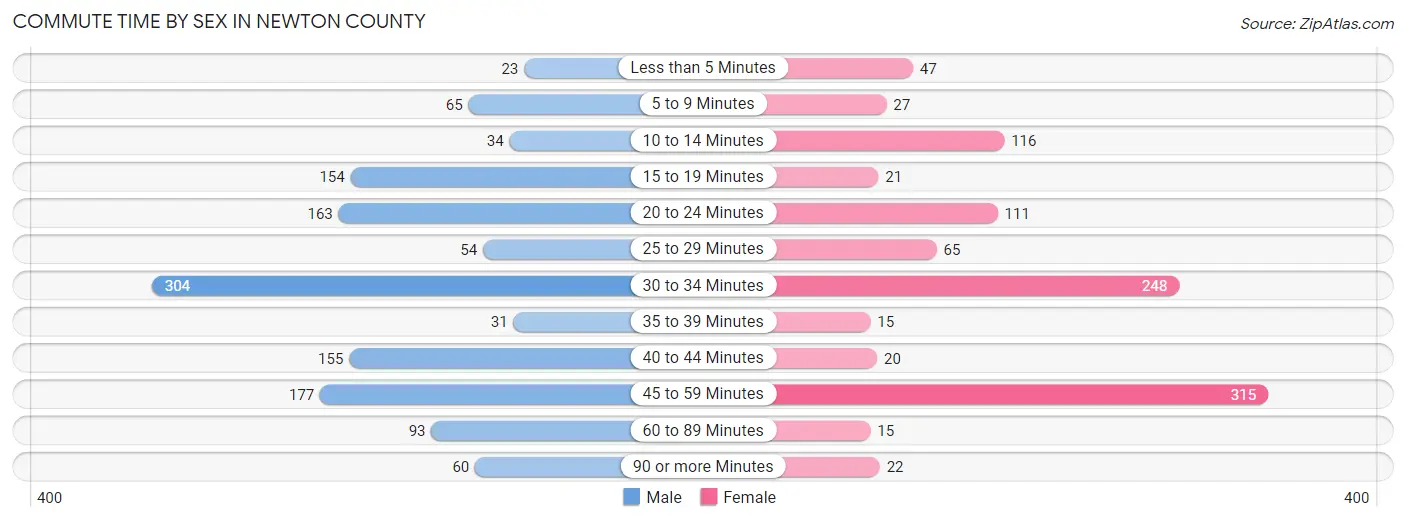
| Commute Time | Male | Female |
| Less than 5 Minutes | 23 (1.8%) | 47 (4.6%) |
| 5 to 9 Minutes | 65 (5.0%) | 27 (2.6%) |
| 10 to 14 Minutes | 34 (2.6%) | 116 (11.4%) |
| 15 to 19 Minutes | 154 (11.7%) | 21 (2.1%) |
| 20 to 24 Minutes | 163 (12.4%) | 111 (10.9%) |
| 25 to 29 Minutes | 54 (4.1%) | 65 (6.4%) |
| 30 to 34 Minutes | 304 (23.2%) | 248 (24.3%) |
| 35 to 39 Minutes | 31 (2.4%) | 15 (1.5%) |
| 40 to 44 Minutes | 155 (11.8%) | 20 (2.0%) |
| 45 to 59 Minutes | 177 (13.5%) | 315 (30.8%) |
| 60 to 89 Minutes | 93 (7.1%) | 15 (1.5%) |
| 90 or more Minutes | 60 (4.6%) | 22 (2.1%) |
Time of Departure to Work by Sex in Newton County
The most frequent times of departure to work in Newton County are 7:00 AM to 7:29 AM (279, 21.2%) for males and 7:00 AM to 7:29 AM (245, 24.0%) for females.
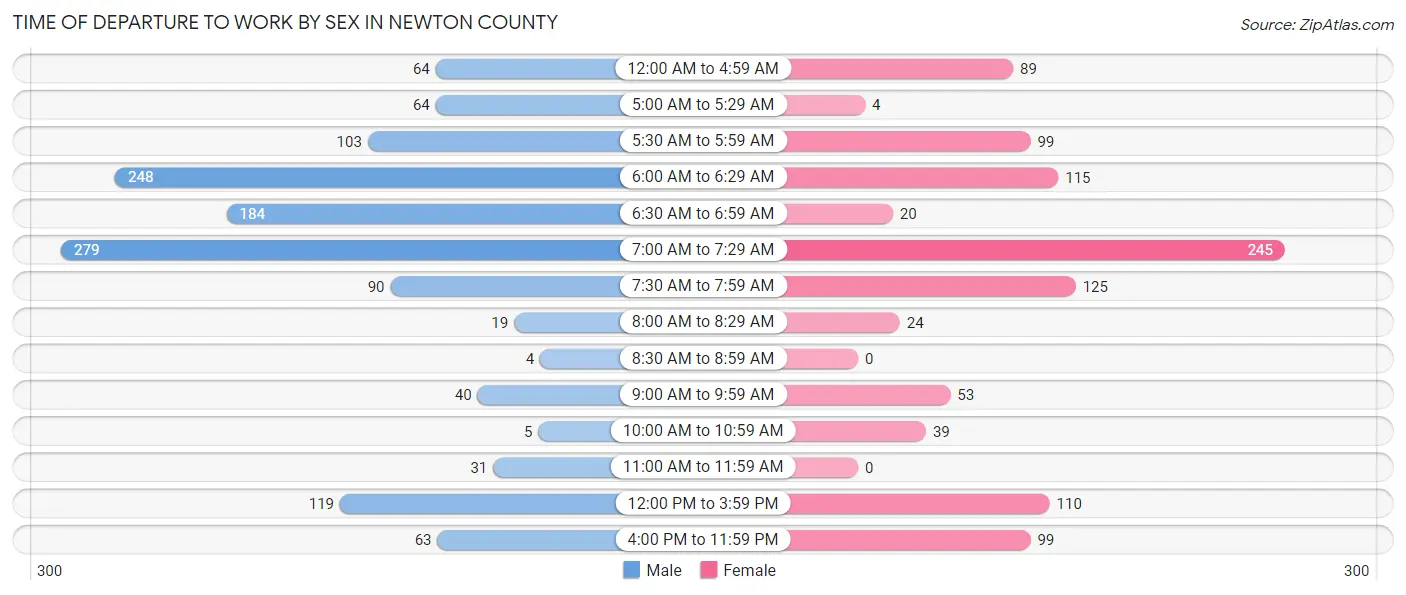
| Time of Departure | Male | Female |
| 12:00 AM to 4:59 AM | 64 (4.9%) | 89 (8.7%) |
| 5:00 AM to 5:29 AM | 64 (4.9%) | 4 (0.4%) |
| 5:30 AM to 5:59 AM | 103 (7.8%) | 99 (9.7%) |
| 6:00 AM to 6:29 AM | 248 (18.9%) | 115 (11.3%) |
| 6:30 AM to 6:59 AM | 184 (14.0%) | 20 (2.0%) |
| 7:00 AM to 7:29 AM | 279 (21.2%) | 245 (24.0%) |
| 7:30 AM to 7:59 AM | 90 (6.9%) | 125 (12.2%) |
| 8:00 AM to 8:29 AM | 19 (1.5%) | 24 (2.4%) |
| 8:30 AM to 8:59 AM | 4 (0.3%) | 0 (0.0%) |
| 9:00 AM to 9:59 AM | 40 (3.0%) | 53 (5.2%) |
| 10:00 AM to 10:59 AM | 5 (0.4%) | 39 (3.8%) |
| 11:00 AM to 11:59 AM | 31 (2.4%) | 0 (0.0%) |
| 12:00 PM to 3:59 PM | 119 (9.1%) | 110 (10.8%) |
| 4:00 PM to 11:59 PM | 63 (4.8%) | 99 (9.7%) |
| Total | 1,313 (100.0%) | 1,022 (100.0%) |
Housing Occupancy in Newton County
Occupancy by Ownership in Newton County
Of the total 2,905 dwellings in Newton County, owner-occupied units account for 2,172 (74.8%), while renter-occupied units make up 733 (25.2%).
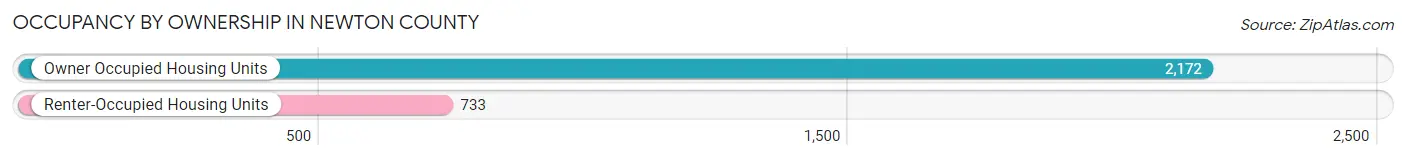
| Occupancy | # Housing Units | % Housing Units |
| Owner Occupied Housing Units | 2,172 | 74.8% |
| Renter-Occupied Housing Units | 733 | 25.2% |
| Total Occupied Housing Units | 2,905 | 100.0% |
Occupancy by Household Size in Newton County
| Household Size | # Housing Units | % Housing Units |
| 1-Person Household | 843 | 29.0% |
| 2-Person Household | 1,329 | 45.8% |
| 3-Person Household | 393 | 13.5% |
| 4+ Person Household | 340 | 11.7% |
| Total Housing Units | 2,905 | 100.0% |
Occupancy by Ownership by Household Size in Newton County
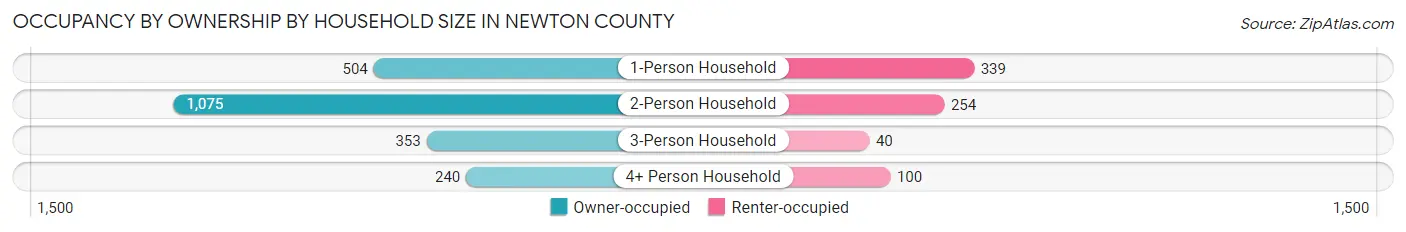
| Household Size | Owner-occupied | Renter-occupied |
| 1-Person Household | 504 (59.8%) | 339 (40.2%) |
| 2-Person Household | 1,075 (80.9%) | 254 (19.1%) |
| 3-Person Household | 353 (89.8%) | 40 (10.2%) |
| 4+ Person Household | 240 (70.6%) | 100 (29.4%) |
| Total Housing Units | 2,172 (74.8%) | 733 (25.2%) |
Occupancy by Educational Attainment in Newton County
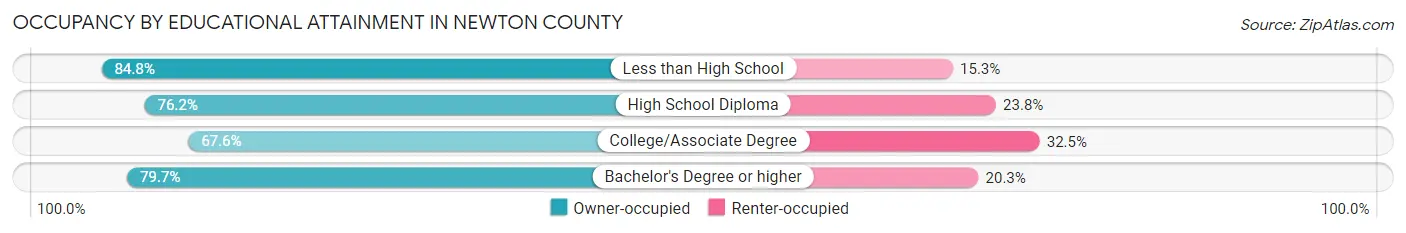
| Household Size | Owner-occupied | Renter-occupied |
| Less than High School | 400 (84.8%) | 72 (15.2%) |
| High School Diploma | 647 (76.2%) | 202 (23.8%) |
| College/Associate Degree | 764 (67.5%) | 367 (32.5%) |
| Bachelor's Degree or higher | 361 (79.7%) | 92 (20.3%) |
Occupancy by Age of Householder in Newton County
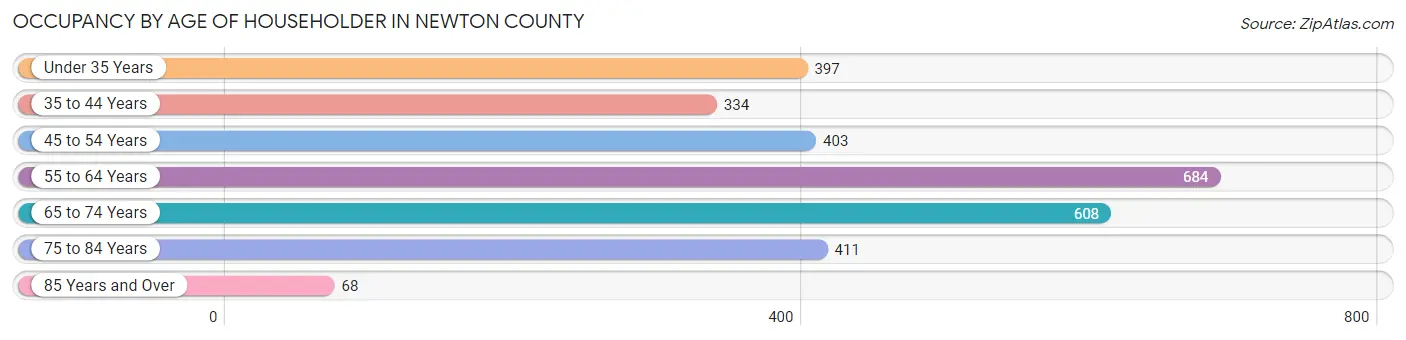
| Age Bracket | # Households | % Households |
| Under 35 Years | 397 | 13.7% |
| 35 to 44 Years | 334 | 11.5% |
| 45 to 54 Years | 403 | 13.9% |
| 55 to 64 Years | 684 | 23.5% |
| 65 to 74 Years | 608 | 20.9% |
| 75 to 84 Years | 411 | 14.1% |
| 85 Years and Over | 68 | 2.3% |
| Total | 2,905 | 100.0% |
Housing Finances in Newton County
Median Income by Occupancy in Newton County
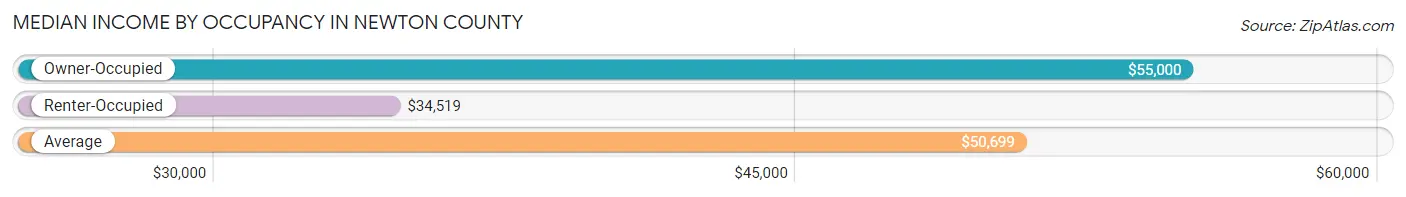
| Occupancy Type | # Households | Median Income |
| Owner-Occupied | 2,172 (74.8%) | $55,000 |
| Renter-Occupied | 733 (25.2%) | $34,519 |
| Average | 2,905 (100.0%) | $50,699 |
Occupancy by Householder Income Bracket in Newton County
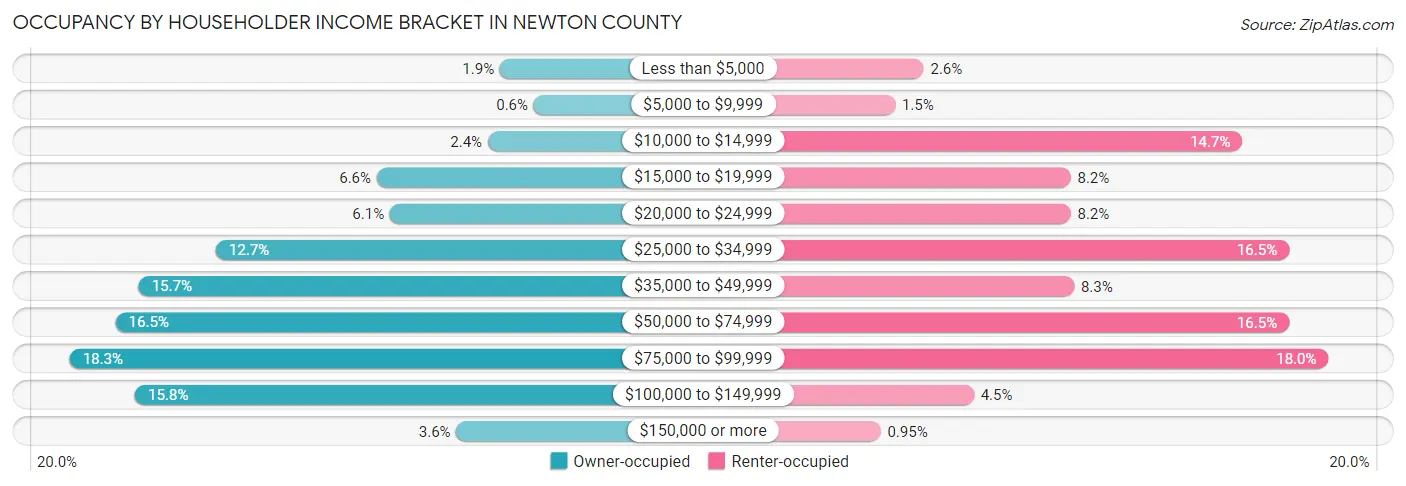
| Income Bracket | Owner-occupied | Renter-occupied |
| Less than $5,000 | 41 (1.9%) | 19 (2.6%) |
| $5,000 to $9,999 | 13 (0.6%) | 11 (1.5%) |
| $10,000 to $14,999 | 51 (2.4%) | 108 (14.7%) |
| $15,000 to $19,999 | 143 (6.6%) | 60 (8.2%) |
| $20,000 to $24,999 | 132 (6.1%) | 60 (8.2%) |
| $25,000 to $34,999 | 276 (12.7%) | 121 (16.5%) |
| $35,000 to $49,999 | 340 (15.7%) | 61 (8.3%) |
| $50,000 to $74,999 | 359 (16.5%) | 121 (16.5%) |
| $75,000 to $99,999 | 397 (18.3%) | 132 (18.0%) |
| $100,000 to $149,999 | 343 (15.8%) | 33 (4.5%) |
| $150,000 or more | 77 (3.5%) | 7 (0.9%) |
| Total | 2,172 (100.0%) | 733 (100.0%) |
Monthly Housing Cost Tiers in Newton County
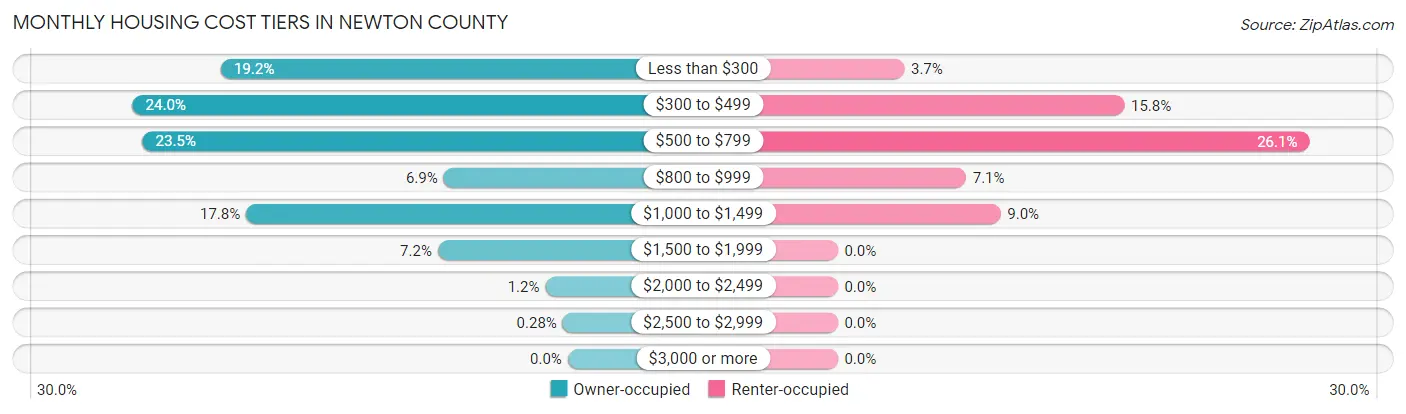
| Monthly Cost | Owner-occupied | Renter-occupied |
| Less than $300 | 416 (19.2%) | 27 (3.7%) |
| $300 to $499 | 522 (24.0%) | 116 (15.8%) |
| $500 to $799 | 510 (23.5%) | 191 (26.1%) |
| $800 to $999 | 149 (6.9%) | 52 (7.1%) |
| $1,000 to $1,499 | 386 (17.8%) | 66 (9.0%) |
| $1,500 to $1,999 | 156 (7.2%) | 0 (0.0%) |
| $2,000 to $2,499 | 27 (1.2%) | 0 (0.0%) |
| $2,500 to $2,999 | 6 (0.3%) | 0 (0.0%) |
| $3,000 or more | 0 (0.0%) | 0 (0.0%) |
| Total | 2,172 (100.0%) | 733 (100.0%) |
Physical Housing Characteristics in Newton County
Housing Structures in Newton County
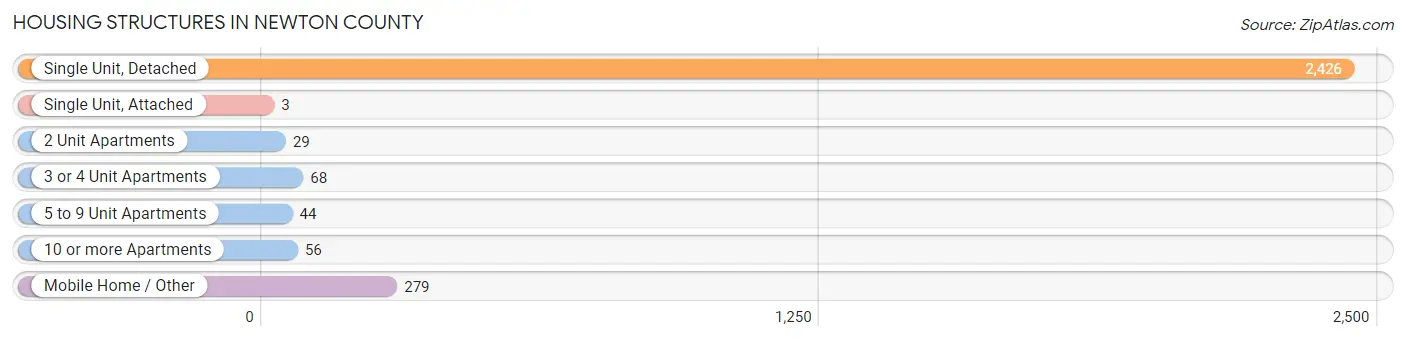
| Structure Type | # Housing Units | % Housing Units |
| Single Unit, Detached | 2,426 | 83.5% |
| Single Unit, Attached | 3 | 0.1% |
| 2 Unit Apartments | 29 | 1.0% |
| 3 or 4 Unit Apartments | 68 | 2.3% |
| 5 to 9 Unit Apartments | 44 | 1.5% |
| 10 or more Apartments | 56 | 1.9% |
| Mobile Home / Other | 279 | 9.6% |
| Total | 2,905 | 100.0% |
Housing Structures by Occupancy in Newton County
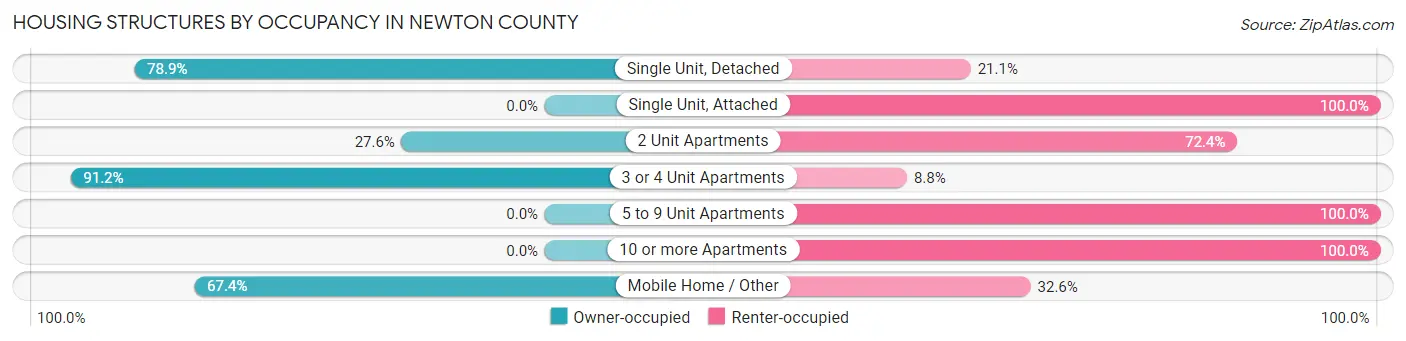
| Structure Type | Owner-occupied | Renter-occupied |
| Single Unit, Detached | 1,914 (78.9%) | 512 (21.1%) |
| Single Unit, Attached | 0 (0.0%) | 3 (100.0%) |
| 2 Unit Apartments | 8 (27.6%) | 21 (72.4%) |
| 3 or 4 Unit Apartments | 62 (91.2%) | 6 (8.8%) |
| 5 to 9 Unit Apartments | 0 (0.0%) | 44 (100.0%) |
| 10 or more Apartments | 0 (0.0%) | 56 (100.0%) |
| Mobile Home / Other | 188 (67.4%) | 91 (32.6%) |
| Total | 2,172 (74.8%) | 733 (25.2%) |
Housing Structures by Number of Rooms in Newton County
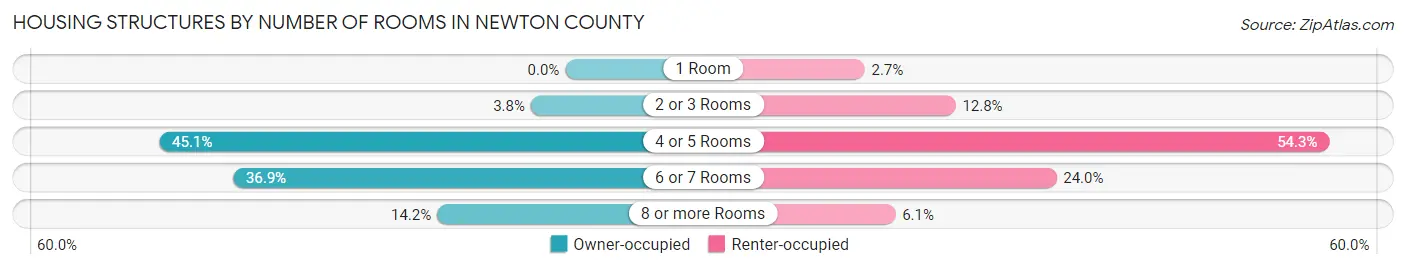
| Number of Rooms | Owner-occupied | Renter-occupied |
| 1 Room | 0 (0.0%) | 20 (2.7%) |
| 2 or 3 Rooms | 83 (3.8%) | 94 (12.8%) |
| 4 or 5 Rooms | 979 (45.1%) | 398 (54.3%) |
| 6 or 7 Rooms | 801 (36.9%) | 176 (24.0%) |
| 8 or more Rooms | 309 (14.2%) | 45 (6.1%) |
| Total | 2,172 (100.0%) | 733 (100.0%) |
Housing Structure by Heating Type in Newton County
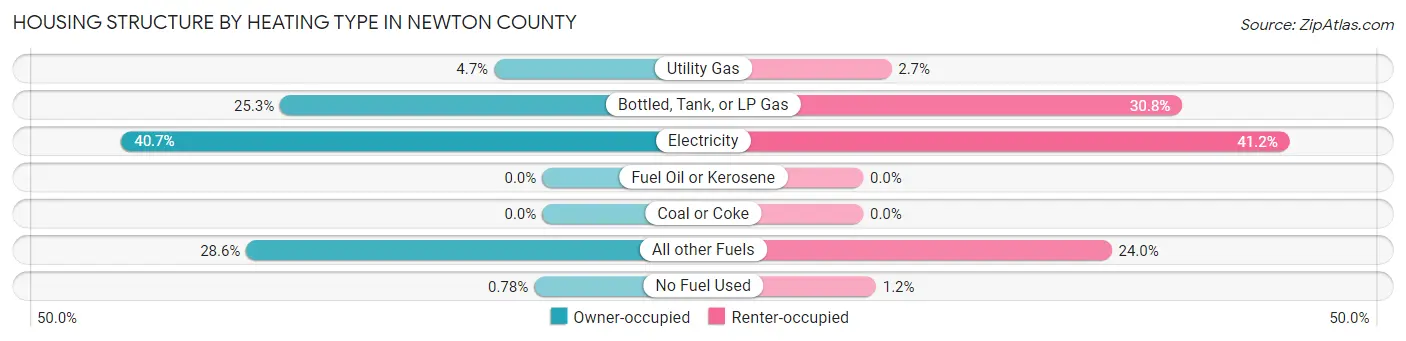
| Heating Type | Owner-occupied | Renter-occupied |
| Utility Gas | 101 (4.6%) | 20 (2.7%) |
| Bottled, Tank, or LP Gas | 550 (25.3%) | 226 (30.8%) |
| Electricity | 883 (40.6%) | 302 (41.2%) |
| Fuel Oil or Kerosene | 0 (0.0%) | 0 (0.0%) |
| Coal or Coke | 0 (0.0%) | 0 (0.0%) |
| All other Fuels | 621 (28.6%) | 176 (24.0%) |
| No Fuel Used | 17 (0.8%) | 9 (1.2%) |
| Total | 2,172 (100.0%) | 733 (100.0%) |
Household Vehicle Usage in Newton County
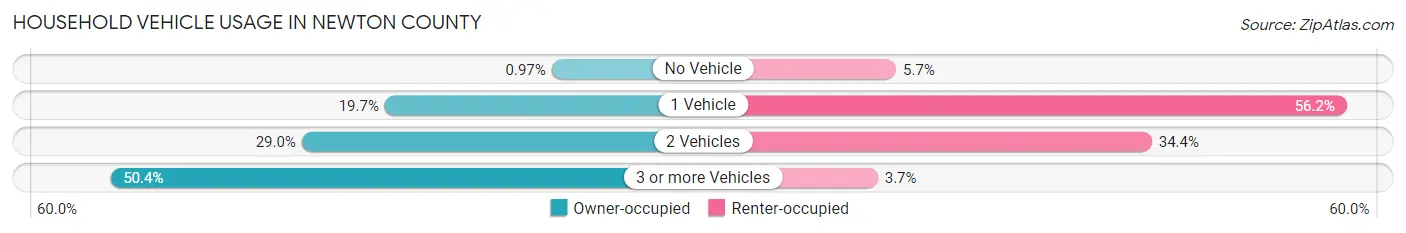
| Vehicles per Household | Owner-occupied | Renter-occupied |
| No Vehicle | 21 (1.0%) | 42 (5.7%) |
| 1 Vehicle | 427 (19.7%) | 412 (56.2%) |
| 2 Vehicles | 629 (29.0%) | 252 (34.4%) |
| 3 or more Vehicles | 1,095 (50.4%) | 27 (3.7%) |
| Total | 2,172 (100.0%) | 733 (100.0%) |
Real Estate & Mortgages in Newton County
Real Estate and Mortgage Overview in Newton County
| Characteristic | Without Mortgage | With Mortgage |
| Housing Units | 1,213 | 959 |
| Median Property Value | $124,200 | $184,700 |
| Median Household Income | $49,185 | $39 |
| Monthly Housing Costs | $349 | $0 |
| Real Estate Taxes | $549 | $57 |
Property Value by Mortgage Status in Newton County
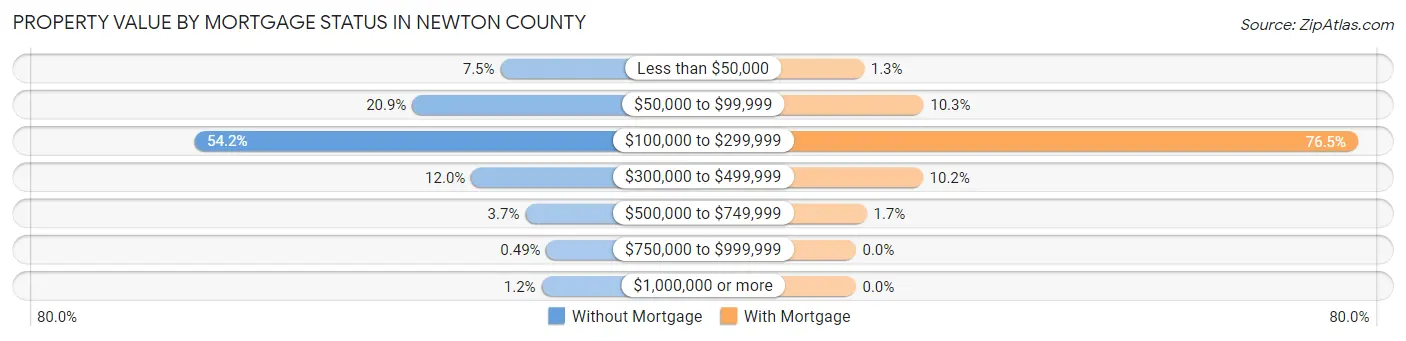
| Property Value | Without Mortgage | With Mortgage |
| Less than $50,000 | 91 (7.5%) | 12 (1.3%) |
| $50,000 to $99,999 | 254 (20.9%) | 99 (10.3%) |
| $100,000 to $299,999 | 657 (54.2%) | 734 (76.5%) |
| $300,000 to $499,999 | 145 (11.9%) | 98 (10.2%) |
| $500,000 to $749,999 | 45 (3.7%) | 16 (1.7%) |
| $750,000 to $999,999 | 6 (0.5%) | 0 (0.0%) |
| $1,000,000 or more | 15 (1.2%) | 0 (0.0%) |
| Total | 1,213 (100.0%) | 959 (100.0%) |
Household Income by Mortgage Status in Newton County
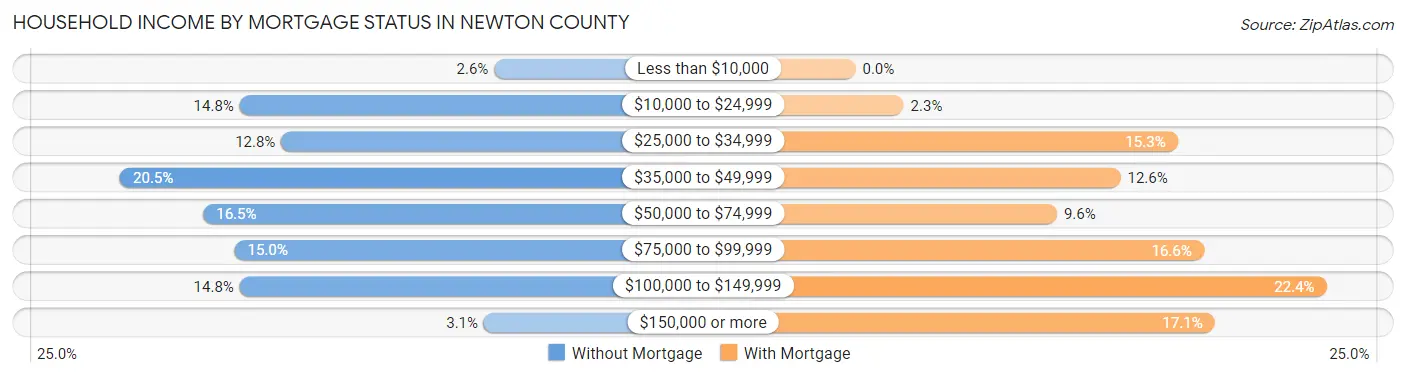
| Household Income | Without Mortgage | With Mortgage |
| Less than $10,000 | 32 (2.6%) | 0 (0.0%) |
| $10,000 to $24,999 | 179 (14.8%) | 22 (2.3%) |
| $25,000 to $34,999 | 155 (12.8%) | 147 (15.3%) |
| $35,000 to $49,999 | 248 (20.4%) | 121 (12.6%) |
| $50,000 to $74,999 | 200 (16.5%) | 92 (9.6%) |
| $75,000 to $99,999 | 182 (15.0%) | 159 (16.6%) |
| $100,000 to $149,999 | 179 (14.8%) | 215 (22.4%) |
| $150,000 or more | 38 (3.1%) | 164 (17.1%) |
| Total | 1,213 (100.0%) | 959 (100.0%) |
Property Value to Household Income Ratio in Newton County
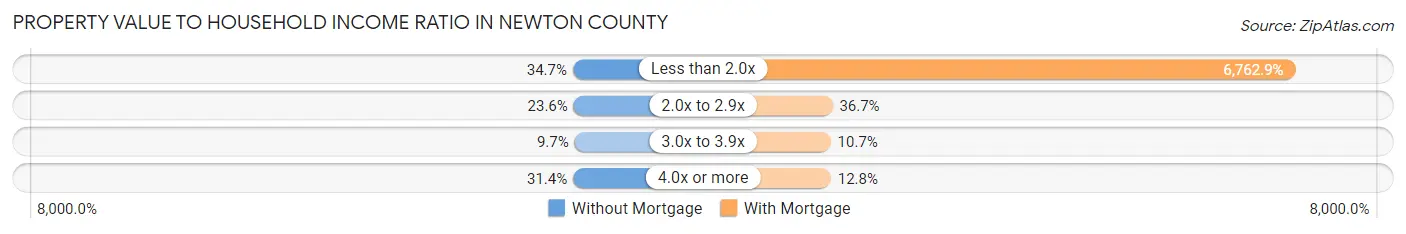
| Value-to-Income Ratio | Without Mortgage | With Mortgage |
| Less than 2.0x | 421 (34.7%) | 64,856 (6,762.9%) |
| 2.0x to 2.9x | 286 (23.6%) | 352 (36.7%) |
| 3.0x to 3.9x | 118 (9.7%) | 103 (10.7%) |
| 4.0x or more | 381 (31.4%) | 123 (12.8%) |
| Total | 1,213 (100.0%) | 959 (100.0%) |
Real Estate Taxes by Mortgage Status in Newton County
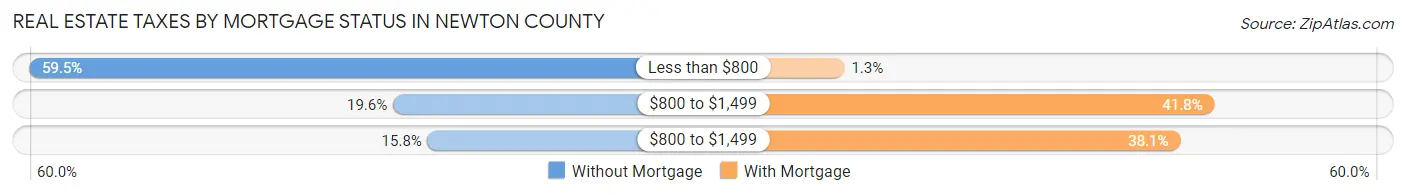
| Property Taxes | Without Mortgage | With Mortgage |
| Less than $800 | 722 (59.5%) | 12 (1.3%) |
| $800 to $1,499 | 238 (19.6%) | 401 (41.8%) |
| $800 to $1,499 | 192 (15.8%) | 365 (38.1%) |
| Total | 1,213 (100.0%) | 959 (100.0%) |
Health & Disability in Newton County
Health Insurance Coverage by Age in Newton County
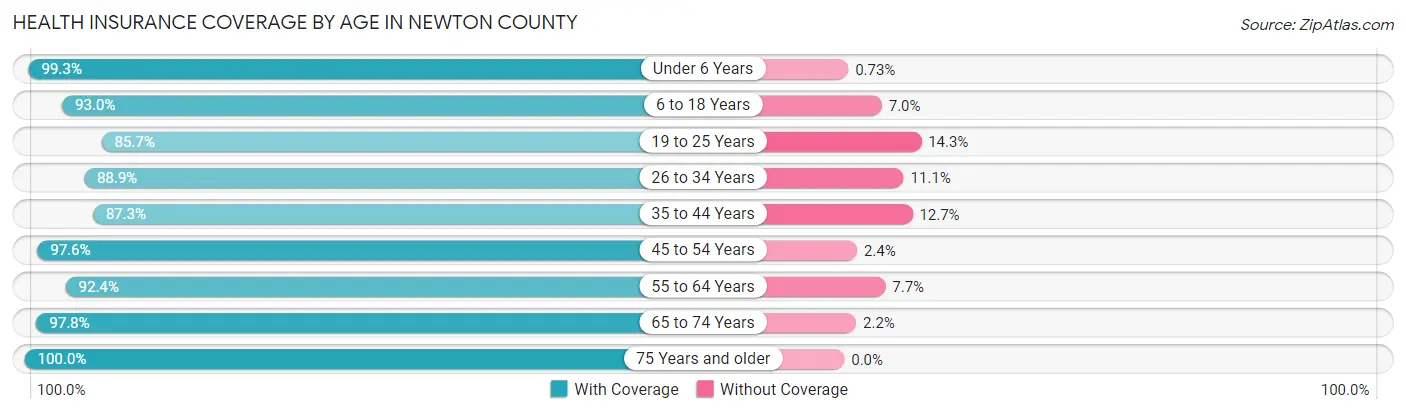
| Age Bracket | With Coverage | Without Coverage |
| Under 6 Years | 410 (99.3%) | 3 (0.7%) |
| 6 to 18 Years | 1,025 (93.0%) | 77 (7.0%) |
| 19 to 25 Years | 424 (85.7%) | 71 (14.3%) |
| 26 to 34 Years | 498 (88.9%) | 62 (11.1%) |
| 35 to 44 Years | 618 (87.3%) | 90 (12.7%) |
| 45 to 54 Years | 825 (97.6%) | 20 (2.4%) |
| 55 to 64 Years | 1,074 (92.3%) | 89 (7.6%) |
| 65 to 74 Years | 1,109 (97.8%) | 25 (2.2%) |
| 75 Years and older | 737 (100.0%) | 0 (0.0%) |
| Total | 6,720 (93.9%) | 437 (6.1%) |
Health Insurance Coverage by Citizenship Status in Newton County
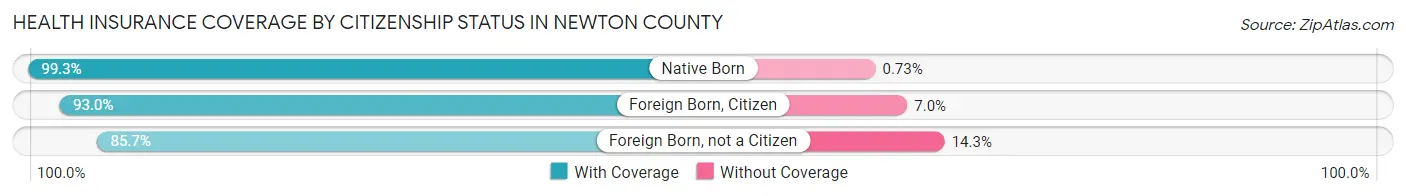
| Citizenship Status | With Coverage | Without Coverage |
| Native Born | 410 (99.3%) | 3 (0.7%) |
| Foreign Born, Citizen | 1,025 (93.0%) | 77 (7.0%) |
| Foreign Born, not a Citizen | 424 (85.7%) | 71 (14.3%) |
Health Insurance Coverage by Household Income in Newton County
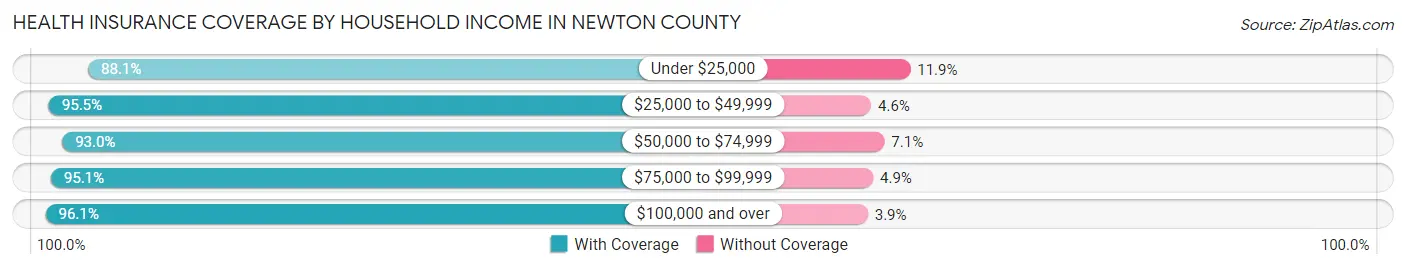
| Household Income | With Coverage | Without Coverage |
| Under $25,000 | 962 (88.1%) | 130 (11.9%) |
| $25,000 to $49,999 | 1,470 (95.5%) | 70 (4.5%) |
| $50,000 to $74,999 | 1,278 (92.9%) | 97 (7.0%) |
| $75,000 to $99,999 | 1,544 (95.1%) | 80 (4.9%) |
| $100,000 and over | 1,466 (96.1%) | 60 (3.9%) |
Public vs Private Health Insurance Coverage by Age in Newton County
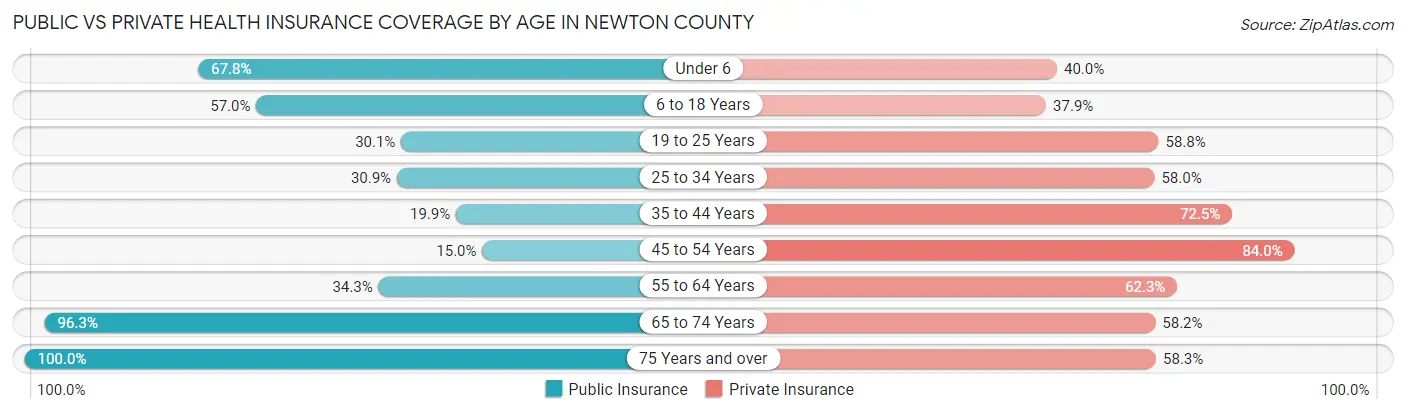
| Age Bracket | Public Insurance | Private Insurance |
| Under 6 | 280 (67.8%) | 165 (40.0%) |
| 6 to 18 Years | 628 (57.0%) | 418 (37.9%) |
| 19 to 25 Years | 149 (30.1%) | 291 (58.8%) |
| 25 to 34 Years | 173 (30.9%) | 325 (58.0%) |
| 35 to 44 Years | 141 (19.9%) | 513 (72.5%) |
| 45 to 54 Years | 127 (15.0%) | 710 (84.0%) |
| 55 to 64 Years | 399 (34.3%) | 724 (62.3%) |
| 65 to 74 Years | 1,092 (96.3%) | 660 (58.2%) |
| 75 Years and over | 737 (100.0%) | 430 (58.3%) |
| Total | 3,726 (52.1%) | 4,236 (59.2%) |
Disability Status by Sex by Age in Newton County
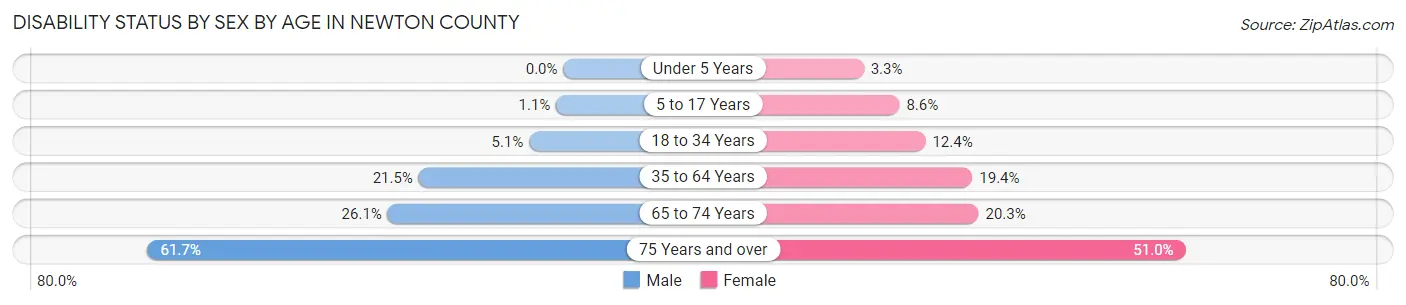
| Age Bracket | Male | Female |
| Under 5 Years | 0 (0.0%) | 5 (3.3%) |
| 5 to 17 Years | 6 (1.1%) | 45 (8.6%) |
| 18 to 34 Years | 30 (5.1%) | 71 (12.4%) |
| 35 to 64 Years | 302 (21.5%) | 254 (19.4%) |
| 65 to 74 Years | 161 (26.1%) | 105 (20.3%) |
| 75 Years and over | 213 (61.7%) | 200 (51.0%) |
Disability Class by Sex by Age in Newton County
Disability Class: Hearing Difficulty
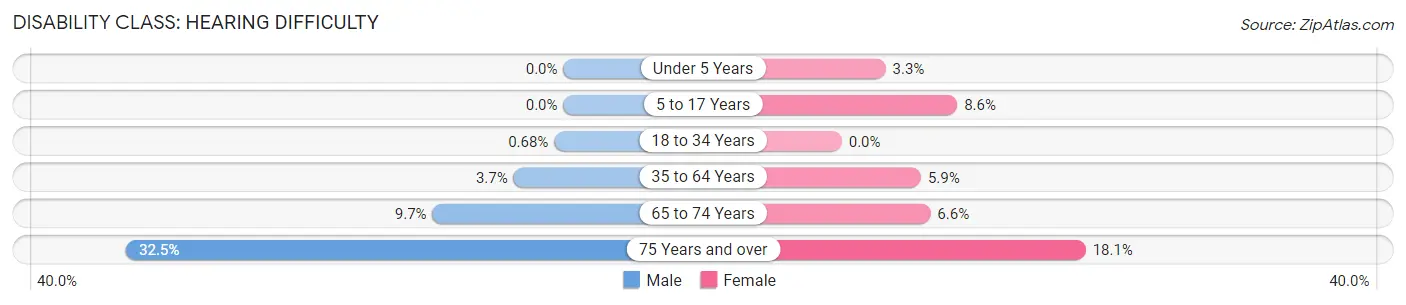
| Age Bracket | Male | Female |
| Under 5 Years | 0 (0.0%) | 5 (3.3%) |
| 5 to 17 Years | 0 (0.0%) | 45 (8.6%) |
| 18 to 34 Years | 4 (0.7%) | 0 (0.0%) |
| 35 to 64 Years | 52 (3.7%) | 77 (5.9%) |
| 65 to 74 Years | 60 (9.7%) | 34 (6.6%) |
| 75 Years and over | 112 (32.5%) | 71 (18.1%) |
Disability Class: Vision Difficulty
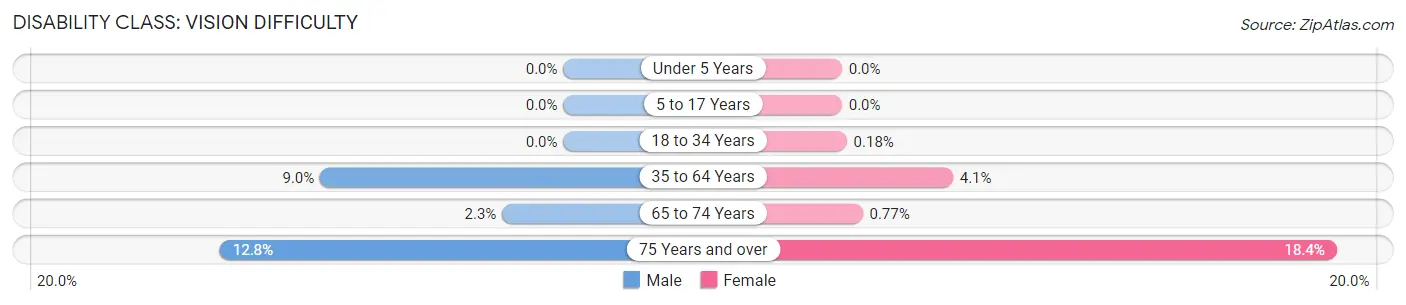
| Age Bracket | Male | Female |
| Under 5 Years | 0 (0.0%) | 0 (0.0%) |
| 5 to 17 Years | 0 (0.0%) | 0 (0.0%) |
| 18 to 34 Years | 0 (0.0%) | 1 (0.2%) |
| 35 to 64 Years | 127 (9.0%) | 54 (4.1%) |
| 65 to 74 Years | 14 (2.3%) | 4 (0.8%) |
| 75 Years and over | 44 (12.8%) | 72 (18.4%) |
Disability Class: Cognitive Difficulty
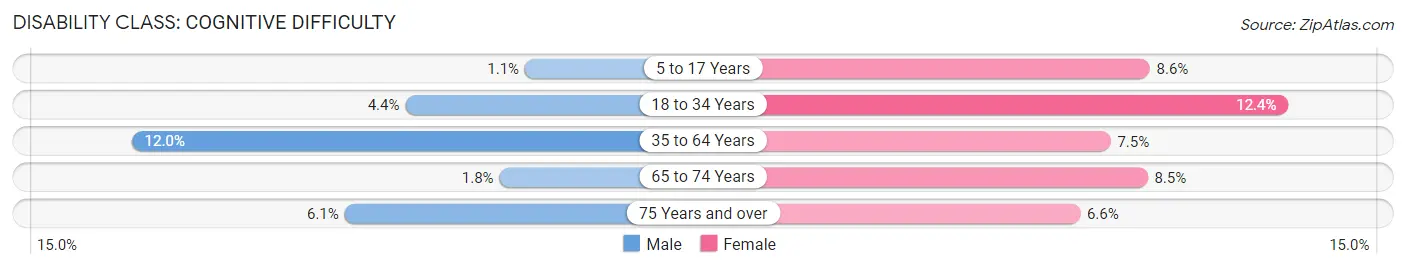
| Age Bracket | Male | Female |
| 5 to 17 Years | 6 (1.1%) | 45 (8.6%) |
| 18 to 34 Years | 26 (4.4%) | 71 (12.4%) |
| 35 to 64 Years | 169 (12.0%) | 98 (7.5%) |
| 65 to 74 Years | 11 (1.8%) | 44 (8.5%) |
| 75 Years and over | 21 (6.1%) | 26 (6.6%) |
Disability Class: Ambulatory Difficulty
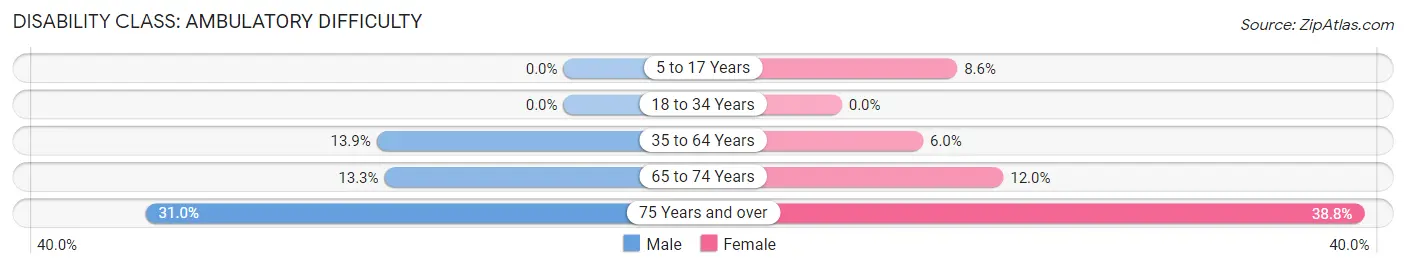
| Age Bracket | Male | Female |
| 5 to 17 Years | 0 (0.0%) | 45 (8.6%) |
| 18 to 34 Years | 0 (0.0%) | 0 (0.0%) |
| 35 to 64 Years | 195 (13.9%) | 79 (6.0%) |
| 65 to 74 Years | 82 (13.3%) | 62 (12.0%) |
| 75 Years and over | 107 (31.0%) | 152 (38.8%) |
Disability Class: Self-Care Difficulty
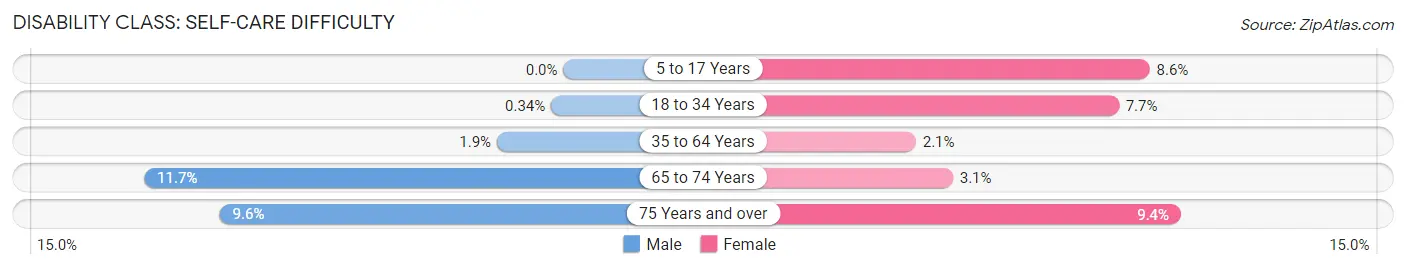
| Age Bracket | Male | Female |
| 5 to 17 Years | 0 (0.0%) | 45 (8.6%) |
| 18 to 34 Years | 2 (0.3%) | 44 (7.7%) |
| 35 to 64 Years | 26 (1.8%) | 27 (2.1%) |
| 65 to 74 Years | 72 (11.7%) | 16 (3.1%) |
| 75 Years and over | 33 (9.6%) | 37 (9.4%) |
Technology Access in Newton County
Computing Device Access in Newton County
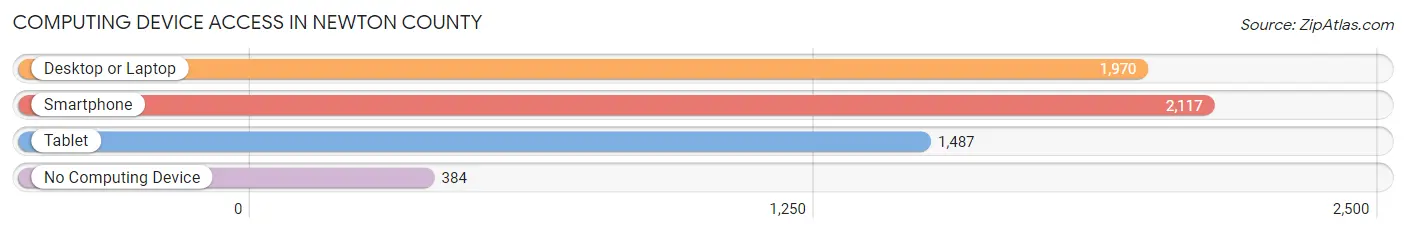
| Device Type | # Households | % Households |
| Desktop or Laptop | 1,970 | 67.8% |
| Smartphone | 2,117 | 72.9% |
| Tablet | 1,487 | 51.2% |
| No Computing Device | 384 | 13.2% |
| Total | 2,905 | 100.0% |
Internet Access in Newton County
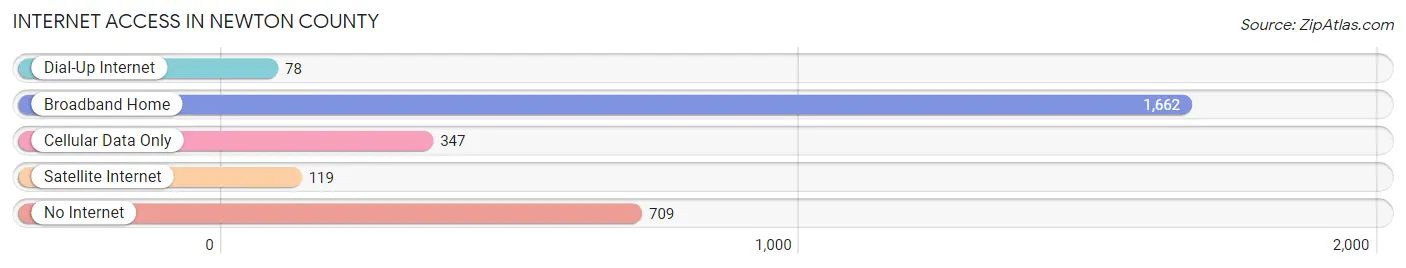
| Internet Type | # Households | % Households |
| Dial-Up Internet | 78 | 2.7% |
| Broadband Home | 1,662 | 57.2% |
| Cellular Data Only | 347 | 11.9% |
| Satellite Internet | 119 | 4.1% |
| No Internet | 709 | 24.4% |
| Total | 2,905 | 100.0% |
Newton County Summary
Newton County, Arkansas is located in the northwest corner of the state and is part of the Ozark Mountains region. It is bordered by Boone County to the north, Searcy County to the east, Madison County to the south, and McDonald County, Missouri to the west. The county seat is Jasper, and the largest city is Harrison. The county was established in 1842 and named after Thomas W. Newton, a U.S. Senator from Arkansas.
Geography
Newton County is located in the Ozark Mountains region of Arkansas. The county is mostly mountainous, with elevations ranging from 600 to 1,800 feet above sea level. The highest point in the county is Mount Sherman, which has an elevation of 1,843 feet. The county is drained by the Buffalo River, which flows through the county from north to south. Other major waterways include the White River, which forms the western boundary of the county, and the Little Buffalo River, which flows through the county from east to west.
The county has a total area of 602 square miles, of which 599 square miles is land and 3 square miles is water. The county is mostly forested, with the majority of the land being used for timber production.
Demographics
As of the 2010 census, Newton County had a population of 8,330. The racial makeup of the county was 95.3% White, 0.7% Black or African American, 0.6% Native American, 0.3% Asian, 0.1% Pacific Islander, 1.7% from other races, and 1.2% from two or more races. Hispanic or Latino of any race were 3.2% of the population.
The median income for a household in the county was $30,945, and the median income for a family was $37,917. The per capita income for the county was $16,845. About 17.2% of families and 21.7% of the population were below the poverty line, including 28.2% of those under age 18 and 16.2% of those age 65 or over.
Economy
The economy of Newton County is largely based on agriculture and timber production. The county is home to several large timber companies, including Weyerhaeuser, Plum Creek, and Potlatch. The county also has a large poultry industry, with several large poultry processing plants located in the county.
The county is also home to several manufacturing companies, including a furniture manufacturer, a plastics manufacturer, and a metal fabrication company. Tourism is also an important part of the economy, with the Buffalo National River and the Ozark National Forest located in the county.
Conclusion
Newton County, Arkansas is a rural county located in the Ozark Mountains region of the state. It is home to a diverse economy, with agriculture, timber production, poultry processing, and manufacturing all playing an important role. The county is also home to several tourist attractions, including the Buffalo National River and the Ozark National Forest. The county has a population of 8,330, with a median household income of $30,945.
Common Questions
What is Per Capita Income in Newton County?
Per Capita income in Newton County is $26,544.
What is the Median Family Income in Newton County?
Median Family Income in Newton County is $66,066.
What is the Median Household income in Newton County?
Median Household Income in Newton County is $50,699.
What is Income or Wage Gap in Newton County?
Income or Wage Gap in Newton County is 16.8%.
Women in Newton County earn 83.2 cents for every dollar earned by a man.
What is Family Income Deficit in Newton County?
Family Income Deficit in Newton County is $7,080.
Families that are below poverty line in Newton County earn $7,080 less on average than the poverty threshold level.
What is Inequality or Gini Index in Newton County?
Inequality or Gini Index in Newton County is 0.42.
What is the Total Population of Newton County?
Total Population of Newton County is 7,243.
What is the Total Male Population of Newton County?
Total Male Population of Newton County is 3,724.
What is the Total Female Population of Newton County?
Total Female Population of Newton County is 3,519.
What is the Ratio of Males per 100 Females in Newton County?
There are 105.83 Males per 100 Females in Newton County.
What is the Ratio of Females per 100 Males in Newton County?
There are 94.50 Females per 100 Males in Newton County.
What is the Median Population Age in Newton County?
Median Population Age in Newton County is 48.7 Years.
What is the Average Family Size in Newton County
Average Family Size in Newton County is 3.0 People.
What is the Average Household Size in Newton County
Average Household Size in Newton County is 2.5 People.
How Large is the Labor Force in Newton County?
There are 3,025 People in the Labor Forcein in Newton County.
What is the Percentage of People in the Labor Force in Newton County?
49.6% of People are in the Labor Force in Newton County.
What is the Unemployment Rate in Newton County?
Unemployment Rate in Newton County is 3.8%.