Zip Codes with the Highest Percentage of Population with a Degree in Visual and Performing Arts in New Castle, PA
RELATED REPORTS & OPTIONS
Visual and Performing Arts
New Castle
Compare Zip Codes
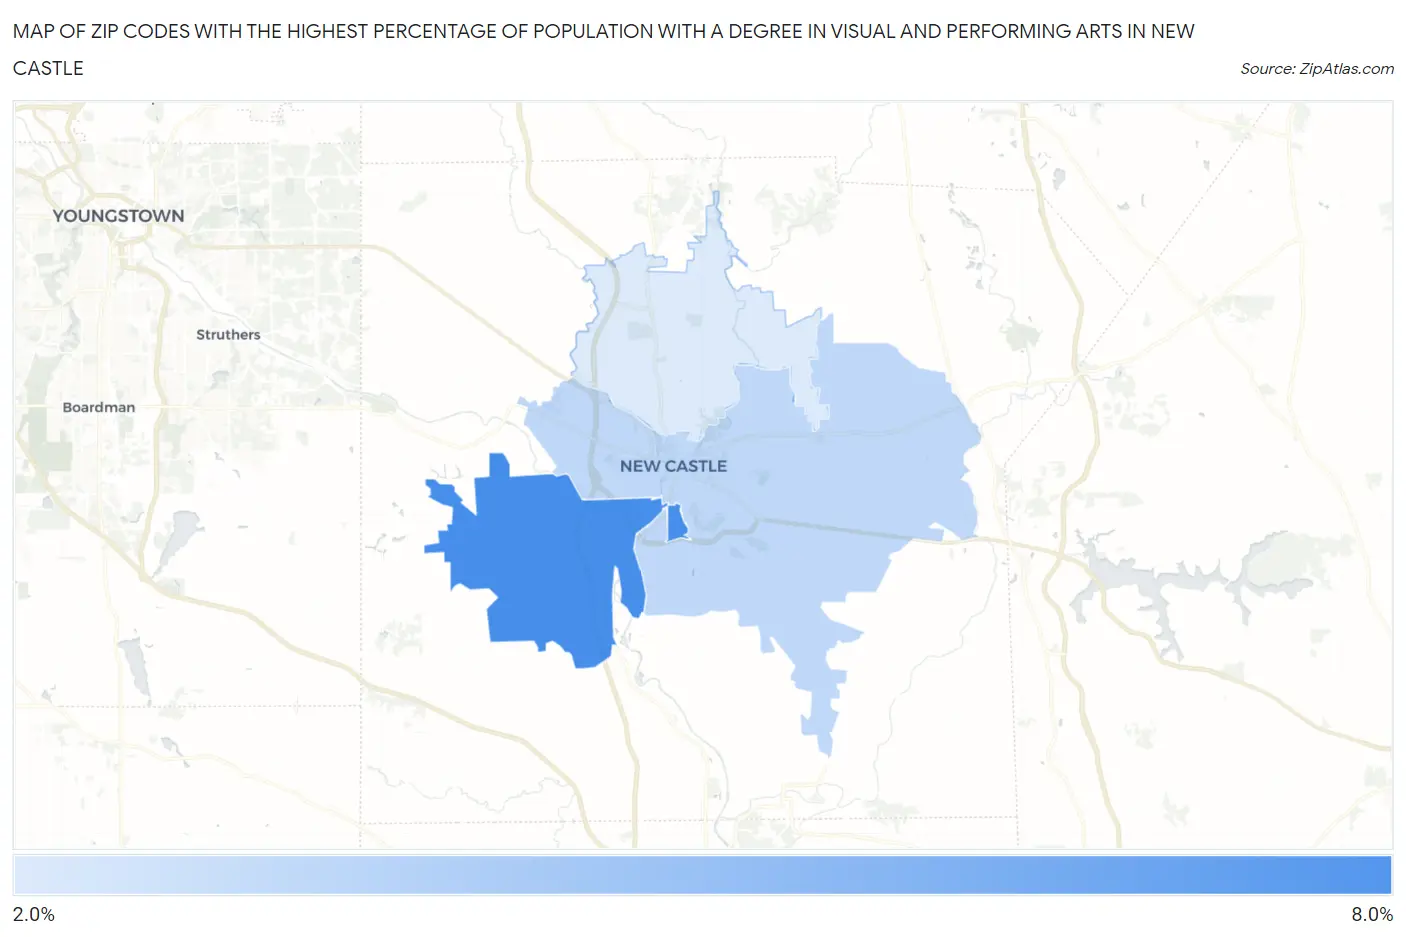
Map of Zip Codes with the Highest Percentage of Population with a Degree in Visual and Performing Arts in New Castle
2.5%
7.8%
Zip Codes with the Highest Percentage of Population with a Degree in Visual and Performing Arts in New Castle, PA
| Zip Code | % Graduates | vs State | vs National | |
| 1. | 16102 | 7.8% | 3.8%(+3.97)#131 | 4.3%(+3.54)#2,994 |
| 2. | 16101 | 3.5% | 3.8%(-0.334)#519 | 4.3%(-0.763)#10,921 |
| 3. | 16105 | 2.5% | 3.8%(-1.37)#732 | 4.3%(-1.79)#14,771 |
1
Common Questions
What are the Top Zip Codes with the Highest Percentage of Population with a Degree in Visual and Performing Arts in New Castle, PA?
Top Zip Codes with the Highest Percentage of Population with a Degree in Visual and Performing Arts in New Castle, PA are:
What zip code has the Highest Percentage of Population with a Degree in Visual and Performing Arts in New Castle, PA?
16102 has the Highest Percentage of Population with a Degree in Visual and Performing Arts in New Castle, PA with 7.8%.
What is the Percentage of Population with a Degree in Visual and Performing Arts in New Castle, PA?
Percentage of Population with a Degree in Visual and Performing Arts in New Castle is 7.7%.
What is the Percentage of Population with a Degree in Visual and Performing Arts in Pennsylvania?
Percentage of Population with a Degree in Visual and Performing Arts in Pennsylvania is 3.8%.
What is the Percentage of Population with a Degree in Visual and Performing Arts in the United States?
Percentage of Population with a Degree in Visual and Performing Arts in the United States is 4.3%.