Zip Codes with the Highest Percentage of Population with a Degree in Visual and Performing Arts in Lancaster, PA
RELATED REPORTS & OPTIONS
Visual and Performing Arts
Lancaster
Compare Zip Codes
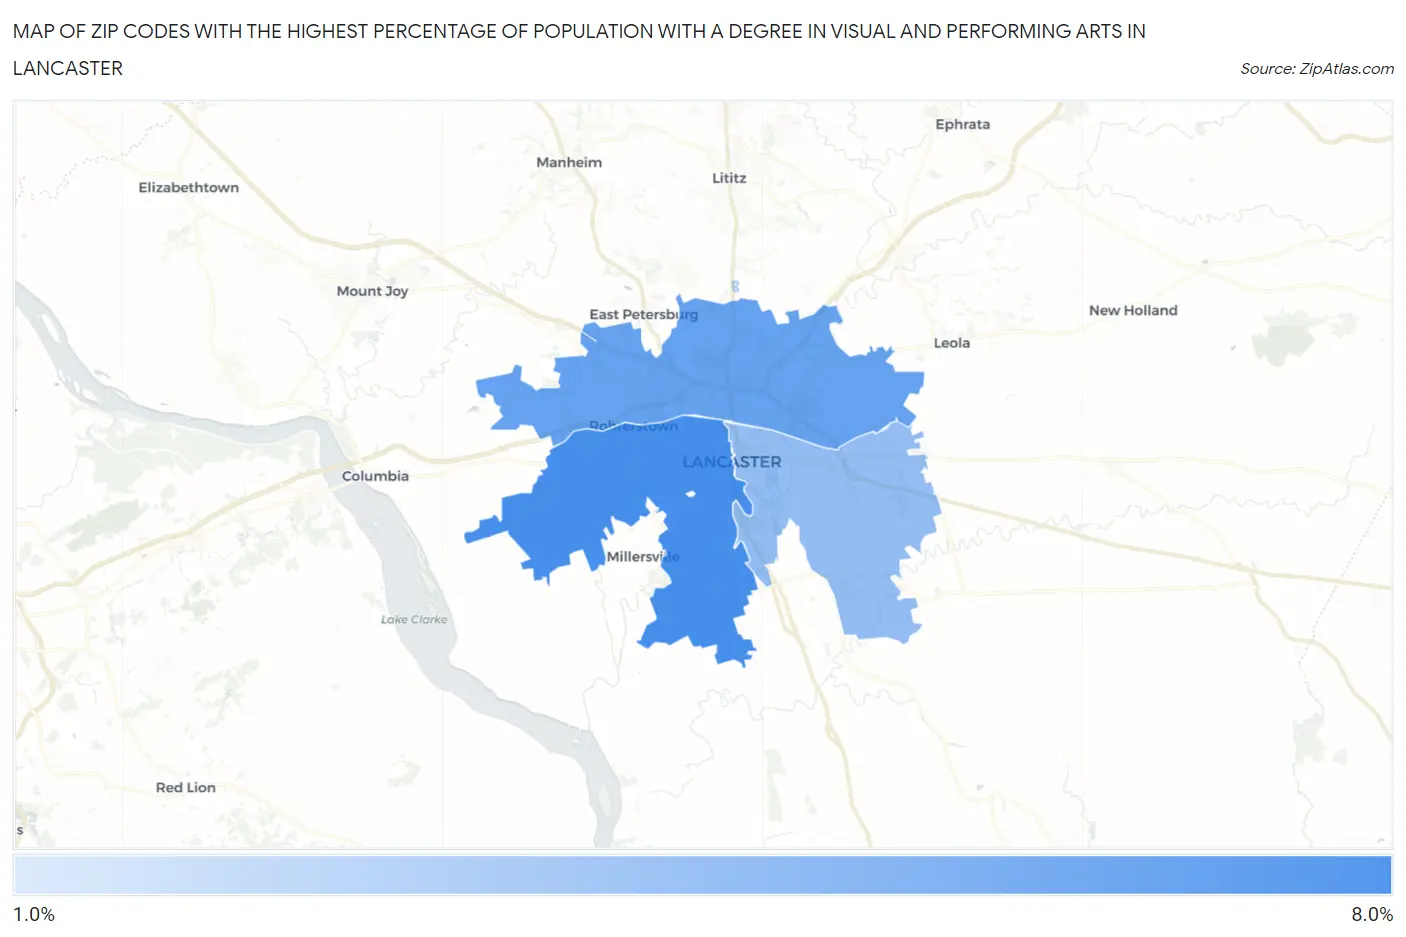
Map of Zip Codes with the Highest Percentage of Population with a Degree in Visual and Performing Arts in Lancaster
1.7%
6.9%
Zip Codes with the Highest Percentage of Population with a Degree in Visual and Performing Arts in Lancaster, PA
| Zip Code | % Graduates | vs State | vs National | |
| 1. | 17603 | 6.9% | 3.8%(+3.07)#162 | 4.3%(+2.64)#3,769 |
| 2. | 17601 | 5.8% | 3.8%(+1.98)#235 | 4.3%(+1.55)#5,161 |
| 3. | 17602 | 4.2% | 3.8%(+0.378)#401 | 4.3%(-0.051)#8,619 |
| 4. | 17606 | 1.7% | 3.8%(-2.16)#900 | 4.3%(-2.59)#17,612 |
1
Common Questions
What are the Top 3 Zip Codes with the Highest Percentage of Population with a Degree in Visual and Performing Arts in Lancaster, PA?
Top 3 Zip Codes with the Highest Percentage of Population with a Degree in Visual and Performing Arts in Lancaster, PA are:
What zip code has the Highest Percentage of Population with a Degree in Visual and Performing Arts in Lancaster, PA?
17603 has the Highest Percentage of Population with a Degree in Visual and Performing Arts in Lancaster, PA with 6.9%.
What is the Percentage of Population with a Degree in Visual and Performing Arts in Lancaster, PA?
Percentage of Population with a Degree in Visual and Performing Arts in Lancaster is 8.6%.
What is the Percentage of Population with a Degree in Visual and Performing Arts in Pennsylvania?
Percentage of Population with a Degree in Visual and Performing Arts in Pennsylvania is 3.8%.
What is the Percentage of Population with a Degree in Visual and Performing Arts in the United States?
Percentage of Population with a Degree in Visual and Performing Arts in the United States is 4.3%.