Zip Codes with the Highest Percentage of Population with a Degree in Visual and Performing Arts in West Chester, PA
RELATED REPORTS & OPTIONS
Visual and Performing Arts
West Chester
Compare Zip Codes
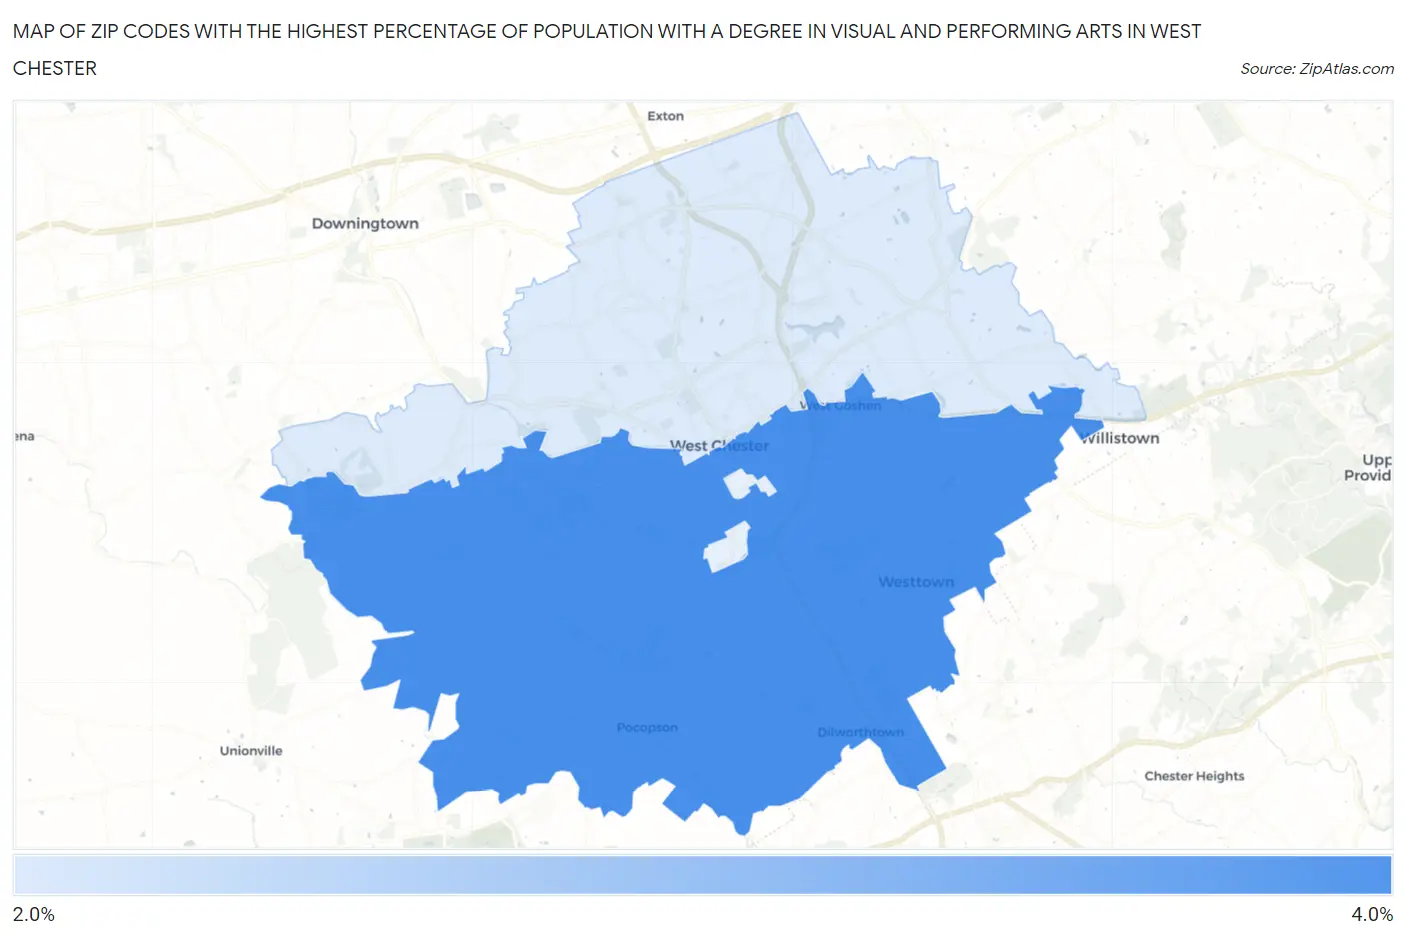
Map of Zip Codes with the Highest Percentage of Population with a Degree in Visual and Performing Arts in West Chester
2.8%
3.1%
Zip Codes with the Highest Percentage of Population with a Degree in Visual and Performing Arts in West Chester, PA
| Zip Code | % Graduates | vs State | vs National | |
| 1. | 19382 | 3.1% | 3.8%(-0.679)#589 | 4.3%(-1.11)#12,187 |
| 2. | 19380 | 2.8% | 3.8%(-0.977)#654 | 4.3%(-1.41)#13,309 |
1
Common Questions
What are the Top Zip Codes with the Highest Percentage of Population with a Degree in Visual and Performing Arts in West Chester, PA?
Top Zip Codes with the Highest Percentage of Population with a Degree in Visual and Performing Arts in West Chester, PA are:
What zip code has the Highest Percentage of Population with a Degree in Visual and Performing Arts in West Chester, PA?
19382 has the Highest Percentage of Population with a Degree in Visual and Performing Arts in West Chester, PA with 3.1%.
What is the Percentage of Population with a Degree in Visual and Performing Arts in Pennsylvania?
Percentage of Population with a Degree in Visual and Performing Arts in Pennsylvania is 3.8%.
What is the Percentage of Population with a Degree in Visual and Performing Arts in the United States?
Percentage of Population with a Degree in Visual and Performing Arts in the United States is 4.3%.