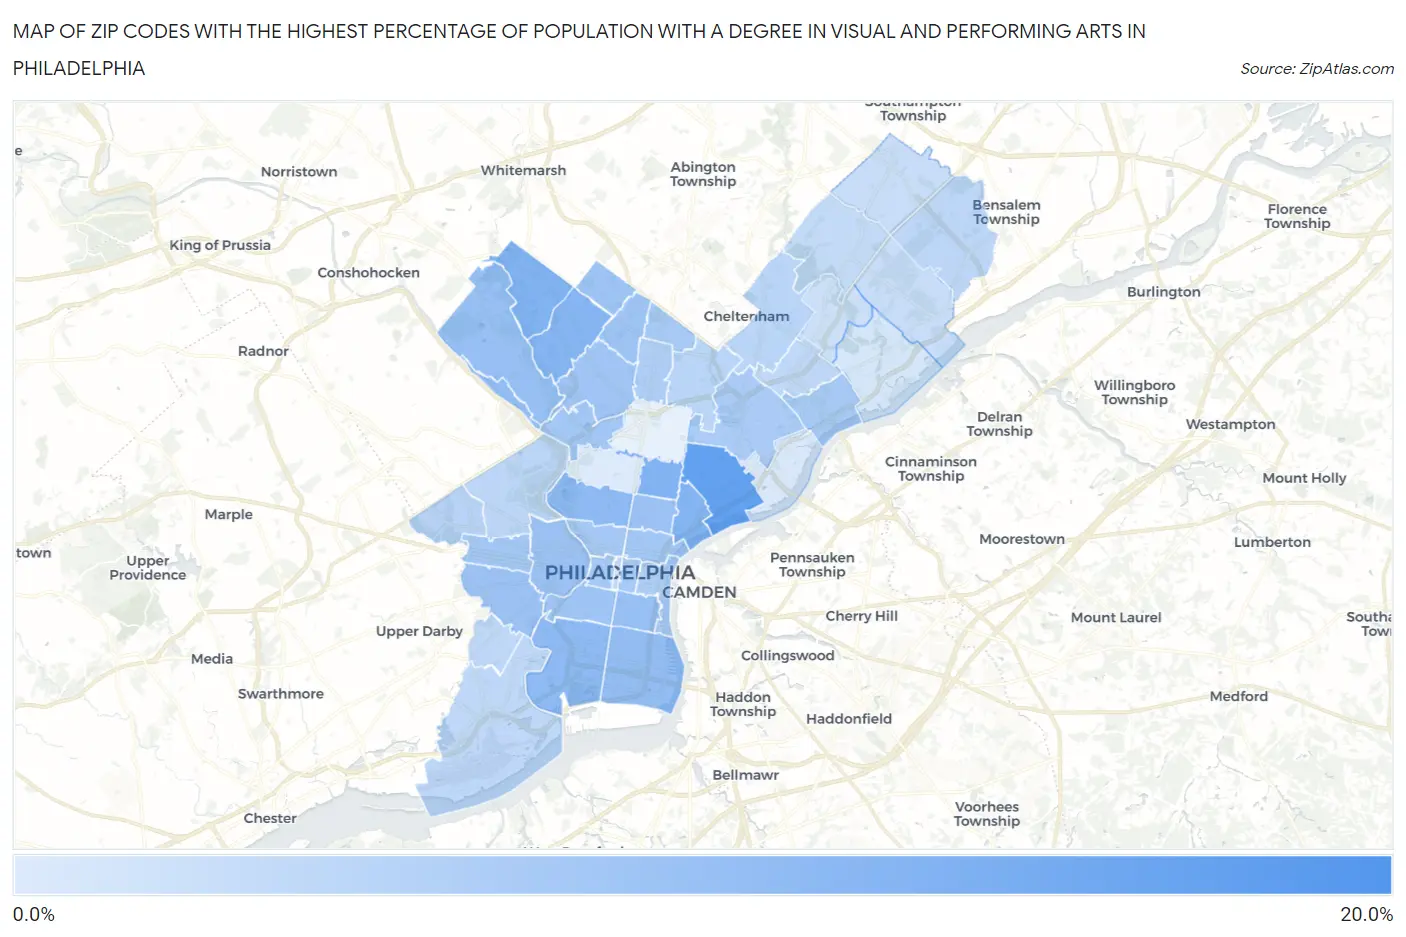
Zip Codes with the Highest Percentage of Population with a Degree in Visual and Performing Arts in Philadelphia, PA
RELATED REPORTS & OPTIONS
Visual and Performing Arts
Philadelphia
Compare Zip Codes
Map of Zip Codes with the Highest Percentage of Population with a Degree in Visual and Performing Arts in Philadelphia
0.078%
17.4%
Zip Codes with the Highest Percentage of Population with a Degree in Visual and Performing Arts in Philadelphia, PA
| Zip Code | % Graduates | vs State | vs National | |
| 1. | 19108 | 17.4% | 3.8%(+13.6)#29 | 4.3%(+13.1)#615 |
| 2. | 19134 | 14.0% | 3.8%(+10.2)#41 | 4.3%(+9.75)#958 |
| 3. | 19133 | 10.3% | 3.8%(+6.51)#75 | 4.3%(+6.08)#1,732 |
| 4. | 19118 | 10.3% | 3.8%(+6.48)#76 | 4.3%(+6.05)#1,739 |
| 5. | 19125 | 10.1% | 3.8%(+6.24)#78 | 4.3%(+5.81)#1,802 |
| 6. | 19119 | 9.8% | 3.8%(+5.98)#83 | 4.3%(+5.55)#1,909 |
| 7. | 19145 | 8.9% | 3.8%(+5.06)#101 | 4.3%(+4.63)#2,316 |
| 8. | 19121 | 8.8% | 3.8%(+4.93)#105 | 4.3%(+4.51)#2,381 |
| 9. | 19148 | 8.2% | 3.8%(+4.34)#121 | 4.3%(+3.91)#2,734 |
| 10. | 19127 | 8.1% | 3.8%(+4.32)#124 | 4.3%(+3.89)#2,757 |
| 11. | 19147 | 7.8% | 3.8%(+3.99)#130 | 4.3%(+3.56)#2,976 |
| 12. | 19128 | 7.7% | 3.8%(+3.85)#136 | 4.3%(+3.42)#3,086 |
| 13. | 19104 | 7.5% | 3.8%(+3.71)#138 | 4.3%(+3.28)#3,186 |
| 14. | 19122 | 7.5% | 3.8%(+3.69)#139 | 4.3%(+3.26)#3,205 |
| 15. | 19143 | 7.2% | 3.8%(+3.40)#146 | 4.3%(+2.97)#3,453 |
| 16. | 19146 | 7.0% | 3.8%(+3.22)#156 | 4.3%(+2.79)#3,619 |
| 17. | 19150 | 7.0% | 3.8%(+3.19)#158 | 4.3%(+2.76)#3,650 |
| 18. | 19138 | 6.8% | 3.8%(+2.99)#170 | 4.3%(+2.56)#3,866 |
| 19. | 19144 | 6.7% | 3.8%(+2.93)#172 | 4.3%(+2.50)#3,936 |
| 20. | 19123 | 6.5% | 3.8%(+2.65)#187 | 4.3%(+2.22)#4,264 |
| 21. | 19129 | 6.4% | 3.8%(+2.62)#191 | 4.3%(+2.19)#4,300 |
| 22. | 19139 | 6.4% | 3.8%(+2.55)#195 | 4.3%(+2.12)#4,371 |
| 23. | 19130 | 6.2% | 3.8%(+2.41)#203 | 4.3%(+1.98)#4,561 |
| 24. | 19135 | 6.0% | 3.8%(+2.19)#221 | 4.3%(+1.77)#4,850 |
| 25. | 19103 | 5.9% | 3.8%(+2.04)#230 | 4.3%(+1.61)#5,079 |
| 26. | 19107 | 5.8% | 3.8%(+2.03)#231 | 4.3%(+1.60)#5,102 |
| 27. | 19126 | 5.8% | 3.8%(+2.01)#232 | 4.3%(+1.58)#5,123 |
| 28. | 19124 | 5.6% | 3.8%(+1.83)#251 | 4.3%(+1.40)#5,413 |
| 29. | 19141 | 5.1% | 3.8%(+1.27)#310 | 4.3%(+0.838)#6,436 |
| 30. | 19106 | 4.8% | 3.8%(+0.952)#341 | 4.3%(+0.523)#7,124 |
| 31. | 19151 | 4.1% | 3.8%(+0.318)#411 | 4.3%(-0.111)#8,794 |
| 32. | 19120 | 3.9% | 3.8%(+0.125)#440 | 4.3%(-0.304)#9,405 |
| 33. | 19111 | 3.7% | 3.8%(-0.105)#478 | 4.3%(-0.533)#10,096 |
| 34. | 19131 | 3.6% | 3.8%(-0.220)#496 | 4.3%(-0.649)#10,495 |
| 35. | 19154 | 3.5% | 3.8%(-0.292)#511 | 4.3%(-0.721)#10,775 |
| 36. | 19153 | 3.4% | 3.8%(-0.391)#534 | 4.3%(-0.820)#11,141 |
| 37. | 19149 | 3.4% | 3.8%(-0.391)#535 | 4.3%(-0.820)#11,143 |
| 38. | 19142 | 3.2% | 3.8%(-0.575)#577 | 4.3%(-1.00)#11,815 |
| 39. | 19115 | 2.9% | 3.8%(-0.890)#631 | 4.3%(-1.32)#12,972 |
| 40. | 19102 | 2.8% | 3.8%(-1.07)#679 | 4.3%(-1.50)#13,696 |
| 41. | 19116 | 2.4% | 3.8%(-1.39)#737 | 4.3%(-1.82)#14,865 |
| 42. | 19114 | 2.4% | 3.8%(-1.45)#749 | 4.3%(-1.88)#15,095 |
| 43. | 19152 | 1.9% | 3.8%(-1.92)#850 | 4.3%(-2.35)#16,769 |
| 44. | 19136 | 0.83% | 3.8%(-3.00)#1,040 | 4.3%(-3.43)#20,087 |
| 45. | 19137 | 0.59% | 3.8%(-3.23)#1,063 | 4.3%(-3.66)#20,584 |
| 46. | 19132 | 0.078% | 3.8%(-3.74)#1,102 | 4.3%(-4.17)#21,241 |
1
Common Questions
What are the Top 10 Zip Codes with the Highest Percentage of Population with a Degree in Visual and Performing Arts in Philadelphia, PA?
Top 10 Zip Codes with the Highest Percentage of Population with a Degree in Visual and Performing Arts in Philadelphia, PA are:
What zip code has the Highest Percentage of Population with a Degree in Visual and Performing Arts in Philadelphia, PA?
19108 has the Highest Percentage of Population with a Degree in Visual and Performing Arts in Philadelphia, PA with 17.4%.
What is the Percentage of Population with a Degree in Visual and Performing Arts in Philadelphia, PA?
Percentage of Population with a Degree in Visual and Performing Arts in Philadelphia is 6.2%.
What is the Percentage of Population with a Degree in Visual and Performing Arts in Pennsylvania?
Percentage of Population with a Degree in Visual and Performing Arts in Pennsylvania is 3.8%.
What is the Percentage of Population with a Degree in Visual and Performing Arts in the United States?
Percentage of Population with a Degree in Visual and Performing Arts in the United States is 4.3%.