Zip Codes with the Highest Percentage of Population with a Degree in Visual and Performing Arts in Bethlehem, PA
RELATED REPORTS & OPTIONS
Visual and Performing Arts
Bethlehem
Compare Zip Codes
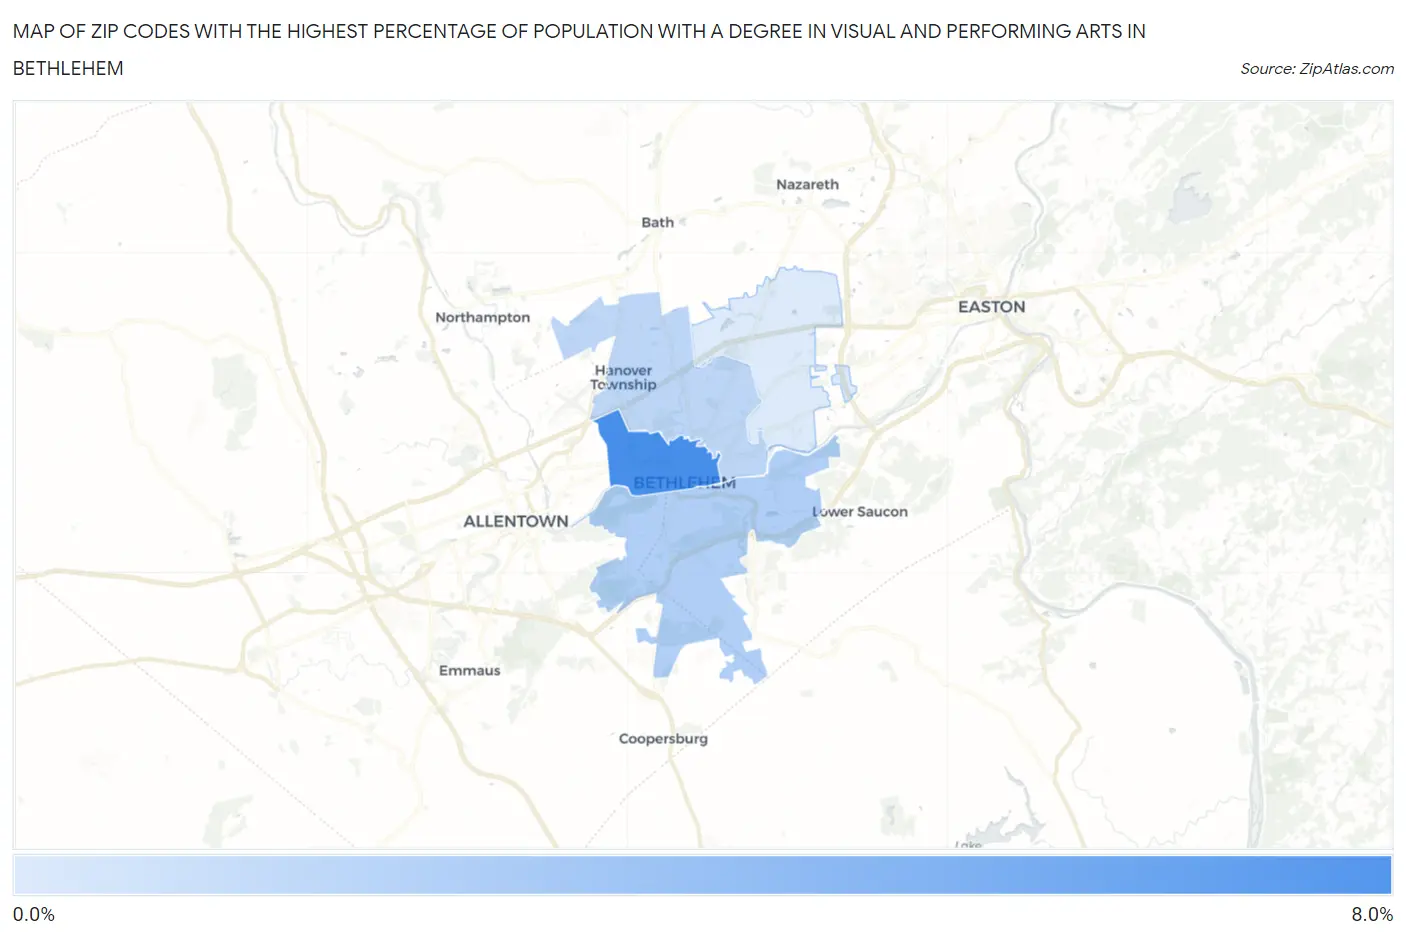
Map of Zip Codes with the Highest Percentage of Population with a Degree in Visual and Performing Arts in Bethlehem
1.1%
6.8%
Zip Codes with the Highest Percentage of Population with a Degree in Visual and Performing Arts in Bethlehem, PA
| Zip Code | % Graduates | vs State | vs National | |
| 1. | 18018 | 6.8% | 3.8%(+3.01)#169 | 4.3%(+2.58)#3,848 |
| 2. | 18015 | 2.7% | 3.8%(-1.10)#686 | 4.3%(-1.52)#13,784 |
| 3. | 18017 | 2.3% | 3.8%(-1.51)#762 | 4.3%(-1.94)#15,323 |
| 4. | 18020 | 1.1% | 3.8%(-2.76)#1,005 | 4.3%(-3.18)#19,480 |
1
Common Questions
What are the Top 3 Zip Codes with the Highest Percentage of Population with a Degree in Visual and Performing Arts in Bethlehem, PA?
Top 3 Zip Codes with the Highest Percentage of Population with a Degree in Visual and Performing Arts in Bethlehem, PA are:
What zip code has the Highest Percentage of Population with a Degree in Visual and Performing Arts in Bethlehem, PA?
18018 has the Highest Percentage of Population with a Degree in Visual and Performing Arts in Bethlehem, PA with 6.8%.
What is the Percentage of Population with a Degree in Visual and Performing Arts in Bethlehem, PA?
Percentage of Population with a Degree in Visual and Performing Arts in Bethlehem is 4.8%.
What is the Percentage of Population with a Degree in Visual and Performing Arts in Pennsylvania?
Percentage of Population with a Degree in Visual and Performing Arts in Pennsylvania is 3.8%.
What is the Percentage of Population with a Degree in Visual and Performing Arts in the United States?
Percentage of Population with a Degree in Visual and Performing Arts in the United States is 4.3%.