Zip Codes with the Highest Percentage of Population with a Degree in Visual and Performing Arts in Easton, PA
RELATED REPORTS & OPTIONS
Visual and Performing Arts
Easton
Compare Zip Codes
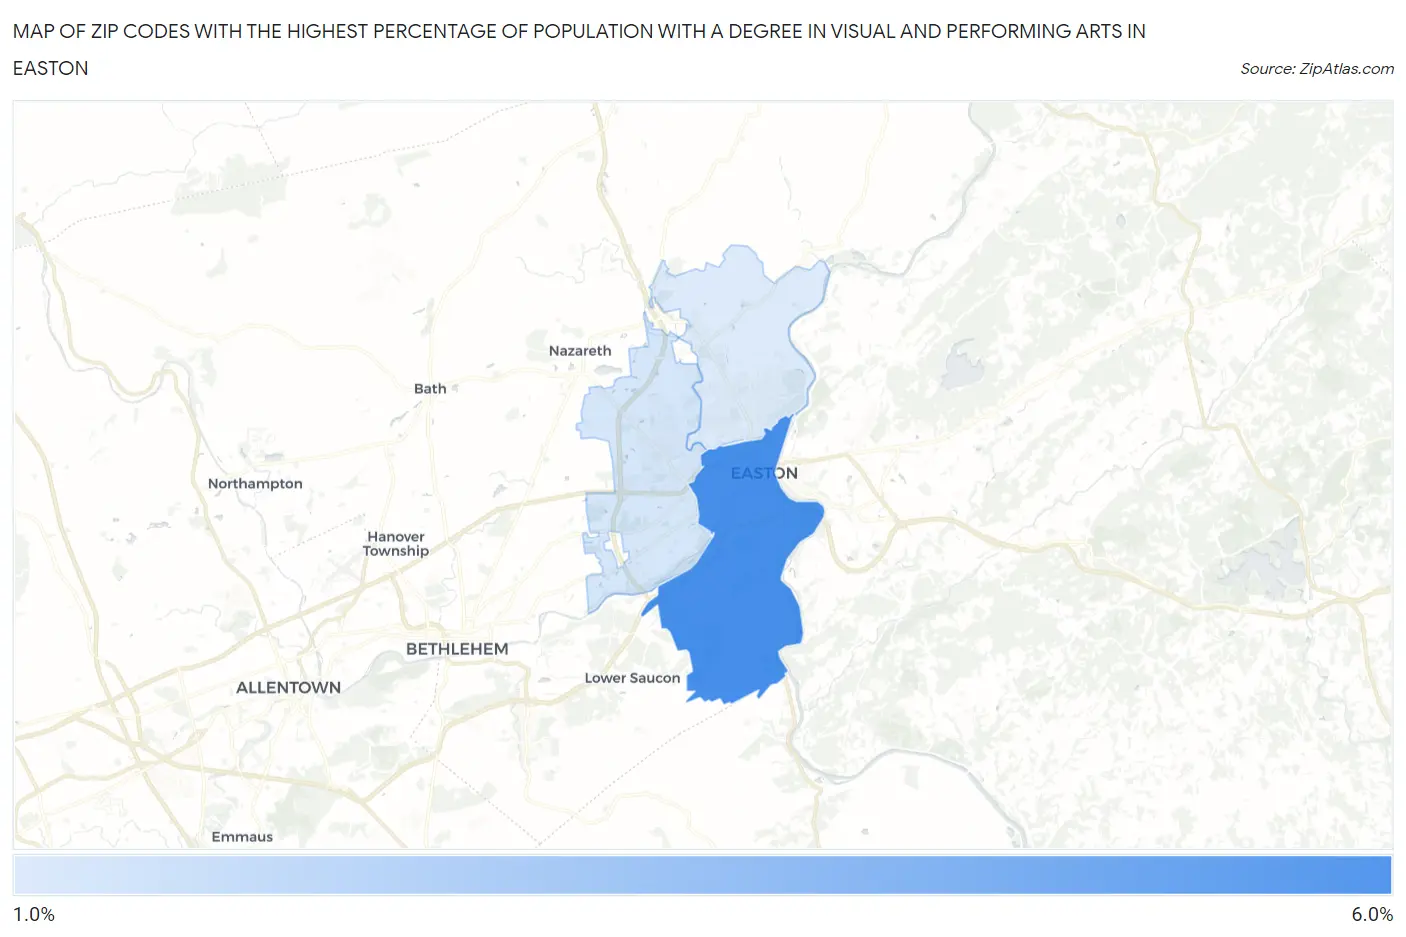
Map of Zip Codes with the Highest Percentage of Population with a Degree in Visual and Performing Arts in Easton
1.4%
5.8%
Zip Codes with the Highest Percentage of Population with a Degree in Visual and Performing Arts in Easton, PA
| Zip Code | % Graduates | vs State | vs National | |
| 1. | 18042 | 5.8% | 3.8%(+1.94)#242 | 4.3%(+1.51)#5,221 |
| 2. | 18045 | 1.6% | 3.8%(-2.18)#908 | 4.3%(-2.61)#17,687 |
| 3. | 18040 | 1.4% | 3.8%(-2.40)#952 | 4.3%(-2.83)#18,393 |
1
Common Questions
What are the Top Zip Codes with the Highest Percentage of Population with a Degree in Visual and Performing Arts in Easton, PA?
Top Zip Codes with the Highest Percentage of Population with a Degree in Visual and Performing Arts in Easton, PA are:
What zip code has the Highest Percentage of Population with a Degree in Visual and Performing Arts in Easton, PA?
18042 has the Highest Percentage of Population with a Degree in Visual and Performing Arts in Easton, PA with 5.8%.
What is the Percentage of Population with a Degree in Visual and Performing Arts in Easton, PA?
Percentage of Population with a Degree in Visual and Performing Arts in Easton is 6.0%.
What is the Percentage of Population with a Degree in Visual and Performing Arts in Pennsylvania?
Percentage of Population with a Degree in Visual and Performing Arts in Pennsylvania is 3.8%.
What is the Percentage of Population with a Degree in Visual and Performing Arts in the United States?
Percentage of Population with a Degree in Visual and Performing Arts in the United States is 4.3%.