Ravenwood, MO Map & Demographics
Ravenwood Map
Ravenwood Overview
$22,147
PER CAPITA INCOME
$58,125
AVG FAMILY INCOME
$55,588
AVG HOUSEHOLD INCOME
36.6%
WAGE / INCOME GAP [ % ]
63.4¢/ $1
WAGE / INCOME GAP [ $ ]
0.41
INEQUALITY / GINI INDEX
530
TOTAL POPULATION
251
MALE POPULATION
279
FEMALE POPULATION
89.96
MALES / 100 FEMALES
111.16
FEMALES / 100 MALES
36.0
MEDIAN AGE
3.6
AVG FAMILY SIZE
2.8
AVG HOUSEHOLD SIZE
195
LABOR FORCE [ PEOPLE ]
52.6%
PERCENT IN LABOR FORCE
2.6%
UNEMPLOYMENT RATE
Ravenwood Zip Codes
Ravenwood Area Codes
Income in Ravenwood
Income Overview in Ravenwood
Per Capita Income in Ravenwood is $22,147, while median incomes of families and households are $58,125 and $55,588 respectively.
| Characteristic | Number | Measure |
| Per Capita Income | 530 | $22,147 |
| Median Family Income | 122 | $58,125 |
| Mean Family Income | 122 | $73,832 |
| Median Household Income | 188 | $55,588 |
| Mean Household Income | 188 | $66,719 |
| Income Deficit | 122 | $0 |
| Wage / Income Gap (%) | 530 | 36.60% |
| Wage / Income Gap ($) | 530 | 63.40¢ per $1 |
| Gini / Inequality Index | 530 | 0.41 |
Earnings by Sex in Ravenwood
Average Earnings in Ravenwood are $38,036, $47,813 for men and $30,313 for women, a difference of 36.6%.
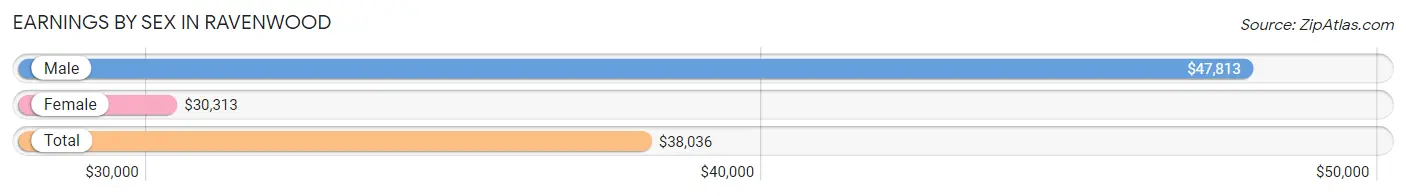
| Sex | Number | Average Earnings |
| Male | 107 (53.2%) | $47,813 |
| Female | 94 (46.8%) | $30,313 |
| Total | 201 (100.0%) | $38,036 |
Earnings by Sex by Income Bracket in Ravenwood
The most common earnings brackets in Ravenwood are $50,000 to $54,999 for men (20 | 18.7%) and $30,000 to $34,999 for women (18 | 19.2%).
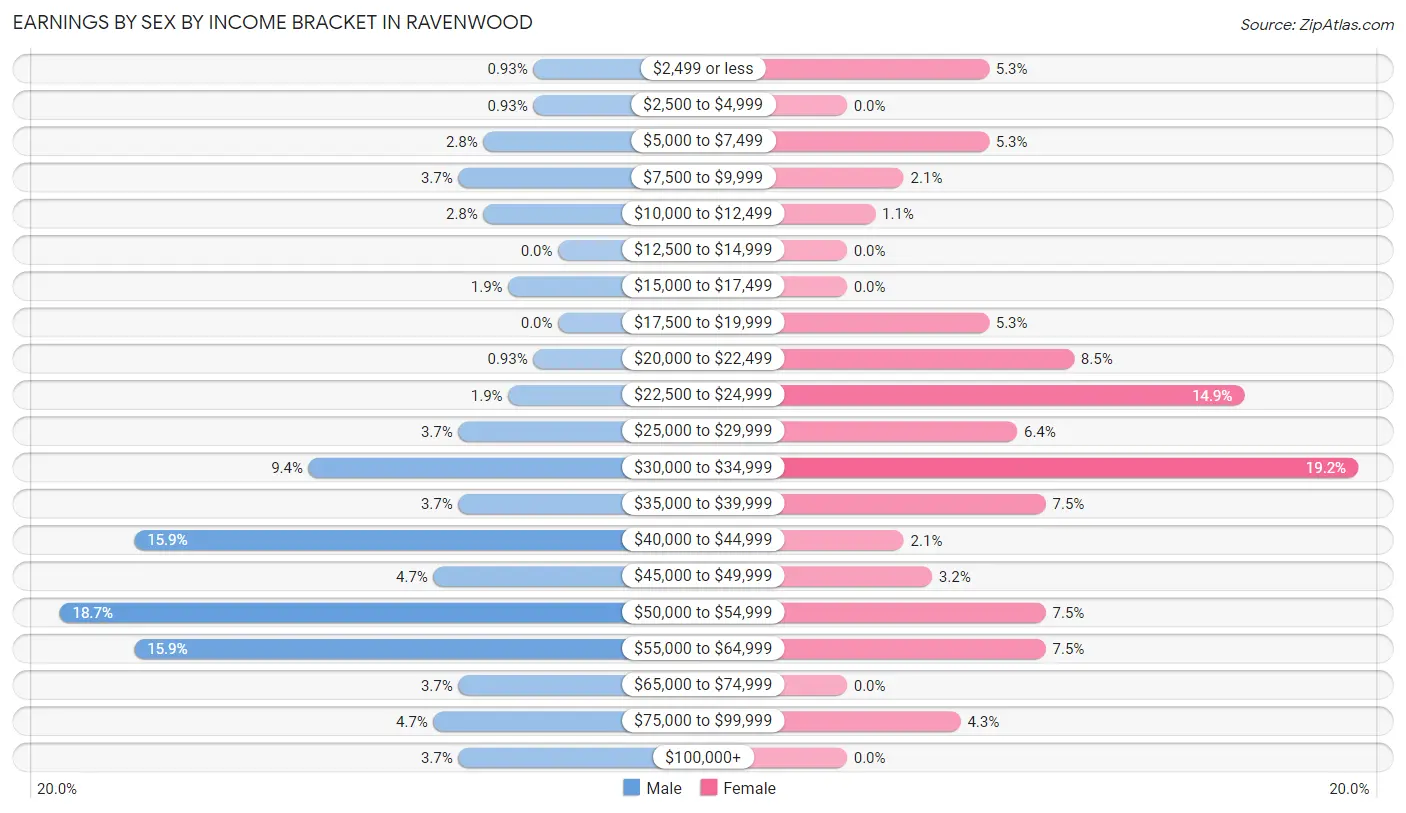
| Income | Male | Female |
| $2,499 or less | 1 (0.9%) | 5 (5.3%) |
| $2,500 to $4,999 | 1 (0.9%) | 0 (0.0%) |
| $5,000 to $7,499 | 3 (2.8%) | 5 (5.3%) |
| $7,500 to $9,999 | 4 (3.7%) | 2 (2.1%) |
| $10,000 to $12,499 | 3 (2.8%) | 1 (1.1%) |
| $12,500 to $14,999 | 0 (0.0%) | 0 (0.0%) |
| $15,000 to $17,499 | 2 (1.9%) | 0 (0.0%) |
| $17,500 to $19,999 | 0 (0.0%) | 5 (5.3%) |
| $20,000 to $22,499 | 1 (0.9%) | 8 (8.5%) |
| $22,500 to $24,999 | 2 (1.9%) | 14 (14.9%) |
| $25,000 to $29,999 | 4 (3.7%) | 6 (6.4%) |
| $30,000 to $34,999 | 10 (9.3%) | 18 (19.2%) |
| $35,000 to $39,999 | 4 (3.7%) | 7 (7.4%) |
| $40,000 to $44,999 | 17 (15.9%) | 2 (2.1%) |
| $45,000 to $49,999 | 5 (4.7%) | 3 (3.2%) |
| $50,000 to $54,999 | 20 (18.7%) | 7 (7.4%) |
| $55,000 to $64,999 | 17 (15.9%) | 7 (7.4%) |
| $65,000 to $74,999 | 4 (3.7%) | 0 (0.0%) |
| $75,000 to $99,999 | 5 (4.7%) | 4 (4.3%) |
| $100,000+ | 4 (3.7%) | 0 (0.0%) |
| Total | 107 (100.0%) | 94 (100.0%) |
Earnings by Sex by Educational Attainment in Ravenwood
Average earnings in Ravenwood are $50,221 for men and $31,719 for women, a difference of 36.8%. Men with an educational attainment of bachelor's degree enjoy the highest average annual earnings of $56,250, while those with high school diploma education earn the least with $42,750. Women with an educational attainment of bachelor's degree earn the most with the average annual earnings of $43,750, while those with college or associate's degree education have the smallest earnings of $28,750.
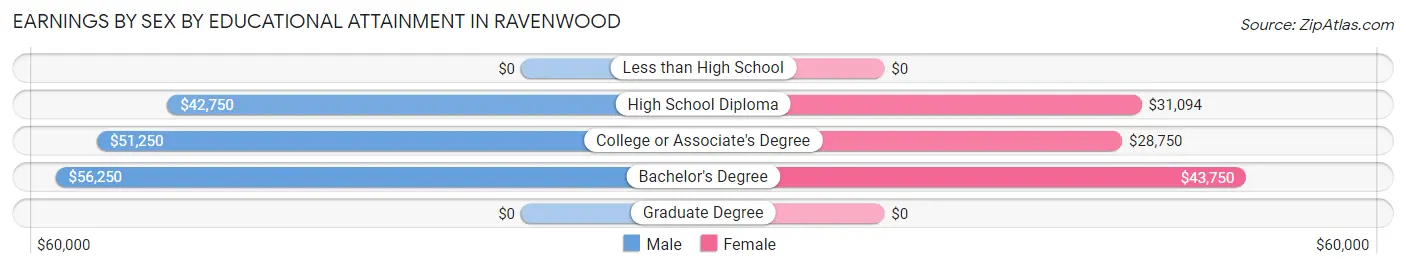
| Educational Attainment | Male Income | Female Income |
| Less than High School | - | - |
| High School Diploma | $42,750 | $31,094 |
| College or Associate's Degree | $51,250 | $28,750 |
| Bachelor's Degree | $56,250 | $43,750 |
| Graduate Degree | - | - |
| Total | $50,221 | $31,719 |
Family Income in Ravenwood
Family Income Brackets in Ravenwood
According to the Ravenwood family income data, there are 55 families falling into the $50,000 to $74,999 income range, which is the most common income bracket and makes up 45.1% of all families.
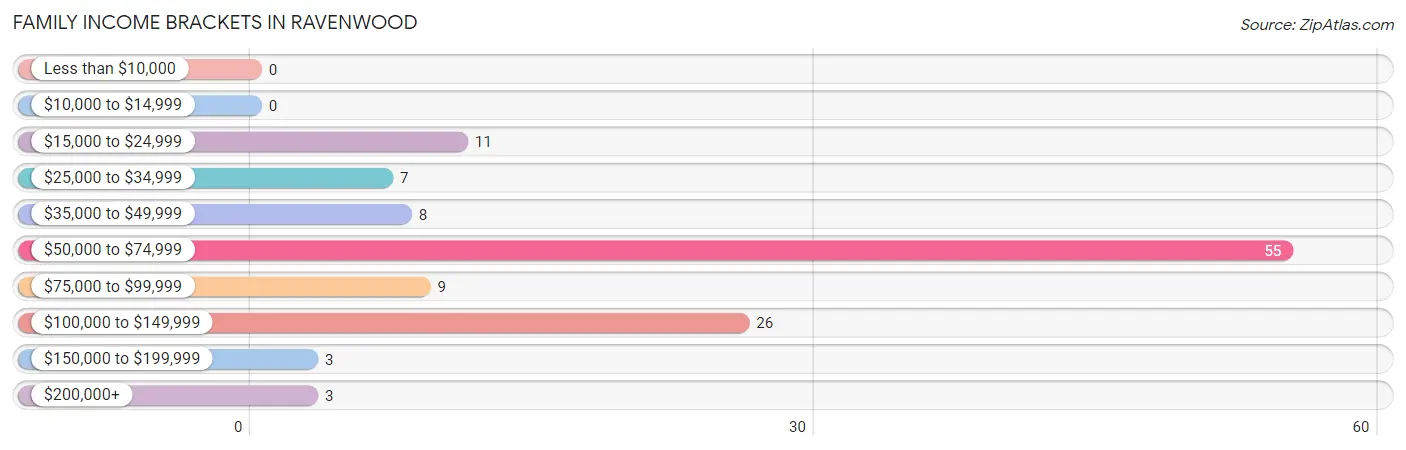
| Income Bracket | # Families | % Families |
| Less than $10,000 | 0 | 0.0% |
| $10,000 to $14,999 | 0 | 0.0% |
| $15,000 to $24,999 | 11 | 9.0% |
| $25,000 to $34,999 | 7 | 5.7% |
| $35,000 to $49,999 | 8 | 6.6% |
| $50,000 to $74,999 | 55 | 45.1% |
| $75,000 to $99,999 | 9 | 7.4% |
| $100,000 to $149,999 | 26 | 21.3% |
| $150,000 to $199,999 | 3 | 2.5% |
| $200,000+ | 3 | 2.5% |
Family Income by Famaliy Size in Ravenwood
5-person families (11 | 9.0%) account for the highest median family income in Ravenwood with $100,750 per family, while 3-person families (14 | 11.5%) have the highest median income of $33,333 per family member.
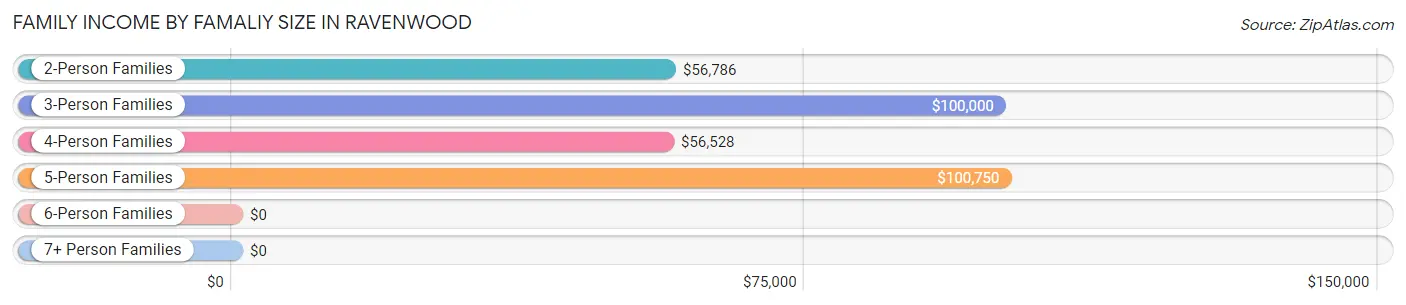
| Income Bracket | # Families | Median Income |
| 2-Person Families | 50 (41.0%) | $56,786 |
| 3-Person Families | 14 (11.5%) | $100,000 |
| 4-Person Families | 45 (36.9%) | $56,528 |
| 5-Person Families | 11 (9.0%) | $100,750 |
| 6-Person Families | 1 (0.8%) | $0 |
| 7+ Person Families | 1 (0.8%) | $0 |
| Total | 122 (100.0%) | $58,125 |
Family Income by Number of Earners in Ravenwood
The median family income in Ravenwood is $58,125, with families comprising 3+ earners (8) having the highest median family income of $111,250, while families with 1 earner (53) have the lowest median family income of $51,838, accounting for 6.6% and 43.4% of families, respectively.
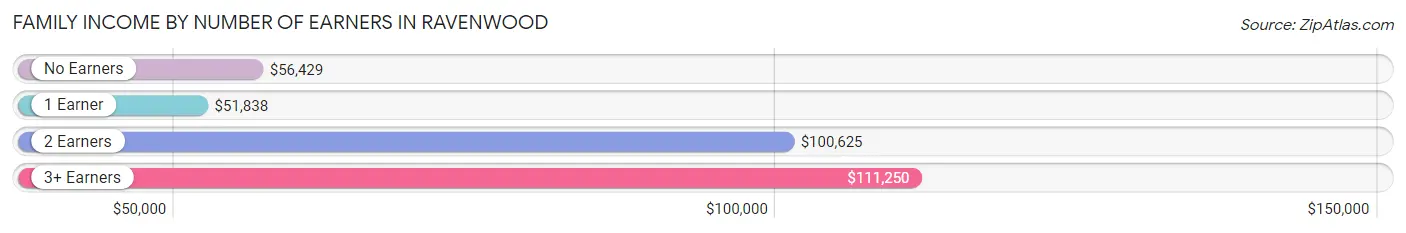
| Number of Earners | # Families | Median Income |
| No Earners | 18 (14.7%) | $56,429 |
| 1 Earner | 53 (43.4%) | $51,838 |
| 2 Earners | 43 (35.2%) | $100,625 |
| 3+ Earners | 8 (6.6%) | $111,250 |
| Total | 122 (100.0%) | $58,125 |
Household Income in Ravenwood
Household Income Brackets in Ravenwood
With 68 households falling in the category, the $50,000 to $74,999 income range is the most frequent in Ravenwood, accounting for 36.2% of all households. In contrast, only 3 households (1.6%) fall into the $150,000 to $199,999 income bracket, making it the least populous group.
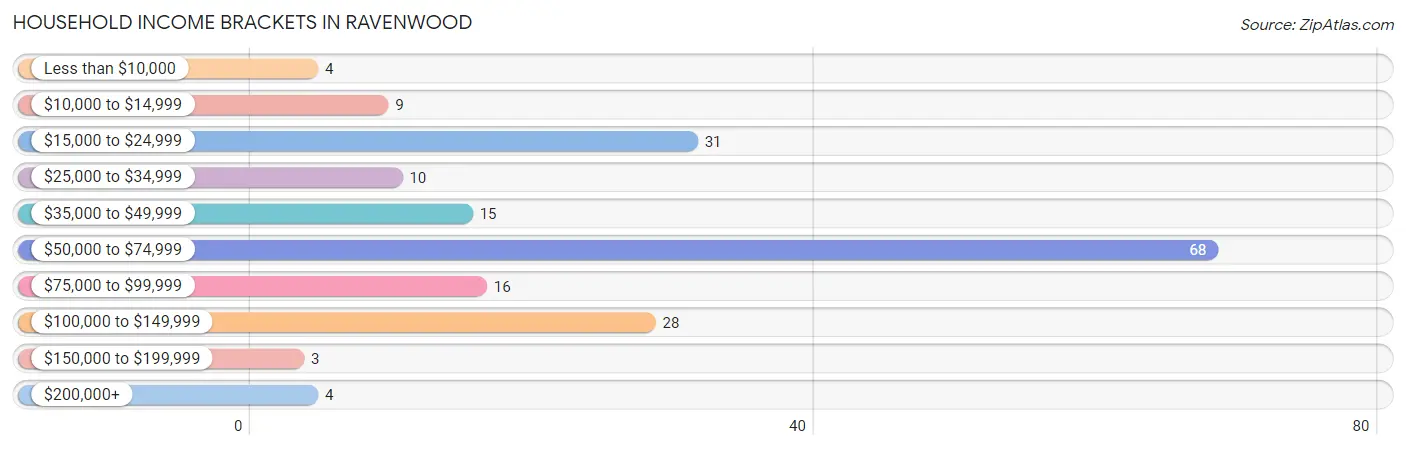
| Income Bracket | # Households | % Households |
| Less than $10,000 | 4 | 2.1% |
| $10,000 to $14,999 | 9 | 4.8% |
| $15,000 to $24,999 | 31 | 16.5% |
| $25,000 to $34,999 | 10 | 5.3% |
| $35,000 to $49,999 | 15 | 8.0% |
| $50,000 to $74,999 | 68 | 36.2% |
| $75,000 to $99,999 | 16 | 8.5% |
| $100,000 to $149,999 | 28 | 14.9% |
| $150,000 to $199,999 | 3 | 1.6% |
| $200,000+ | 4 | 2.1% |
Household Income by Householder Age in Ravenwood
The median household income in Ravenwood is $55,588, with the highest median household income of $78,125 found in the 45 to 64 years age bracket for the primary householder. A total of 39 households (20.7%) fall into this category. Meanwhile, the 65+ years age bracket for the primary householder has the lowest median household income of $31,875, with 51 households (27.1%) in this group.
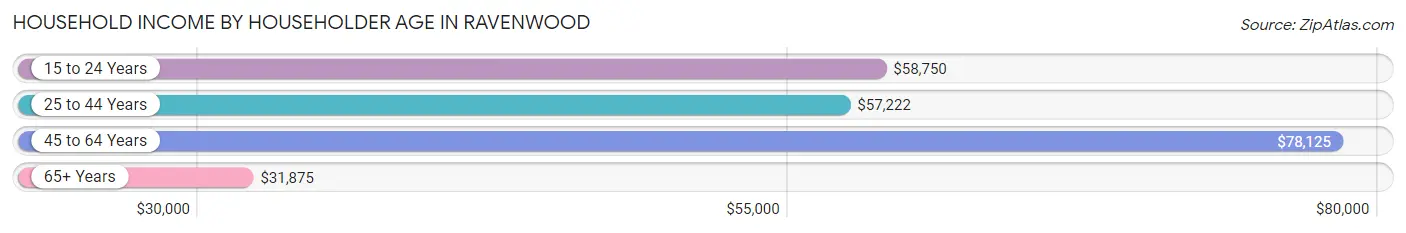
| Income Bracket | # Households | Median Income |
| 15 to 24 Years | 6 (3.2%) | $58,750 |
| 25 to 44 Years | 92 (48.9%) | $57,222 |
| 45 to 64 Years | 39 (20.7%) | $78,125 |
| 65+ Years | 51 (27.1%) | $31,875 |
| Total | 188 (100.0%) | $55,588 |
Poverty in Ravenwood
Income Below Poverty by Sex and Age in Ravenwood
With 8.4% poverty level for males and 7.9% for females among the residents of Ravenwood, 15 year old males and 75 year old and over females are the most vulnerable to poverty, with 5 males (55.6%) and 5 females (33.3%) in their respective age groups living below the poverty level.
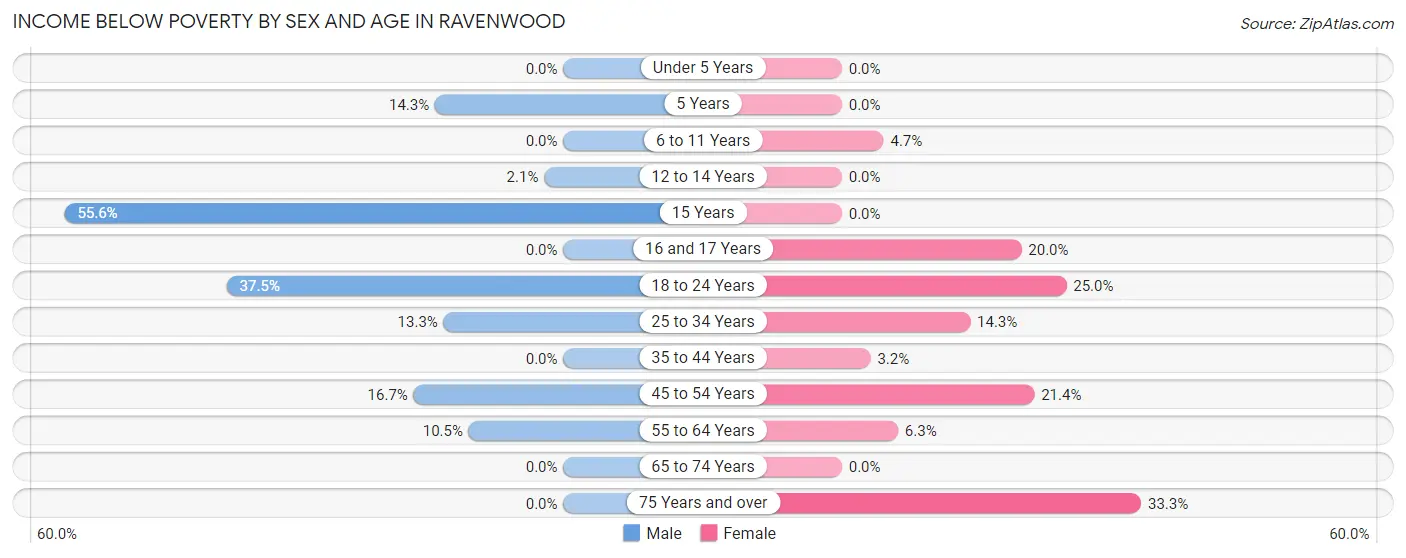
| Age Bracket | Male | Female |
| Under 5 Years | 0 (0.0%) | 0 (0.0%) |
| 5 Years | 1 (14.3%) | 0 (0.0%) |
| 6 to 11 Years | 0 (0.0%) | 2 (4.6%) |
| 12 to 14 Years | 1 (2.1%) | 0 (0.0%) |
| 15 Years | 5 (55.6%) | 0 (0.0%) |
| 16 and 17 Years | 0 (0.0%) | 1 (20.0%) |
| 18 to 24 Years | 6 (37.5%) | 3 (25.0%) |
| 25 to 34 Years | 4 (13.3%) | 4 (14.3%) |
| 35 to 44 Years | 0 (0.0%) | 3 (3.2%) |
| 45 to 54 Years | 2 (16.7%) | 3 (21.4%) |
| 55 to 64 Years | 2 (10.5%) | 1 (6.2%) |
| 65 to 74 Years | 0 (0.0%) | 0 (0.0%) |
| 75 Years and over | 0 (0.0%) | 5 (33.3%) |
| Total | 21 (8.4%) | 22 (7.9%) |
Income Above Poverty by Sex and Age in Ravenwood
According to the poverty statistics in Ravenwood, males aged under 5 years and females aged under 5 years are the age groups that are most secure financially, with 100.0% of males and 100.0% of females in these age groups living above the poverty line.
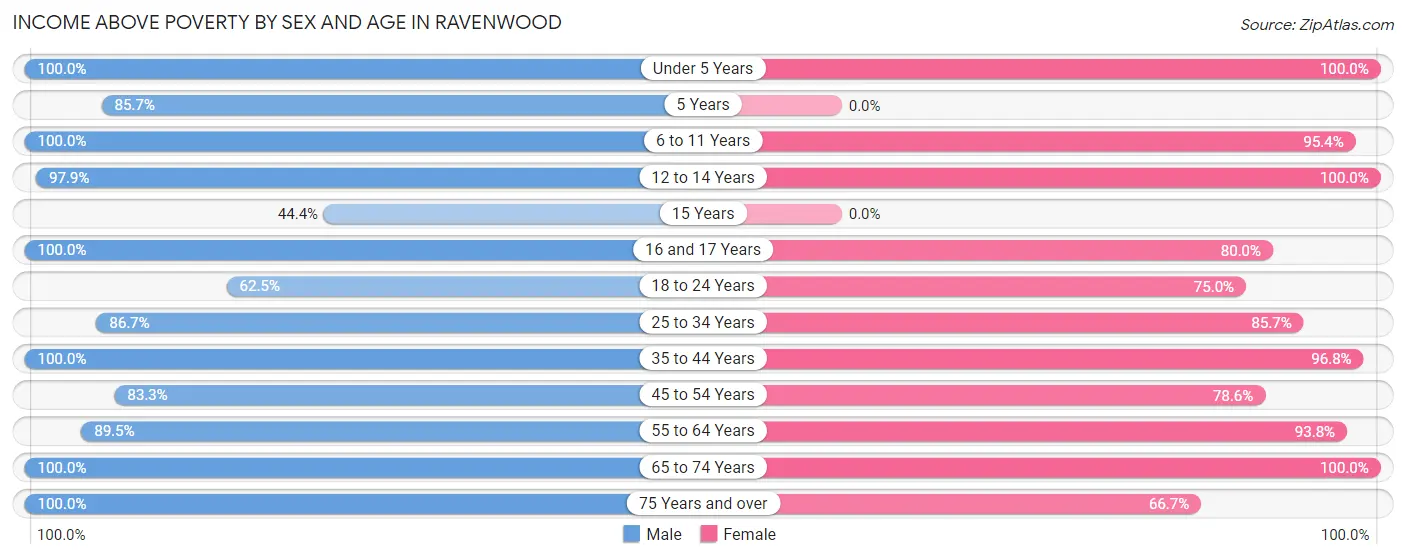
| Age Bracket | Male | Female |
| Under 5 Years | 20 (100.0%) | 13 (100.0%) |
| 5 Years | 6 (85.7%) | 0 (0.0%) |
| 6 to 11 Years | 6 (100.0%) | 41 (95.4%) |
| 12 to 14 Years | 46 (97.9%) | 14 (100.0%) |
| 15 Years | 4 (44.4%) | 0 (0.0%) |
| 16 and 17 Years | 12 (100.0%) | 4 (80.0%) |
| 18 to 24 Years | 10 (62.5%) | 9 (75.0%) |
| 25 to 34 Years | 26 (86.7%) | 24 (85.7%) |
| 35 to 44 Years | 39 (100.0%) | 91 (96.8%) |
| 45 to 54 Years | 10 (83.3%) | 11 (78.6%) |
| 55 to 64 Years | 17 (89.5%) | 15 (93.8%) |
| 65 to 74 Years | 26 (100.0%) | 25 (100.0%) |
| 75 Years and over | 8 (100.0%) | 10 (66.7%) |
| Total | 230 (91.6%) | 257 (92.1%) |
Income Below Poverty Among Married-Couple Families in Ravenwood
The poverty statistics for married-couple families in Ravenwood show that 2.9% or 3 of the total 102 families live below the poverty line. Families with no children have the highest poverty rate of 4.1%, comprising of 2 families. On the other hand, families with 3 or 4 children have the lowest poverty rate of 0.0%, which includes 0 families.
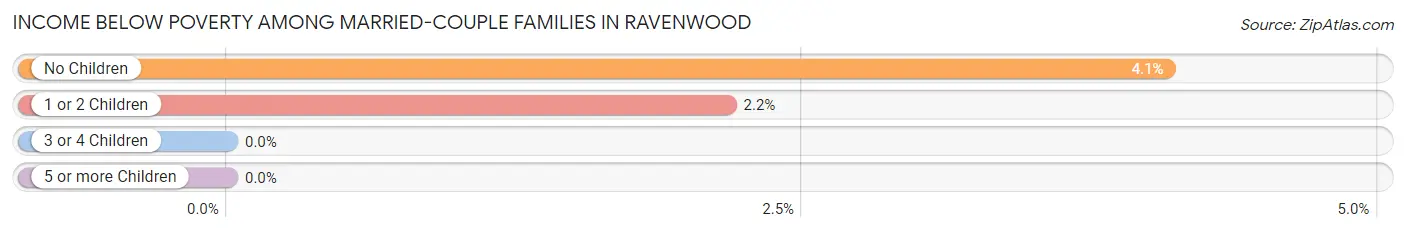
| Children | Above Poverty | Below Poverty |
| No Children | 47 (95.9%) | 2 (4.1%) |
| 1 or 2 Children | 45 (97.8%) | 1 (2.2%) |
| 3 or 4 Children | 7 (100.0%) | 0 (0.0%) |
| 5 or more Children | 0 (0.0%) | 0 (0.0%) |
| Total | 99 (97.1%) | 3 (2.9%) |
Income Below Poverty Among Single-Parent Households in Ravenwood
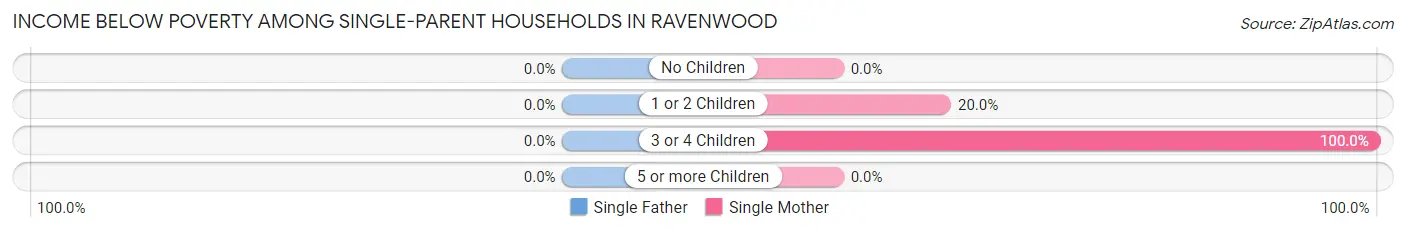
| Children | Single Father | Single Mother |
| No Children | 0 (0.0%) | 0 (0.0%) |
| 1 or 2 Children | 0 (0.0%) | 3 (20.0%) |
| 3 or 4 Children | 0 (0.0%) | 1 (100.0%) |
| 5 or more Children | 0 (0.0%) | 0 (0.0%) |
| Total | 0 (0.0%) | 4 (25.0%) |
Income Below Poverty Among Married-Couple vs Single-Parent Households in Ravenwood
The poverty data for Ravenwood shows that 3 of the married-couple family households (2.9%) and 4 of the single-parent households (20.0%) are living below the poverty level. Within the married-couple family households, those with no children have the highest poverty rate, with 2 households (4.1%) falling below the poverty line. Among the single-parent households, those with 3 or 4 children have the highest poverty rate, with 1 household (100.0%) living below poverty.
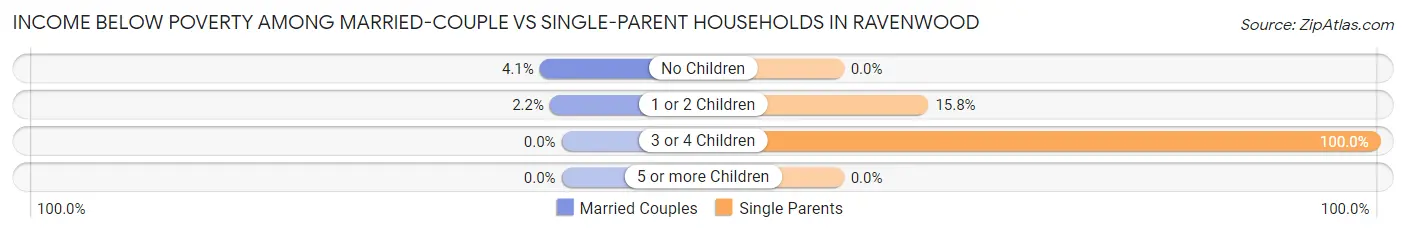
| Children | Married-Couple Families | Single-Parent Households |
| No Children | 2 (4.1%) | 0 (0.0%) |
| 1 or 2 Children | 1 (2.2%) | 3 (15.8%) |
| 3 or 4 Children | 0 (0.0%) | 1 (100.0%) |
| 5 or more Children | 0 (0.0%) | 0 (0.0%) |
| Total | 3 (2.9%) | 4 (20.0%) |
Race in Ravenwood
The most populous races in Ravenwood are White / Caucasian (520 | 98.1%), Two or more Races (5 | 0.9%), and Black / African American (3 | 0.6%).
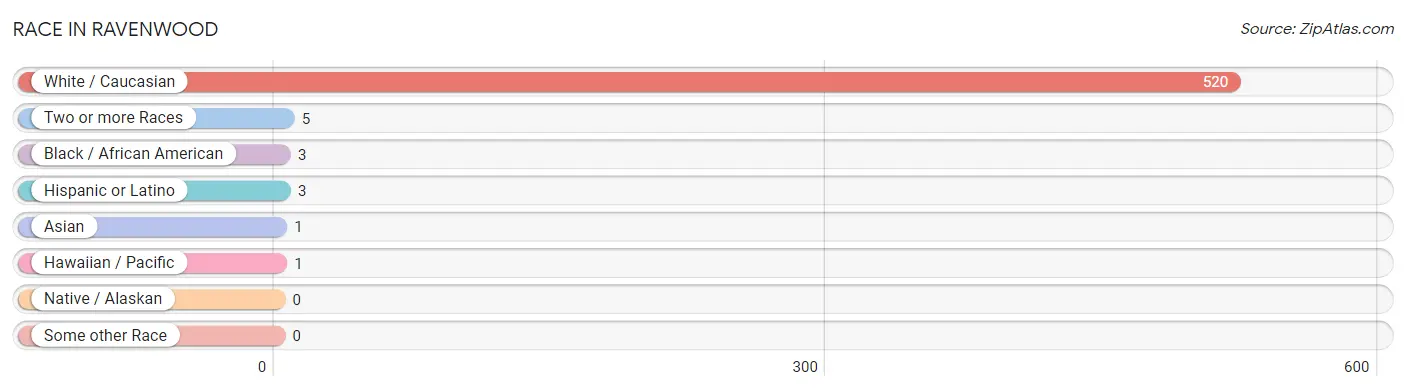
| Race | # Population | % Population |
| Asian | 1 | 0.2% |
| Black / African American | 3 | 0.6% |
| Hawaiian / Pacific | 1 | 0.2% |
| Hispanic or Latino | 3 | 0.6% |
| Native / Alaskan | 0 | 0.0% |
| White / Caucasian | 520 | 98.1% |
| Two or more Races | 5 | 0.9% |
| Some other Race | 0 | 0.0% |
| Total | 530 | 100.0% |
Ancestry in Ravenwood
The most populous ancestries reported in Ravenwood are German (199 | 37.6%), Irish (152 | 28.7%), American (50 | 9.4%), English (42 | 7.9%), and Italian (14 | 2.6%), together accounting for 86.2% of all Ravenwood residents.
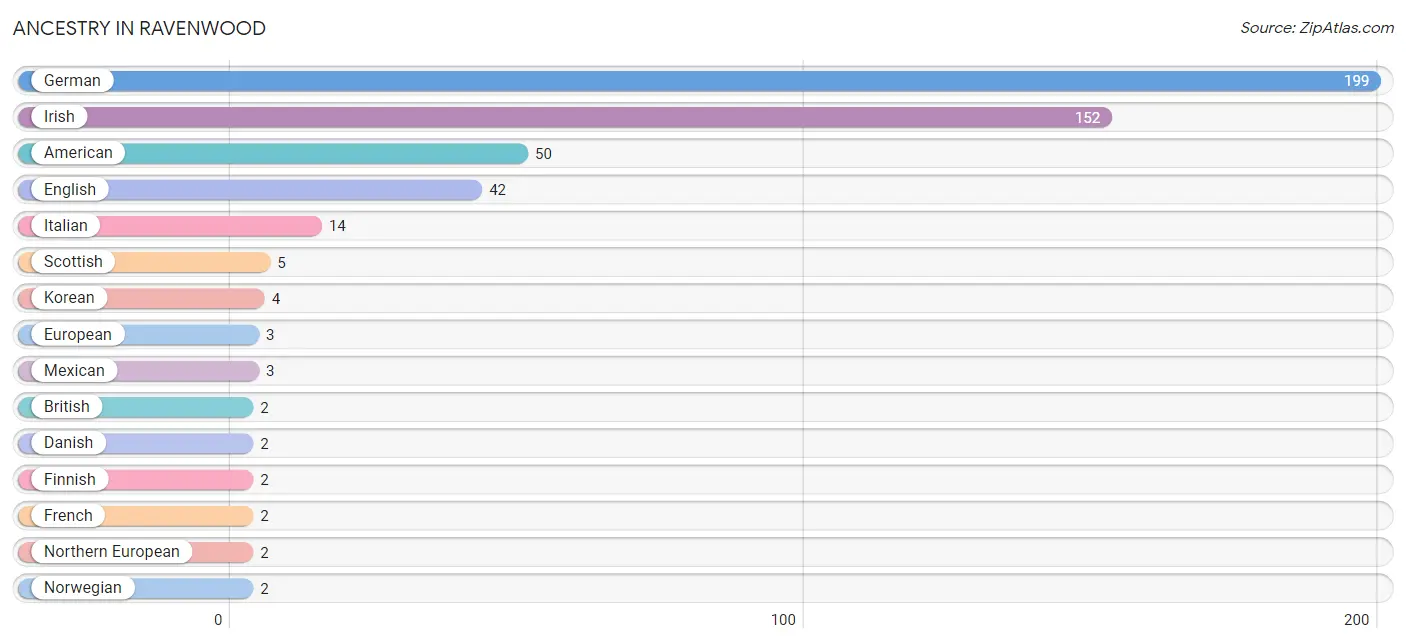
| Ancestry | # Population | % Population |
| American | 50 | 9.4% |
| British | 2 | 0.4% |
| Danish | 2 | 0.4% |
| English | 42 | 7.9% |
| European | 3 | 0.6% |
| Finnish | 2 | 0.4% |
| French | 2 | 0.4% |
| German | 199 | 37.6% |
| Irish | 152 | 28.7% |
| Italian | 14 | 2.6% |
| Korean | 4 | 0.7% |
| Mexican | 3 | 0.6% |
| Northern European | 2 | 0.4% |
| Norwegian | 2 | 0.4% |
| Samoan | 1 | 0.2% |
| Scotch-Irish | 2 | 0.4% |
| Scottish | 5 | 0.9% |
| Swedish | 1 | 0.2% |
| Swiss | 2 | 0.4% |
| Welsh | 2 | 0.4% | View All 20 Rows |
Immigrants in Ravenwood
The most numerous immigrant groups reported in Ravenwood came from Asia (3 | 0.6%), Philippines (3 | 0.6%), South Eastern Asia (3 | 0.6%), Europe (2 | 0.4%), and Northern Europe (2 | 0.4%), together accounting for 2.5% of all Ravenwood residents.
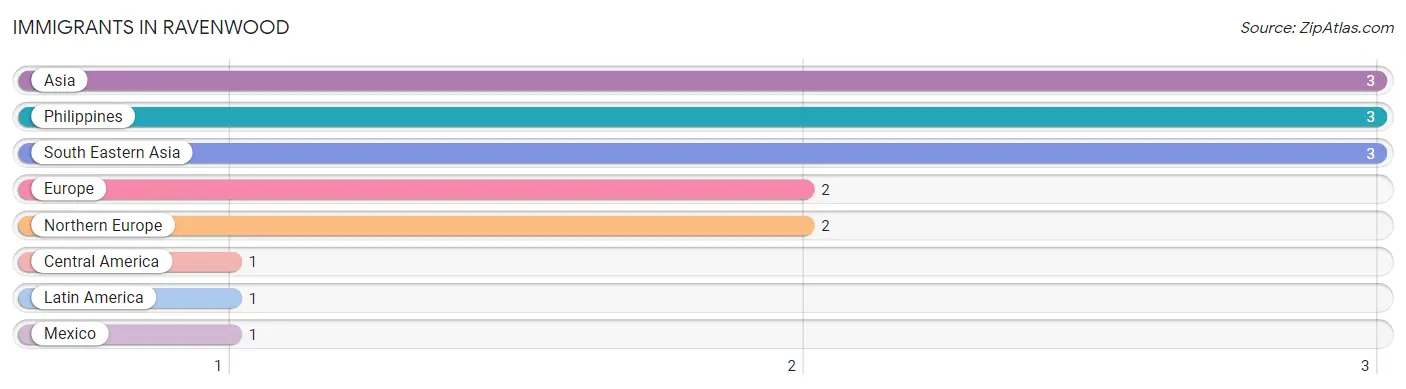
| Immigration Origin | # Population | % Population |
| Asia | 3 | 0.6% |
| Central America | 1 | 0.2% |
| Europe | 2 | 0.4% |
| Latin America | 1 | 0.2% |
| Mexico | 1 | 0.2% |
| Northern Europe | 2 | 0.4% |
| Philippines | 3 | 0.6% |
| South Eastern Asia | 3 | 0.6% | View All 8 Rows |
Sex and Age in Ravenwood
Sex and Age in Ravenwood
The most populous age groups in Ravenwood are 10 to 14 Years (49 | 19.5%) for men and 35 to 39 Years (75 | 26.9%) for women.
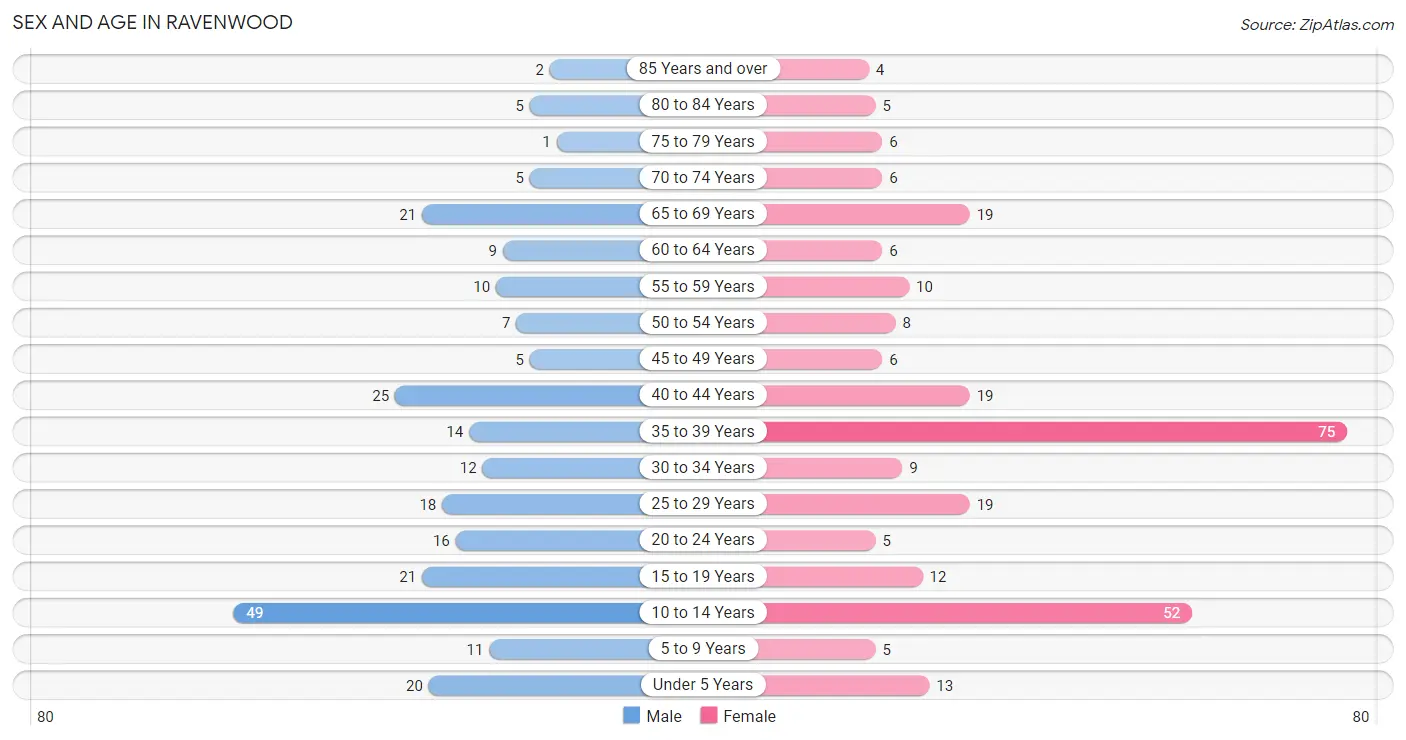
| Age Bracket | Male | Female |
| Under 5 Years | 20 (8.0%) | 13 (4.7%) |
| 5 to 9 Years | 11 (4.4%) | 5 (1.8%) |
| 10 to 14 Years | 49 (19.5%) | 52 (18.6%) |
| 15 to 19 Years | 21 (8.4%) | 12 (4.3%) |
| 20 to 24 Years | 16 (6.4%) | 5 (1.8%) |
| 25 to 29 Years | 18 (7.2%) | 19 (6.8%) |
| 30 to 34 Years | 12 (4.8%) | 9 (3.2%) |
| 35 to 39 Years | 14 (5.6%) | 75 (26.9%) |
| 40 to 44 Years | 25 (10.0%) | 19 (6.8%) |
| 45 to 49 Years | 5 (2.0%) | 6 (2.1%) |
| 50 to 54 Years | 7 (2.8%) | 8 (2.9%) |
| 55 to 59 Years | 10 (4.0%) | 10 (3.6%) |
| 60 to 64 Years | 9 (3.6%) | 6 (2.1%) |
| 65 to 69 Years | 21 (8.4%) | 19 (6.8%) |
| 70 to 74 Years | 5 (2.0%) | 6 (2.1%) |
| 75 to 79 Years | 1 (0.4%) | 6 (2.1%) |
| 80 to 84 Years | 5 (2.0%) | 5 (1.8%) |
| 85 Years and over | 2 (0.8%) | 4 (1.4%) |
| Total | 251 (100.0%) | 279 (100.0%) |
Families and Households in Ravenwood
Median Family Size in Ravenwood
The median family size in Ravenwood is 3.65 persons per family, with married-couple families (102 | 83.6%) accounting for the largest median family size of 3.84 persons per family. On the other hand, single male/father families (4 | 3.3%) represent the smallest median family size with 2.50 persons per family.
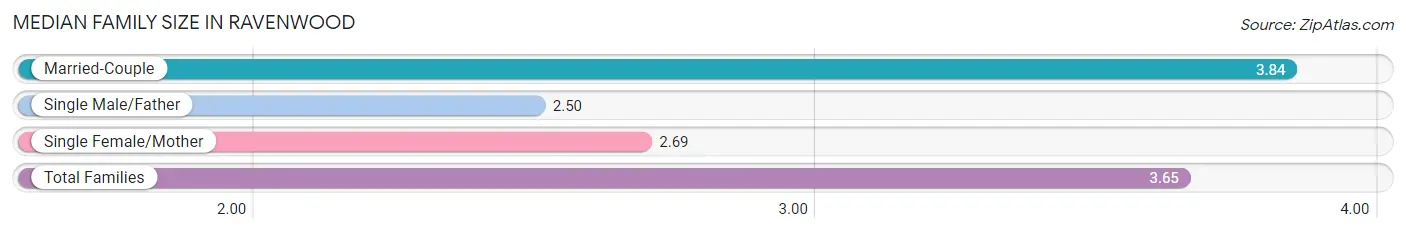
| Family Type | # Families | Family Size |
| Married-Couple | 102 (83.6%) | 3.84 |
| Single Male/Father | 4 (3.3%) | 2.50 |
| Single Female/Mother | 16 (13.1%) | 2.69 |
| Total Families | 122 (100.0%) | 3.65 |
Median Household Size in Ravenwood
The median household size in Ravenwood is 2.82 persons per household, with single male/father households (4 | 2.1%) accounting for the largest median household size of 4.5 persons per household. non-family households (66 | 35.1%) represent the smallest median household size with 1.14 persons per household.
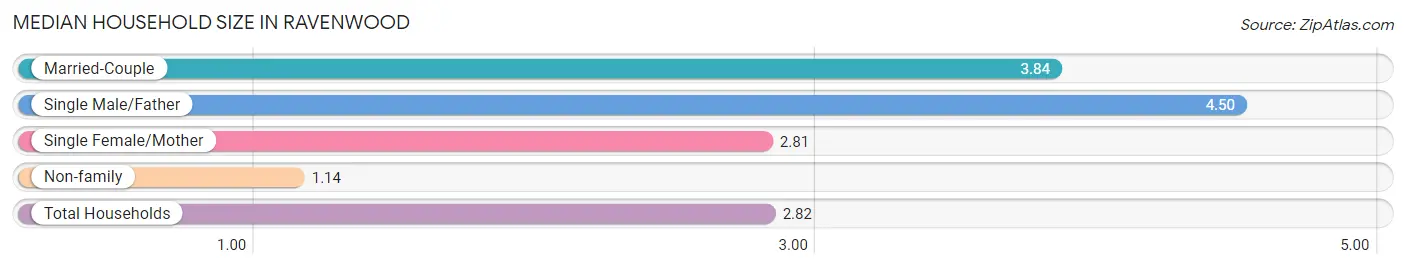
| Household Type | # Households | Household Size |
| Married-Couple | 102 (54.3%) | 3.84 |
| Single Male/Father | 4 (2.1%) | 4.50 |
| Single Female/Mother | 16 (8.5%) | 2.81 |
| Non-family | 66 (35.1%) | 1.14 |
| Total Households | 188 (100.0%) | 2.82 |
Household Size by Marriage Status in Ravenwood
Out of a total of 188 households in Ravenwood, 122 (64.9%) are family households, while 66 (35.1%) are nonfamily households. The most numerous type of family households are 2-person households, comprising 48, and the most common type of nonfamily households are 1-person households, comprising 55.
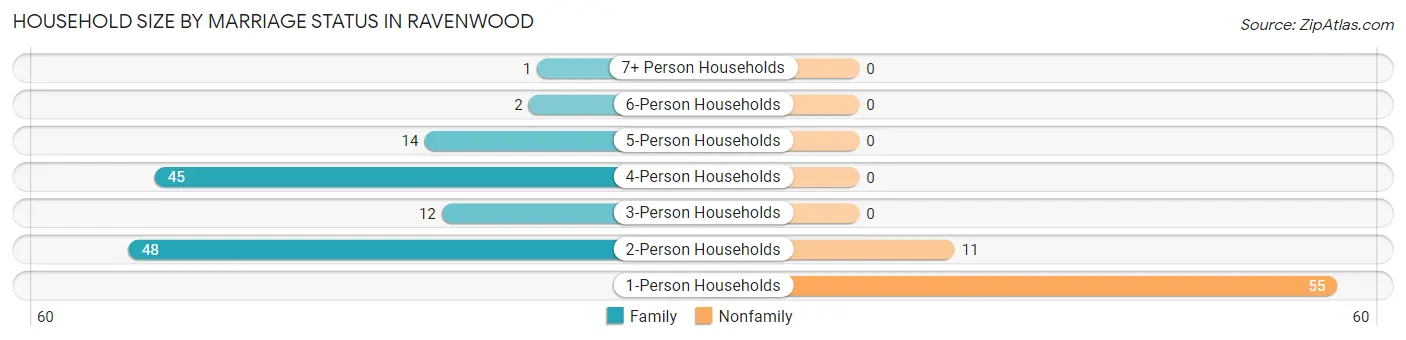
| Household Size | Family Households | Nonfamily Households |
| 1-Person Households | - | 55 (29.3%) |
| 2-Person Households | 48 (25.5%) | 11 (5.9%) |
| 3-Person Households | 12 (6.4%) | 0 (0.0%) |
| 4-Person Households | 45 (23.9%) | 0 (0.0%) |
| 5-Person Households | 14 (7.4%) | 0 (0.0%) |
| 6-Person Households | 2 (1.1%) | 0 (0.0%) |
| 7+ Person Households | 1 (0.5%) | 0 (0.0%) |
| Total | 122 (64.9%) | 66 (35.1%) |
Female Fertility in Ravenwood
Fertility by Age in Ravenwood
Average fertility rate in Ravenwood is 7.0 births per 1,000 women. Women in the age bracket of 35 to 50 years have the highest fertility rate with 10.0 births per 1,000 women. Women in the age bracket of 35 to 50 years acount for 100.0% of all women with births.
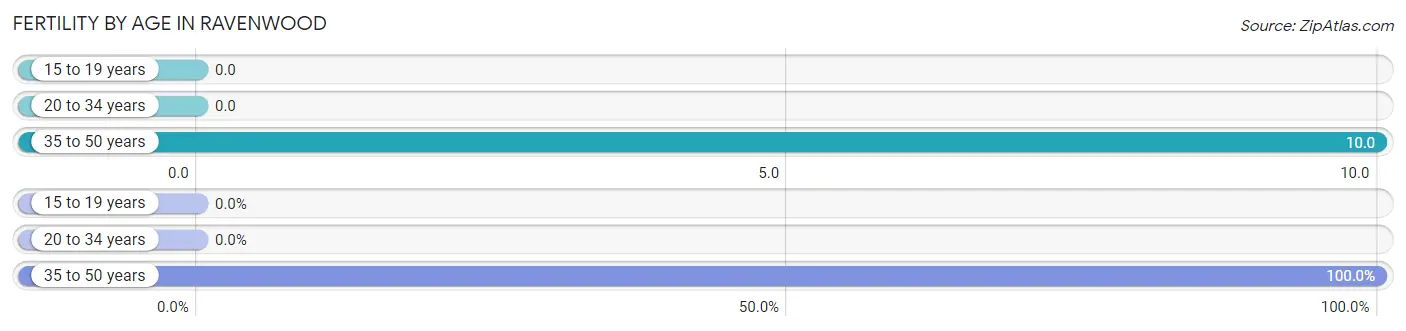
| Age Bracket | Women with Births | Births / 1,000 Women |
| 15 to 19 years | 0 (0.0%) | 0.0 |
| 20 to 34 years | 0 (0.0%) | 0.0 |
| 35 to 50 years | 1 (100.0%) | 10.0 |
| Total | 1 (100.0%) | 7.0 |
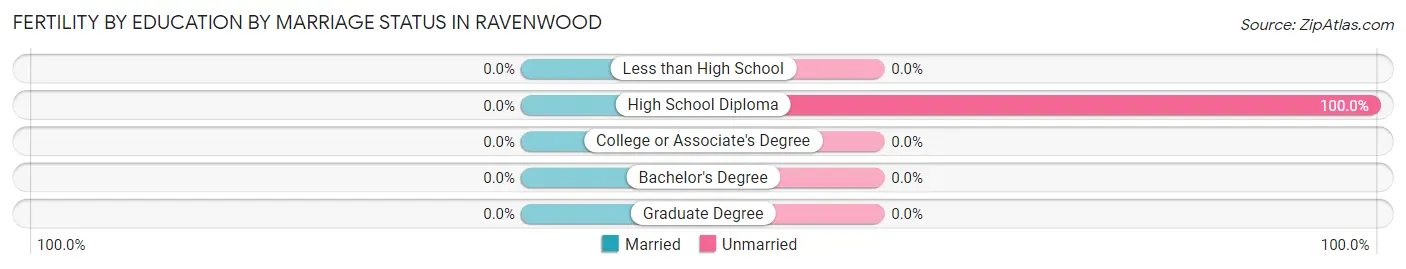
Fertility by Age by Marriage Status in Ravenwood
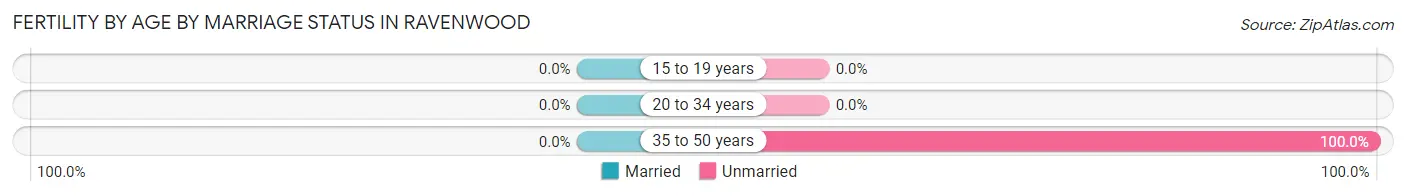
| Age Bracket | Married | Unmarried |
| 15 to 19 years | 0 (0.0%) | 0 (0.0%) |
| 20 to 34 years | 0 (0.0%) | 0 (0.0%) |
| 35 to 50 years | 0 (0.0%) | 1 (100.0%) |
| Total | 0 (0.0%) | 1 (100.0%) |
Fertility by Education in Ravenwood
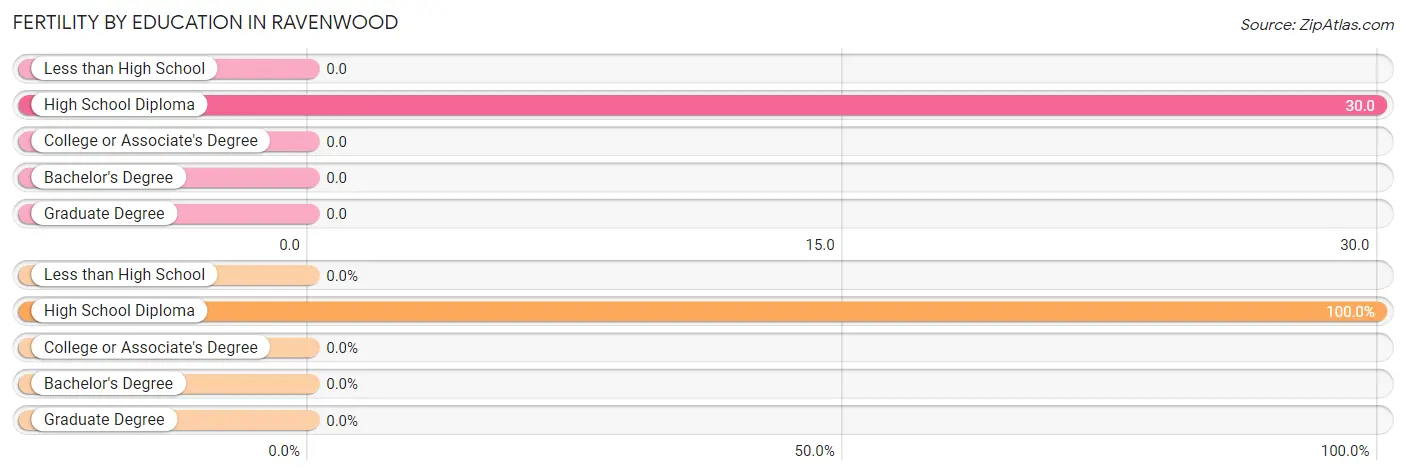
| Educational Attainment | Women with Births | Births / 1,000 Women |
| Less than High School | 0 (0.0%) | 0.0 |
| High School Diploma | 1 (100.0%) | 30.0 |
| College or Associate's Degree | 0 (0.0%) | 0.0 |
| Bachelor's Degree | 0 (0.0%) | 0.0 |
| Graduate Degree | 0 (0.0%) | 0.0 |
| Total | 1 (100.0%) | 7.0 |
Fertility by Education by Marriage Status in Ravenwood
| Educational Attainment | Married | Unmarried |
| Less than High School | 0 (0.0%) | 0 (0.0%) |
| High School Diploma | 0 (0.0%) | 1 (100.0%) |
| College or Associate's Degree | 0 (0.0%) | 0 (0.0%) |
| Bachelor's Degree | 0 (0.0%) | 0 (0.0%) |
| Graduate Degree | 0 (0.0%) | 0 (0.0%) |
| Total | 0 (0.0%) | 1 (100.0%) |
Employment Characteristics in Ravenwood
Employment by Class of Employer in Ravenwood
Among the 190 employed individuals in Ravenwood, private company employees (138 | 72.6%), state government employees (19 | 10.0%), and not-for-profit organizations (16 | 8.4%) make up the most common classes of employment.
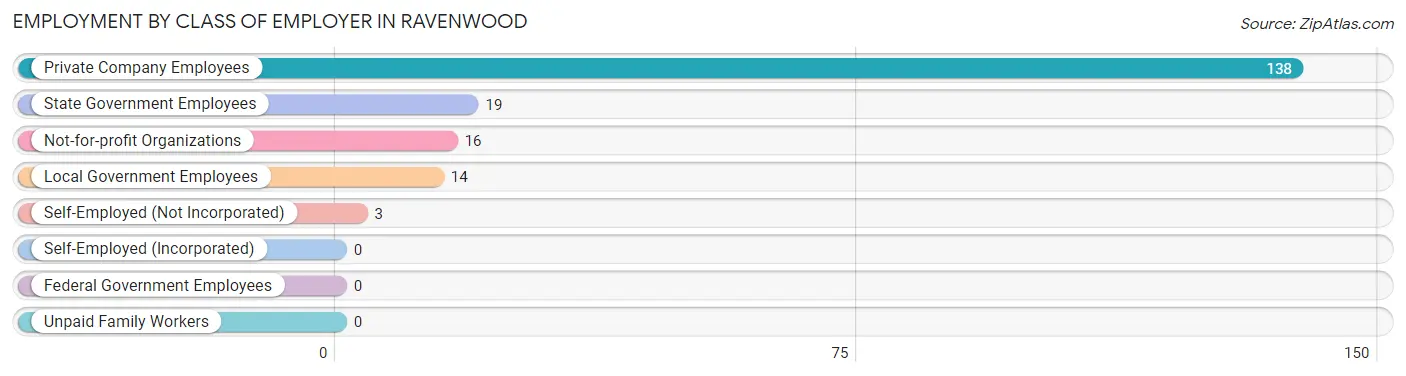
| Employer Class | # Employees | % Employees |
| Private Company Employees | 138 | 72.6% |
| Self-Employed (Incorporated) | 0 | 0.0% |
| Self-Employed (Not Incorporated) | 3 | 1.6% |
| Not-for-profit Organizations | 16 | 8.4% |
| Local Government Employees | 14 | 7.4% |
| State Government Employees | 19 | 10.0% |
| Federal Government Employees | 0 | 0.0% |
| Unpaid Family Workers | 0 | 0.0% |
| Total | 190 | 100.0% |
Employment Status by Age in Ravenwood
According to the labor force statistics for Ravenwood, out of the total population over 16 years of age (371), 52.6% or 195 individuals are in the labor force, with 2.6% or 5 of them unemployed. The age group with the highest labor force participation rate is 25 to 29 years, with 94.6% or 35 individuals in the labor force. Within the labor force, the 16 to 19 years age range has the highest percentage of unemployed individuals, with 14.3% or 1 of them being unemployed.
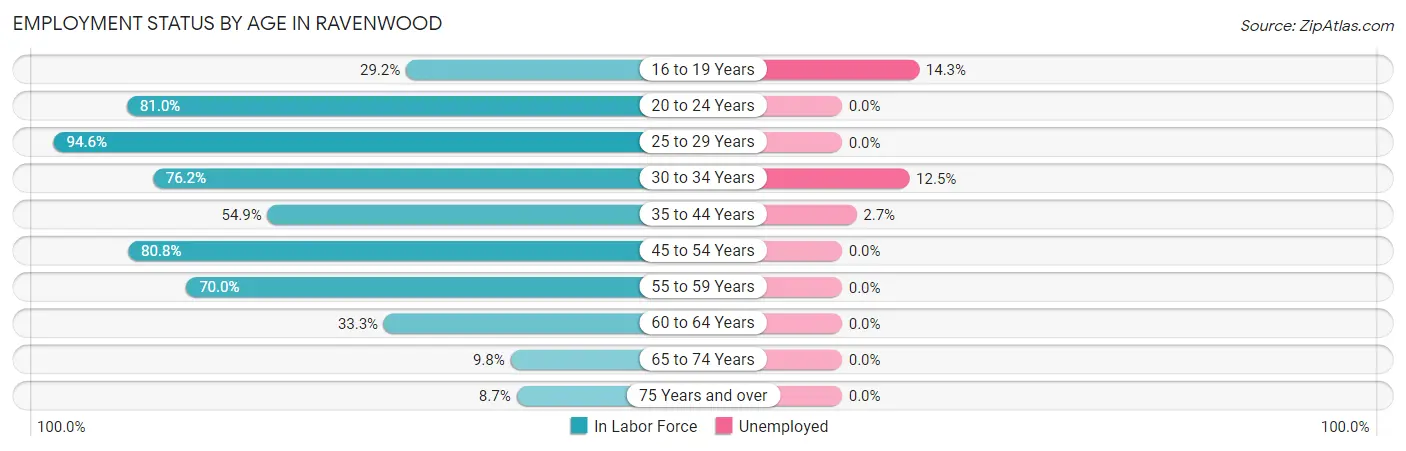
| Age Bracket | In Labor Force | Unemployed |
| 16 to 19 Years | 7 (29.2%) | 1 (14.3%) |
| 20 to 24 Years | 17 (81.0%) | 0 (0.0%) |
| 25 to 29 Years | 35 (94.6%) | 0 (0.0%) |
| 30 to 34 Years | 16 (76.2%) | 2 (12.5%) |
| 35 to 44 Years | 73 (54.9%) | 2 (2.7%) |
| 45 to 54 Years | 21 (80.8%) | 0 (0.0%) |
| 55 to 59 Years | 14 (70.0%) | 0 (0.0%) |
| 60 to 64 Years | 5 (33.3%) | 0 (0.0%) |
| 65 to 74 Years | 5 (9.8%) | 0 (0.0%) |
| 75 Years and over | 2 (8.7%) | 0 (0.0%) |
| Total | 195 (52.6%) | 5 (2.6%) |
Employment Status by Educational Attainment in Ravenwood
According to labor force statistics for Ravenwood, 65.1% of individuals (164) out of the total population between 25 and 64 years of age (252) are in the labor force, with 2.4% or 4 of them being unemployed. The group with the highest labor force participation rate are those with the educational attainment of less than high school, with 92.3% or 12 individuals in the labor force. Within the labor force, individuals with less than high school education have the highest percentage of unemployment, with 16.7% or 2 of them being unemployed.
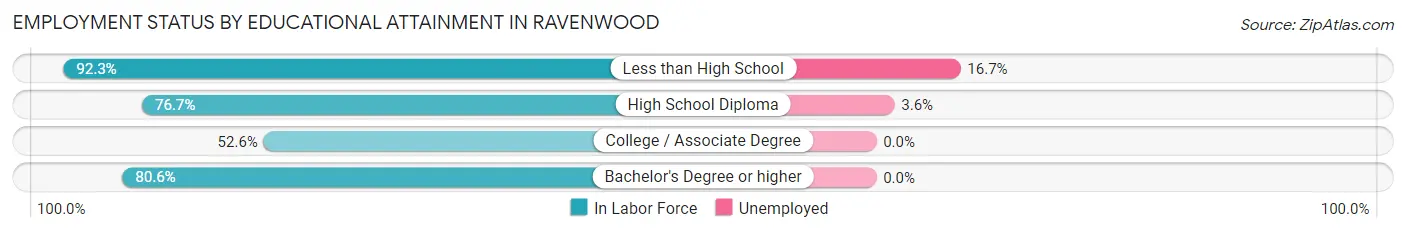
| Educational Attainment | In Labor Force | Unemployed |
| Less than High School | 12 (92.3%) | 2 (16.7%) |
| High School Diploma | 56 (76.7%) | 3 (3.6%) |
| College / Associate Degree | 71 (52.6%) | 0 (0.0%) |
| Bachelor's Degree or higher | 25 (80.6%) | 0 (0.0%) |
| Total | 164 (65.1%) | 6 (2.4%) |
Employment Occupations by Sex in Ravenwood
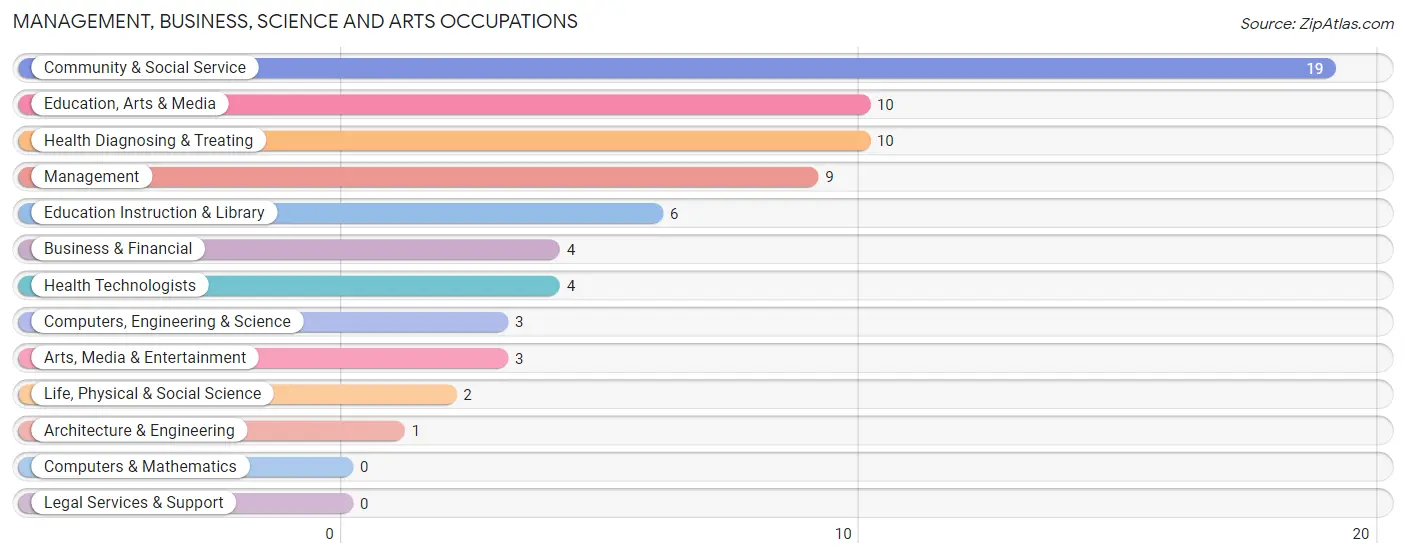
Management, Business, Science and Arts Occupations
The most common Management, Business, Science and Arts occupations in Ravenwood are Community & Social Service (19 | 10.0%), Education, Arts & Media (10 | 5.3%), Health Diagnosing & Treating (10 | 5.3%), Management (9 | 4.7%), and Education Instruction & Library (6 | 3.2%).
Management, Business, Science and Arts Occupations by Sex
Within the Management, Business, Science and Arts occupations in Ravenwood, the most male-oriented occupations are Computers, Engineering & Science (100.0%), Architecture & Engineering (100.0%), and Life, Physical & Social Science (100.0%), while the most female-oriented occupations are Business & Financial (100.0%), Health Technologists (100.0%), and Education, Arts & Media (70.0%).
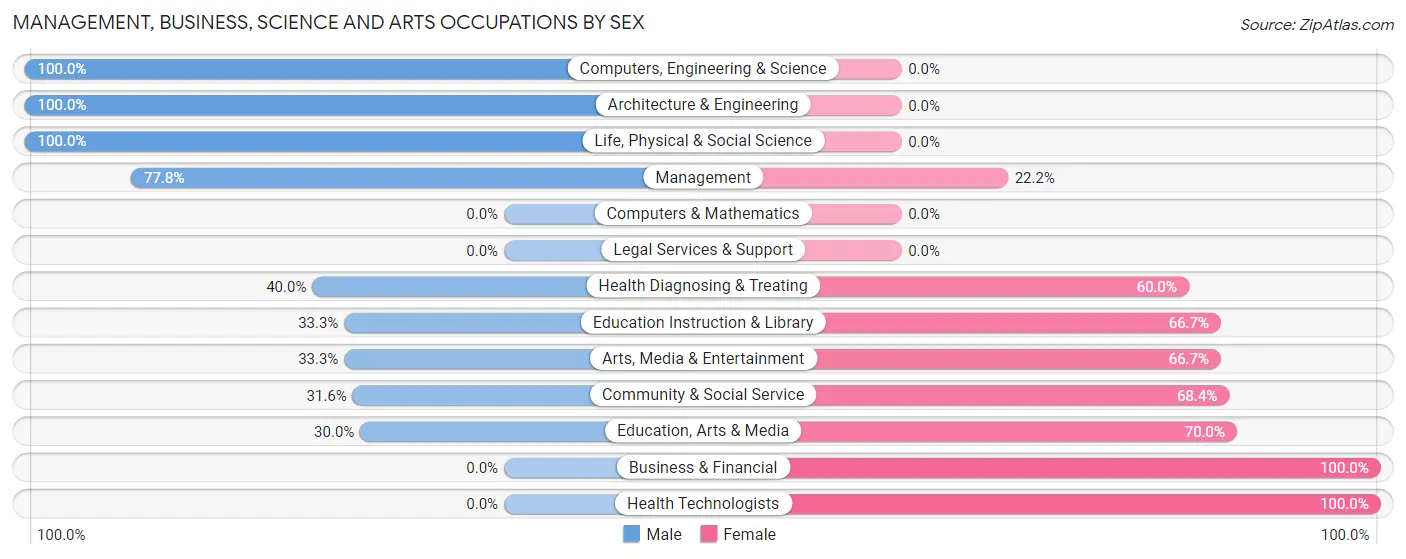
| Occupation | Male | Female |
| Management | 7 (77.8%) | 2 (22.2%) |
| Business & Financial | 0 (0.0%) | 4 (100.0%) |
| Computers, Engineering & Science | 3 (100.0%) | 0 (0.0%) |
| Computers & Mathematics | 0 (0.0%) | 0 (0.0%) |
| Architecture & Engineering | 1 (100.0%) | 0 (0.0%) |
| Life, Physical & Social Science | 2 (100.0%) | 0 (0.0%) |
| Community & Social Service | 6 (31.6%) | 13 (68.4%) |
| Education, Arts & Media | 3 (30.0%) | 7 (70.0%) |
| Legal Services & Support | 0 (0.0%) | 0 (0.0%) |
| Education Instruction & Library | 2 (33.3%) | 4 (66.7%) |
| Arts, Media & Entertainment | 1 (33.3%) | 2 (66.7%) |
| Health Diagnosing & Treating | 4 (40.0%) | 6 (60.0%) |
| Health Technologists | 0 (0.0%) | 4 (100.0%) |
| Total (Category) | 20 (44.4%) | 25 (55.6%) |
| Total (Overall) | 101 (53.2%) | 89 (46.8%) |
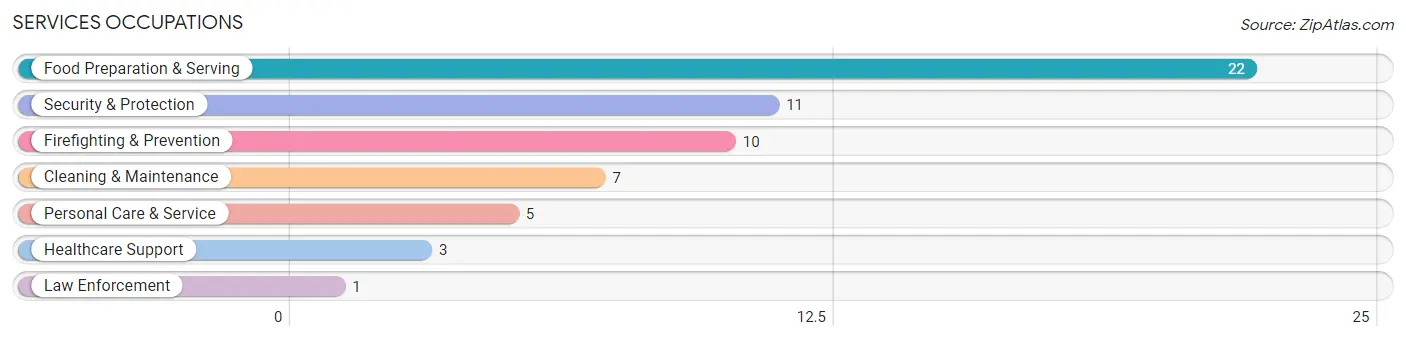
Services Occupations
The most common Services occupations in Ravenwood are Food Preparation & Serving (22 | 11.6%), Security & Protection (11 | 5.8%), Firefighting & Prevention (10 | 5.3%), Cleaning & Maintenance (7 | 3.7%), and Personal Care & Service (5 | 2.6%).
Services Occupations by Sex
Within the Services occupations in Ravenwood, the most male-oriented occupations are Firefighting & Prevention (100.0%), Security & Protection (90.9%), and Cleaning & Maintenance (57.1%), while the most female-oriented occupations are Healthcare Support (100.0%), Law Enforcement (100.0%), and Personal Care & Service (100.0%).
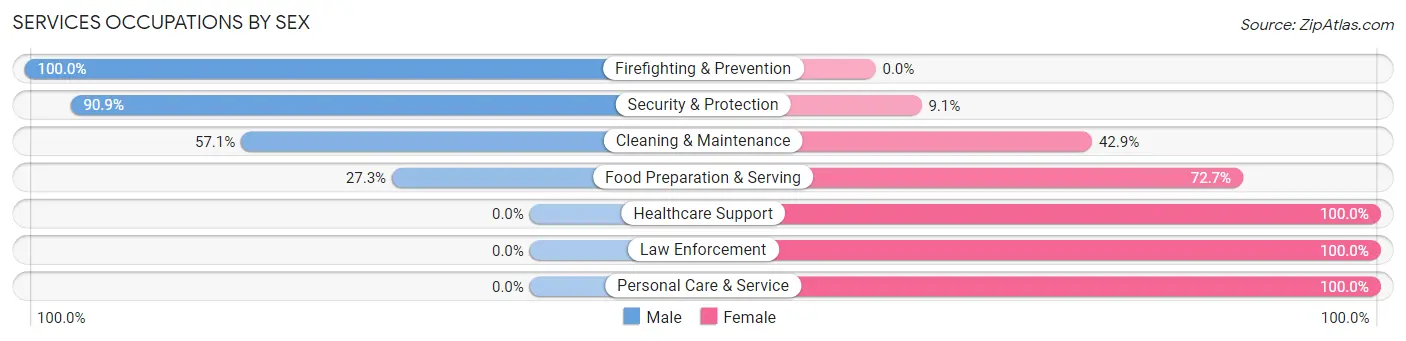
| Occupation | Male | Female |
| Healthcare Support | 0 (0.0%) | 3 (100.0%) |
| Security & Protection | 10 (90.9%) | 1 (9.1%) |
| Firefighting & Prevention | 10 (100.0%) | 0 (0.0%) |
| Law Enforcement | 0 (0.0%) | 1 (100.0%) |
| Food Preparation & Serving | 6 (27.3%) | 16 (72.7%) |
| Cleaning & Maintenance | 4 (57.1%) | 3 (42.9%) |
| Personal Care & Service | 0 (0.0%) | 5 (100.0%) |
| Total (Category) | 20 (41.7%) | 28 (58.3%) |
| Total (Overall) | 101 (53.2%) | 89 (46.8%) |
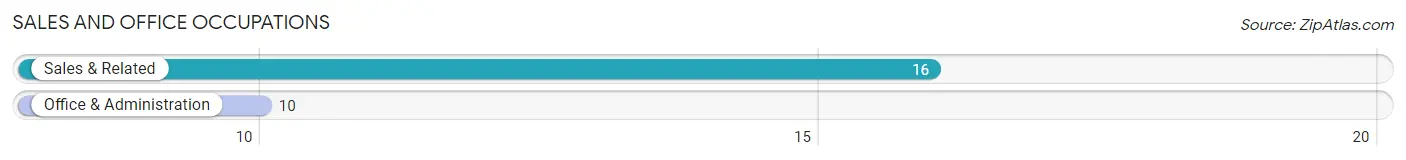
Sales and Office Occupations
The most common Sales and Office occupations in Ravenwood are Sales & Related (16 | 8.4%), and Office & Administration (10 | 5.3%).
Sales and Office Occupations by Sex
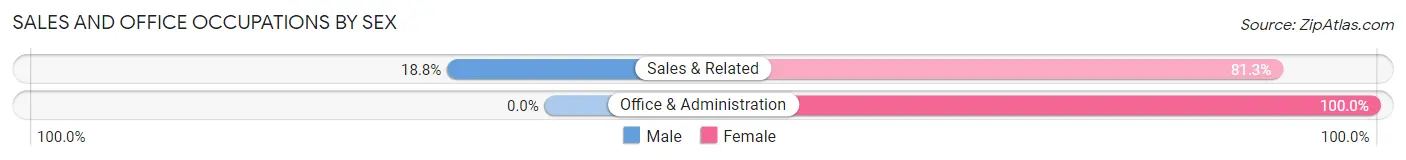
| Occupation | Male | Female |
| Sales & Related | 3 (18.8%) | 13 (81.2%) |
| Office & Administration | 0 (0.0%) | 10 (100.0%) |
| Total (Category) | 3 (11.5%) | 23 (88.5%) |
| Total (Overall) | 101 (53.2%) | 89 (46.8%) |
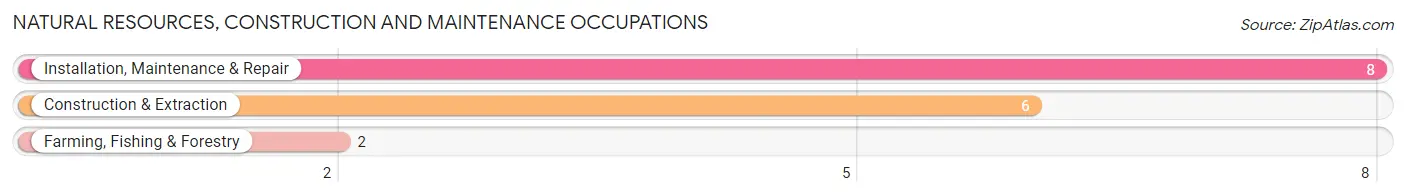
Natural Resources, Construction and Maintenance Occupations
The most common Natural Resources, Construction and Maintenance occupations in Ravenwood are Installation, Maintenance & Repair (8 | 4.2%), Construction & Extraction (6 | 3.2%), and Farming, Fishing & Forestry (2 | 1.1%).
Natural Resources, Construction and Maintenance Occupations by Sex
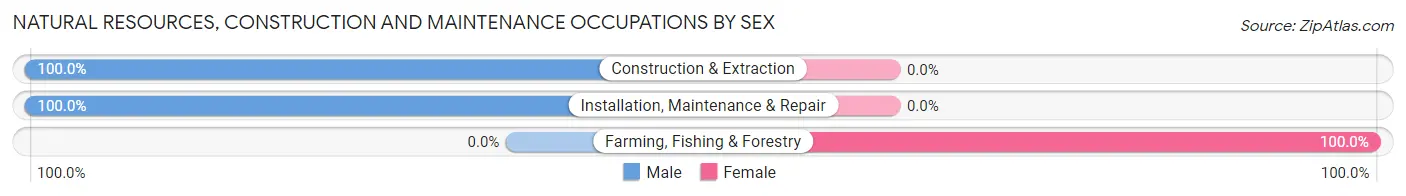
| Occupation | Male | Female |
| Farming, Fishing & Forestry | 0 (0.0%) | 2 (100.0%) |
| Construction & Extraction | 6 (100.0%) | 0 (0.0%) |
| Installation, Maintenance & Repair | 8 (100.0%) | 0 (0.0%) |
| Total (Category) | 14 (87.5%) | 2 (12.5%) |
| Total (Overall) | 101 (53.2%) | 89 (46.8%) |
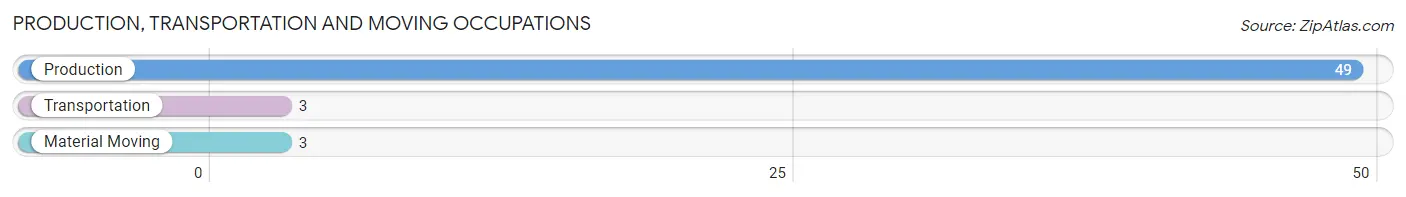
Production, Transportation and Moving Occupations
The most common Production, Transportation and Moving occupations in Ravenwood are Production (49 | 25.8%), Transportation (3 | 1.6%), and Material Moving (3 | 1.6%).
Production, Transportation and Moving Occupations by Sex
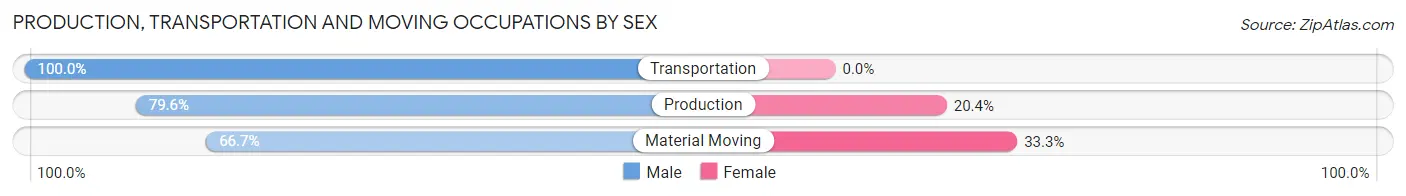
| Occupation | Male | Female |
| Production | 39 (79.6%) | 10 (20.4%) |
| Transportation | 3 (100.0%) | 0 (0.0%) |
| Material Moving | 2 (66.7%) | 1 (33.3%) |
| Total (Category) | 44 (80.0%) | 11 (20.0%) |
| Total (Overall) | 101 (53.2%) | 89 (46.8%) |
Employment Industries by Sex in Ravenwood
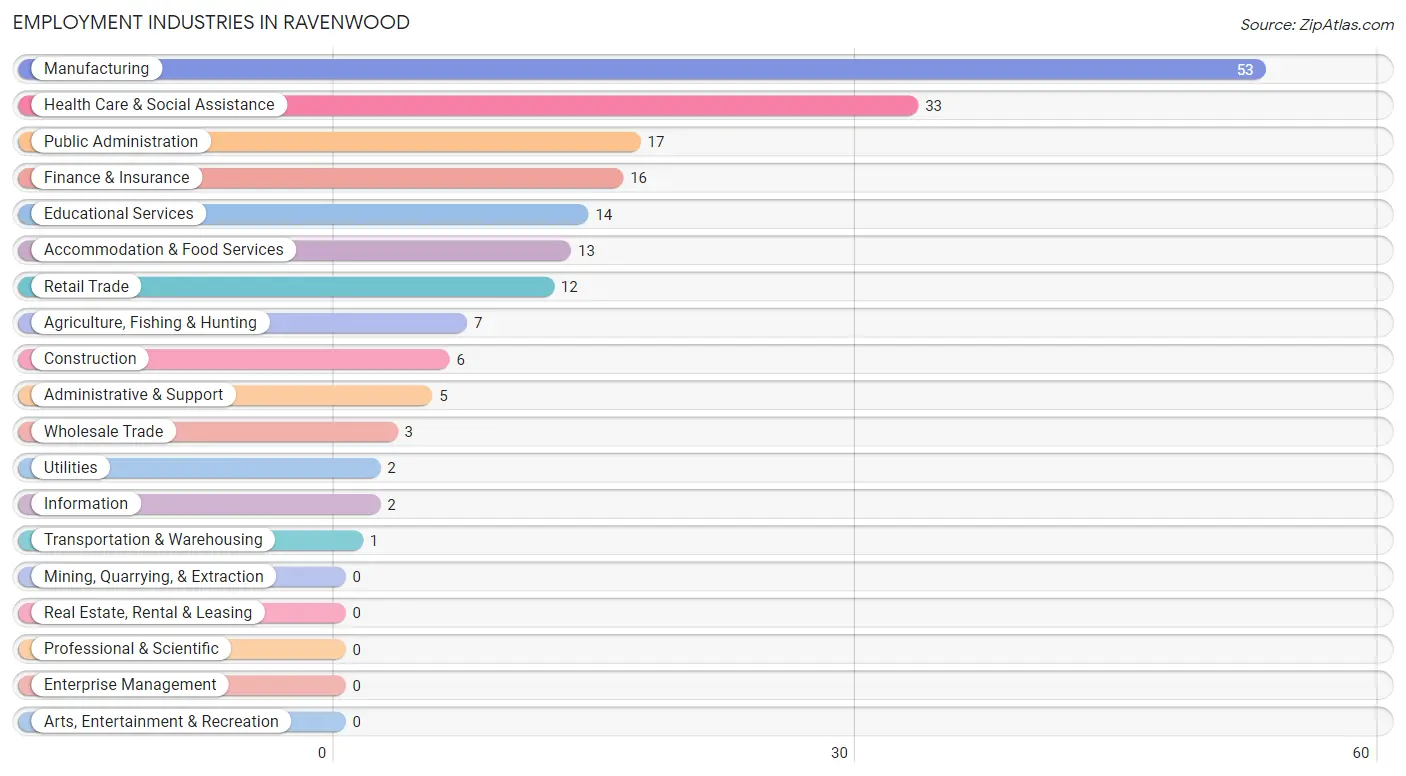
Employment Industries in Ravenwood
The major employment industries in Ravenwood include Manufacturing (53 | 27.9%), Health Care & Social Assistance (33 | 17.4%), Public Administration (17 | 8.9%), Finance & Insurance (16 | 8.4%), and Educational Services (14 | 7.4%).
Employment Industries by Sex in Ravenwood
The Ravenwood industries that see more men than women are Construction (100.0%), Wholesale Trade (100.0%), and Transportation & Warehousing (100.0%), whereas the industries that tend to have a higher number of women are Finance & Insurance (100.0%), Health Care & Social Assistance (87.9%), and Administrative & Support (80.0%).
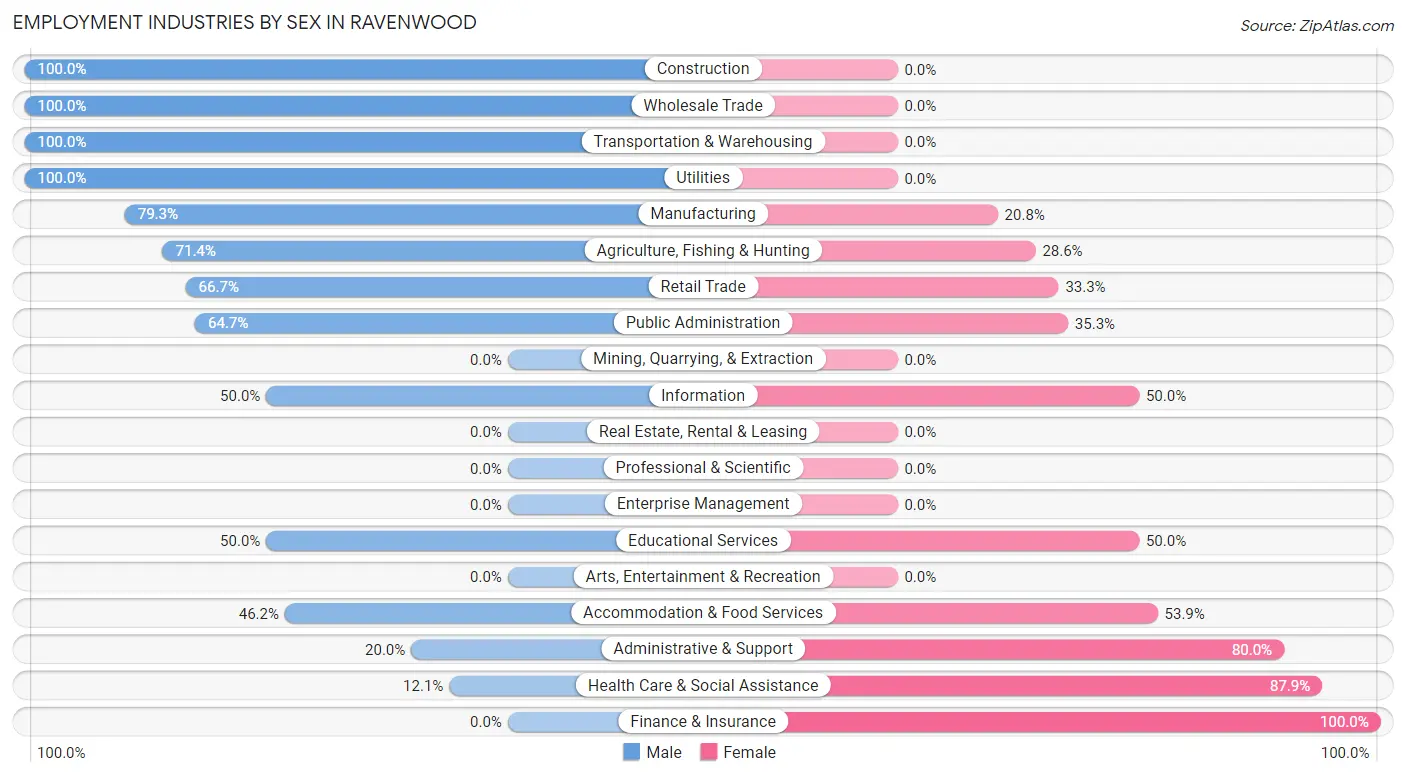
| Industry | Male | Female |
| Agriculture, Fishing & Hunting | 5 (71.4%) | 2 (28.6%) |
| Mining, Quarrying, & Extraction | 0 (0.0%) | 0 (0.0%) |
| Construction | 6 (100.0%) | 0 (0.0%) |
| Manufacturing | 42 (79.2%) | 11 (20.7%) |
| Wholesale Trade | 3 (100.0%) | 0 (0.0%) |
| Retail Trade | 8 (66.7%) | 4 (33.3%) |
| Transportation & Warehousing | 1 (100.0%) | 0 (0.0%) |
| Utilities | 2 (100.0%) | 0 (0.0%) |
| Information | 1 (50.0%) | 1 (50.0%) |
| Finance & Insurance | 0 (0.0%) | 16 (100.0%) |
| Real Estate, Rental & Leasing | 0 (0.0%) | 0 (0.0%) |
| Professional & Scientific | 0 (0.0%) | 0 (0.0%) |
| Enterprise Management | 0 (0.0%) | 0 (0.0%) |
| Administrative & Support | 1 (20.0%) | 4 (80.0%) |
| Educational Services | 7 (50.0%) | 7 (50.0%) |
| Health Care & Social Assistance | 4 (12.1%) | 29 (87.9%) |
| Arts, Entertainment & Recreation | 0 (0.0%) | 0 (0.0%) |
| Accommodation & Food Services | 6 (46.2%) | 7 (53.8%) |
| Public Administration | 11 (64.7%) | 6 (35.3%) |
| Total | 101 (53.2%) | 89 (46.8%) |
Education in Ravenwood
School Enrollment in Ravenwood
The most common levels of schooling among the 148 students in Ravenwood are middle school (89 | 60.1%), high school (33 | 22.3%), and kindergarten (9 | 6.1%).
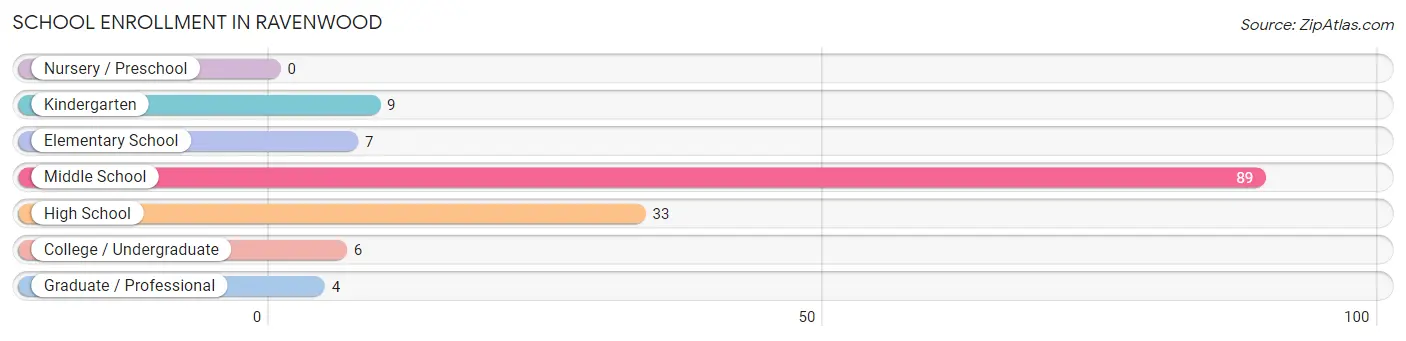
| School Level | # Students | % Students |
| Nursery / Preschool | 0 | 0.0% |
| Kindergarten | 9 | 6.1% |
| Elementary School | 7 | 4.7% |
| Middle School | 89 | 60.1% |
| High School | 33 | 22.3% |
| College / Undergraduate | 6 | 4.1% |
| Graduate / Professional | 4 | 2.7% |
| Total | 148 | 100.0% |
School Enrollment by Age by Funding Source in Ravenwood
Out of a total of 148 students who are enrolled in schools in Ravenwood, 33 (22.3%) attend a private institution, while the remaining 115 (77.7%) are enrolled in public schools. The age group of 10 to 14 year olds has the highest likelihood of being enrolled in private schools, with 32 (34.4% in the age bracket) enrolled. Conversely, the age group of 15 to 17 year olds has the lowest likelihood of being enrolled in a private school, with 24 (100.0% in the age bracket) attending a public institution.
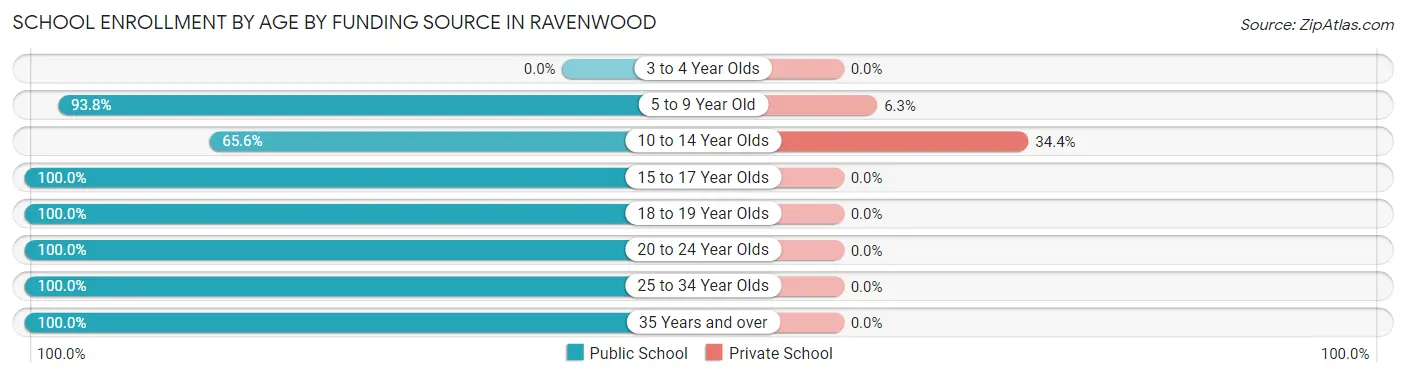
| Age Bracket | Public School | Private School |
| 3 to 4 Year Olds | 0 (0.0%) | 0 (0.0%) |
| 5 to 9 Year Old | 15 (93.8%) | 1 (6.2%) |
| 10 to 14 Year Olds | 61 (65.6%) | 32 (34.4%) |
| 15 to 17 Year Olds | 24 (100.0%) | 0 (0.0%) |
| 18 to 19 Year Olds | 6 (100.0%) | 0 (0.0%) |
| 20 to 24 Year Olds | 3 (100.0%) | 0 (0.0%) |
| 25 to 34 Year Olds | 3 (100.0%) | 0 (0.0%) |
| 35 Years and over | 3 (100.0%) | 0 (0.0%) |
| Total | 115 (77.7%) | 33 (22.3%) |
Educational Attainment by Field of Study in Ravenwood
Education (20 | 43.5%), bio, nature & agricultural (5 | 10.9%), social sciences (4 | 8.7%), science & technology (4 | 8.7%), and arts & humanities (4 | 8.7%) are the most common fields of study among 46 individuals in Ravenwood who have obtained a bachelor's degree or higher.
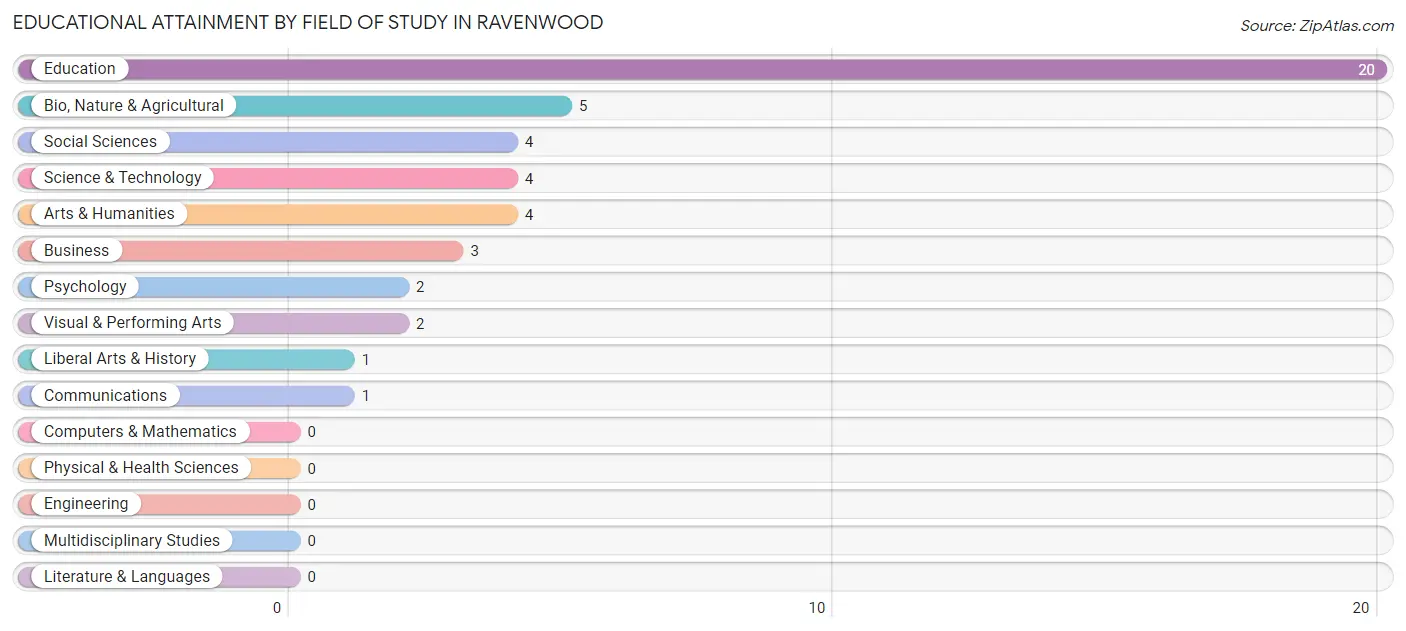
| Field of Study | # Graduates | % Graduates |
| Computers & Mathematics | 0 | 0.0% |
| Bio, Nature & Agricultural | 5 | 10.9% |
| Physical & Health Sciences | 0 | 0.0% |
| Psychology | 2 | 4.3% |
| Social Sciences | 4 | 8.7% |
| Engineering | 0 | 0.0% |
| Multidisciplinary Studies | 0 | 0.0% |
| Science & Technology | 4 | 8.7% |
| Business | 3 | 6.5% |
| Education | 20 | 43.5% |
| Literature & Languages | 0 | 0.0% |
| Liberal Arts & History | 1 | 2.2% |
| Visual & Performing Arts | 2 | 4.3% |
| Communications | 1 | 2.2% |
| Arts & Humanities | 4 | 8.7% |
| Total | 46 | 100.0% |
Transportation & Commute in Ravenwood
Vehicle Availability by Sex in Ravenwood
The most prevalent vehicle ownership categories in Ravenwood are males with 2 vehicles (45, accounting for 44.6%) and females with 2 vehicles (37, making up 50.6%).
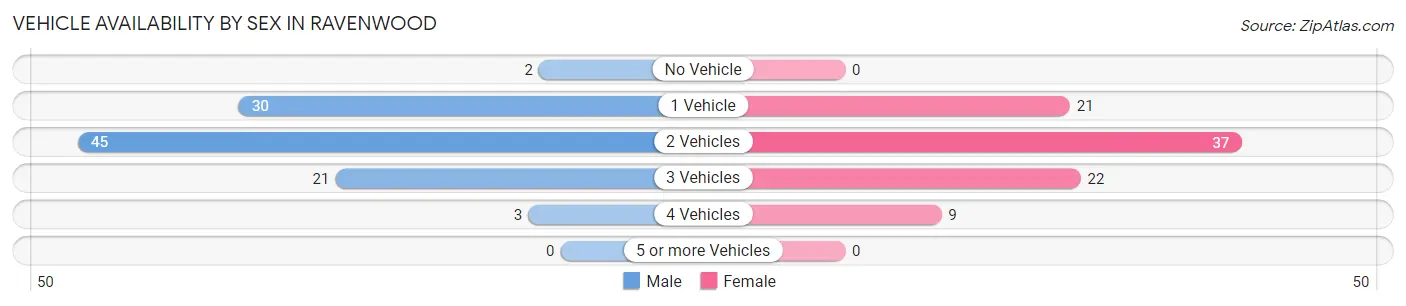
| Vehicles Available | Male | Female |
| No Vehicle | 2 (2.0%) | 0 (0.0%) |
| 1 Vehicle | 30 (29.7%) | 21 (23.6%) |
| 2 Vehicles | 45 (44.6%) | 37 (41.6%) |
| 3 Vehicles | 21 (20.8%) | 22 (24.7%) |
| 4 Vehicles | 3 (3.0%) | 9 (10.1%) |
| 5 or more Vehicles | 0 (0.0%) | 0 (0.0%) |
| Total | 101 (100.0%) | 89 (100.0%) |
Commute Time in Ravenwood
The most frequently occuring commute durations in Ravenwood are 15 to 19 minutes (54 commuters, 29.7%), 20 to 24 minutes (38 commuters, 20.9%), and 60 to 89 minutes (28 commuters, 15.4%).
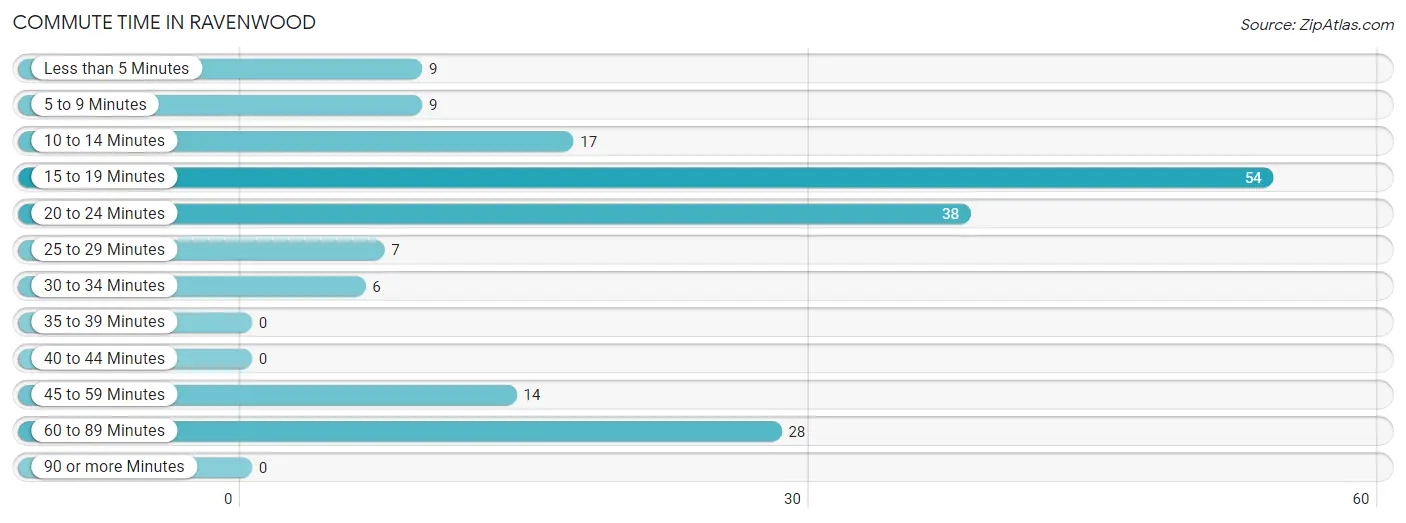
| Commute Time | # Commuters | % Commuters |
| Less than 5 Minutes | 9 | 5.0% |
| 5 to 9 Minutes | 9 | 5.0% |
| 10 to 14 Minutes | 17 | 9.3% |
| 15 to 19 Minutes | 54 | 29.7% |
| 20 to 24 Minutes | 38 | 20.9% |
| 25 to 29 Minutes | 7 | 3.8% |
| 30 to 34 Minutes | 6 | 3.3% |
| 35 to 39 Minutes | 0 | 0.0% |
| 40 to 44 Minutes | 0 | 0.0% |
| 45 to 59 Minutes | 14 | 7.7% |
| 60 to 89 Minutes | 28 | 15.4% |
| 90 or more Minutes | 0 | 0.0% |
Commute Time by Sex in Ravenwood
The most common commute times in Ravenwood are 60 to 89 minutes (23 commuters, 23.0%) for males and 15 to 19 minutes (32 commuters, 39.0%) for females.
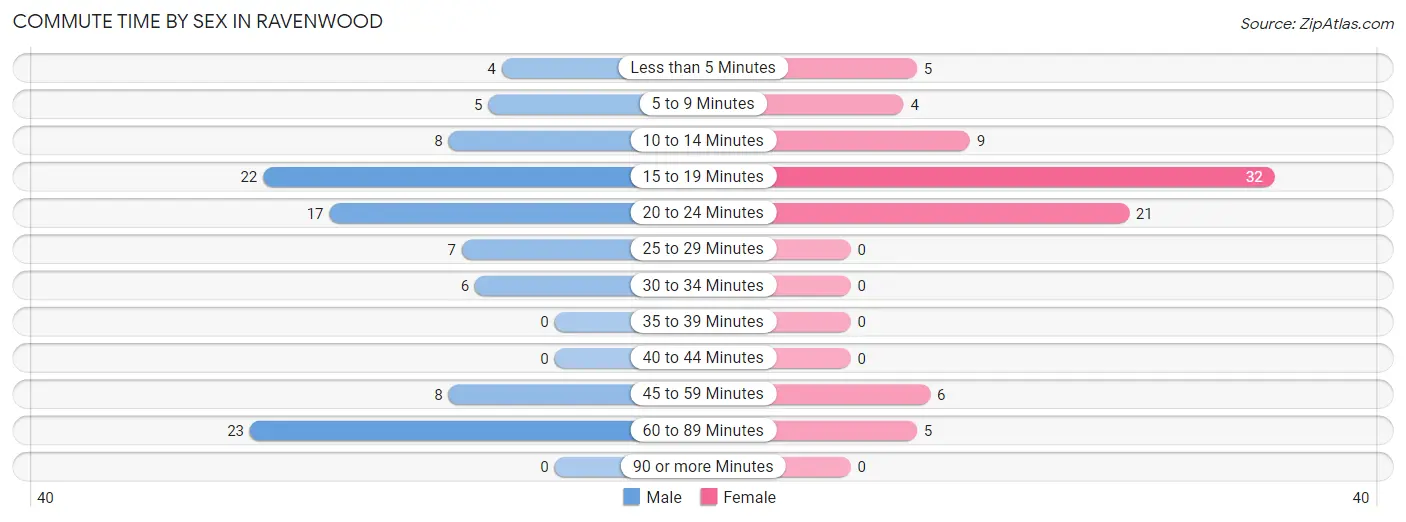
| Commute Time | Male | Female |
| Less than 5 Minutes | 4 (4.0%) | 5 (6.1%) |
| 5 to 9 Minutes | 5 (5.0%) | 4 (4.9%) |
| 10 to 14 Minutes | 8 (8.0%) | 9 (11.0%) |
| 15 to 19 Minutes | 22 (22.0%) | 32 (39.0%) |
| 20 to 24 Minutes | 17 (17.0%) | 21 (25.6%) |
| 25 to 29 Minutes | 7 (7.0%) | 0 (0.0%) |
| 30 to 34 Minutes | 6 (6.0%) | 0 (0.0%) |
| 35 to 39 Minutes | 0 (0.0%) | 0 (0.0%) |
| 40 to 44 Minutes | 0 (0.0%) | 0 (0.0%) |
| 45 to 59 Minutes | 8 (8.0%) | 6 (7.3%) |
| 60 to 89 Minutes | 23 (23.0%) | 5 (6.1%) |
| 90 or more Minutes | 0 (0.0%) | 0 (0.0%) |
Time of Departure to Work by Sex in Ravenwood
The most frequent times of departure to work in Ravenwood are 5:00 AM to 5:29 AM (25, 25.0%) for males and 8:30 AM to 8:59 AM (16, 19.5%) for females.
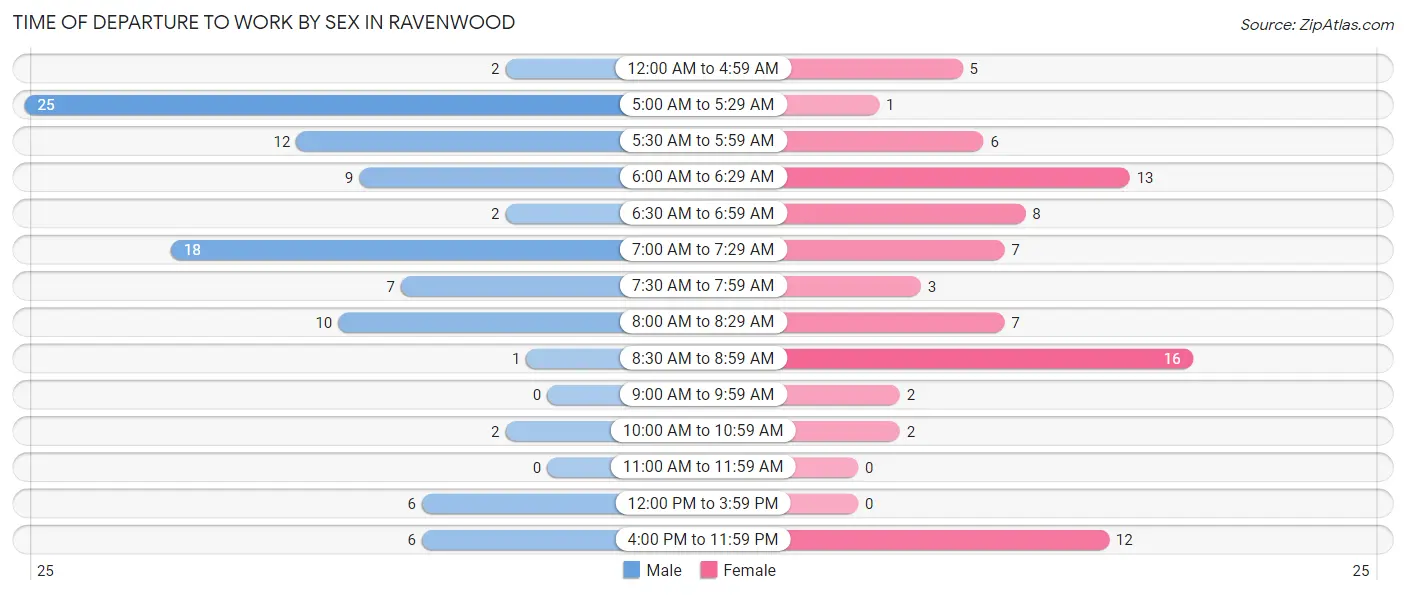
| Time of Departure | Male | Female |
| 12:00 AM to 4:59 AM | 2 (2.0%) | 5 (6.1%) |
| 5:00 AM to 5:29 AM | 25 (25.0%) | 1 (1.2%) |
| 5:30 AM to 5:59 AM | 12 (12.0%) | 6 (7.3%) |
| 6:00 AM to 6:29 AM | 9 (9.0%) | 13 (15.9%) |
| 6:30 AM to 6:59 AM | 2 (2.0%) | 8 (9.8%) |
| 7:00 AM to 7:29 AM | 18 (18.0%) | 7 (8.5%) |
| 7:30 AM to 7:59 AM | 7 (7.0%) | 3 (3.7%) |
| 8:00 AM to 8:29 AM | 10 (10.0%) | 7 (8.5%) |
| 8:30 AM to 8:59 AM | 1 (1.0%) | 16 (19.5%) |
| 9:00 AM to 9:59 AM | 0 (0.0%) | 2 (2.4%) |
| 10:00 AM to 10:59 AM | 2 (2.0%) | 2 (2.4%) |
| 11:00 AM to 11:59 AM | 0 (0.0%) | 0 (0.0%) |
| 12:00 PM to 3:59 PM | 6 (6.0%) | 0 (0.0%) |
| 4:00 PM to 11:59 PM | 6 (6.0%) | 12 (14.6%) |
| Total | 100 (100.0%) | 82 (100.0%) |
Housing Occupancy in Ravenwood
Occupancy by Ownership in Ravenwood
Of the total 188 dwellings in Ravenwood, owner-occupied units account for 148 (78.7%), while renter-occupied units make up 40 (21.3%).
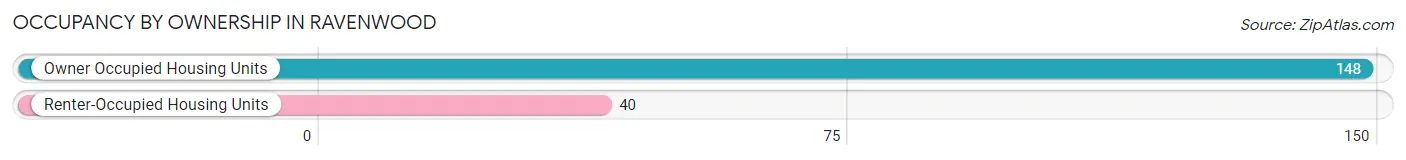
| Occupancy | # Housing Units | % Housing Units |
| Owner Occupied Housing Units | 148 | 78.7% |
| Renter-Occupied Housing Units | 40 | 21.3% |
| Total Occupied Housing Units | 188 | 100.0% |
Occupancy by Household Size in Ravenwood
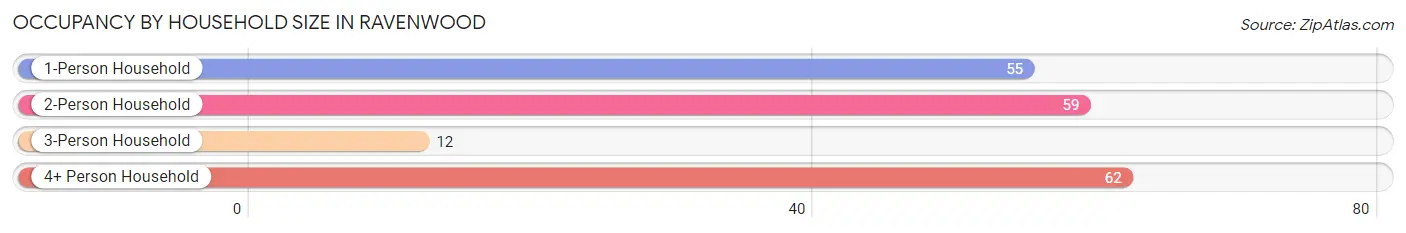
| Household Size | # Housing Units | % Housing Units |
| 1-Person Household | 55 | 29.3% |
| 2-Person Household | 59 | 31.4% |
| 3-Person Household | 12 | 6.4% |
| 4+ Person Household | 62 | 33.0% |
| Total Housing Units | 188 | 100.0% |
Occupancy by Ownership by Household Size in Ravenwood
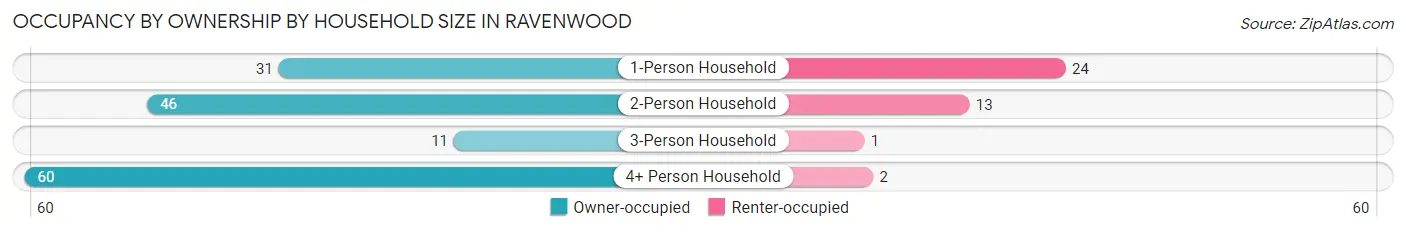
| Household Size | Owner-occupied | Renter-occupied |
| 1-Person Household | 31 (56.4%) | 24 (43.6%) |
| 2-Person Household | 46 (78.0%) | 13 (22.0%) |
| 3-Person Household | 11 (91.7%) | 1 (8.3%) |
| 4+ Person Household | 60 (96.8%) | 2 (3.2%) |
| Total Housing Units | 148 (78.7%) | 40 (21.3%) |
Occupancy by Educational Attainment in Ravenwood
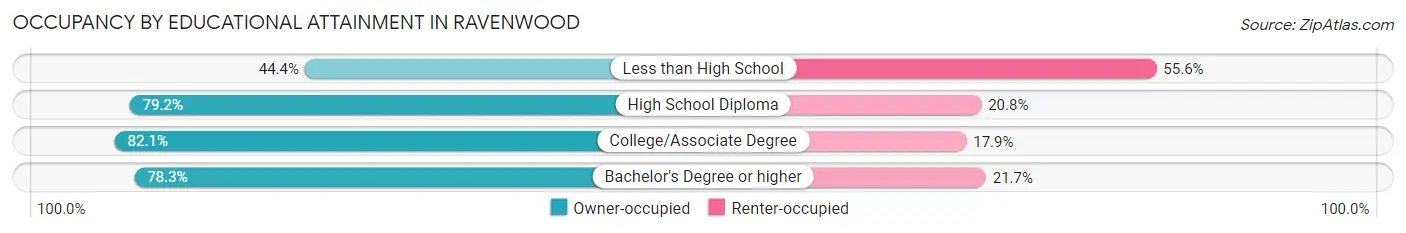
| Household Size | Owner-occupied | Renter-occupied |
| Less than High School | 4 (44.4%) | 5 (55.6%) |
| High School Diploma | 57 (79.2%) | 15 (20.8%) |
| College/Associate Degree | 69 (82.1%) | 15 (17.9%) |
| Bachelor's Degree or higher | 18 (78.3%) | 5 (21.7%) |
Occupancy by Age of Householder in Ravenwood
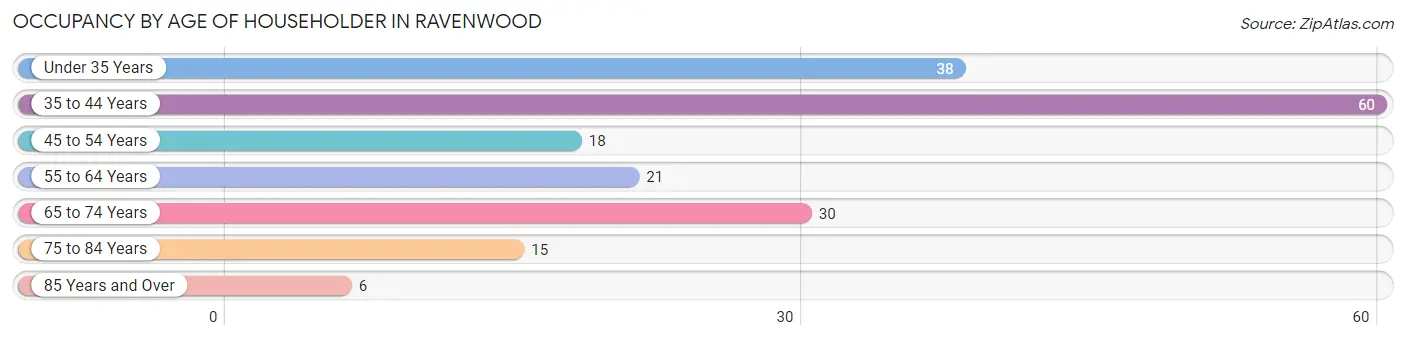
| Age Bracket | # Households | % Households |
| Under 35 Years | 38 | 20.2% |
| 35 to 44 Years | 60 | 31.9% |
| 45 to 54 Years | 18 | 9.6% |
| 55 to 64 Years | 21 | 11.2% |
| 65 to 74 Years | 30 | 16.0% |
| 75 to 84 Years | 15 | 8.0% |
| 85 Years and Over | 6 | 3.2% |
| Total | 188 | 100.0% |
Housing Finances in Ravenwood
Median Income by Occupancy in Ravenwood
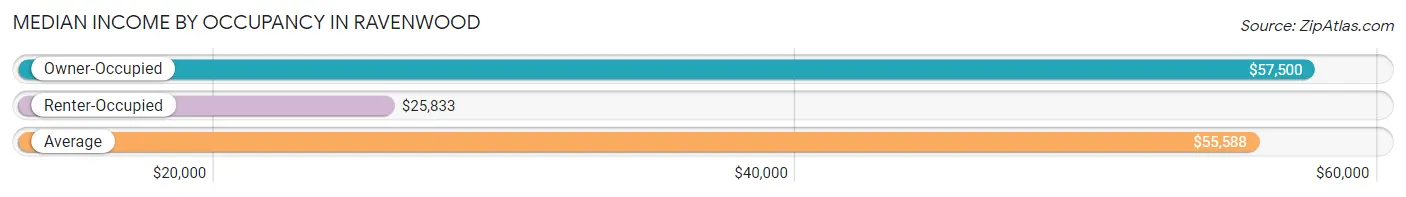
| Occupancy Type | # Households | Median Income |
| Owner-Occupied | 148 (78.7%) | $57,500 |
| Renter-Occupied | 40 (21.3%) | $25,833 |
| Average | 188 (100.0%) | $55,588 |
Occupancy by Householder Income Bracket in Ravenwood
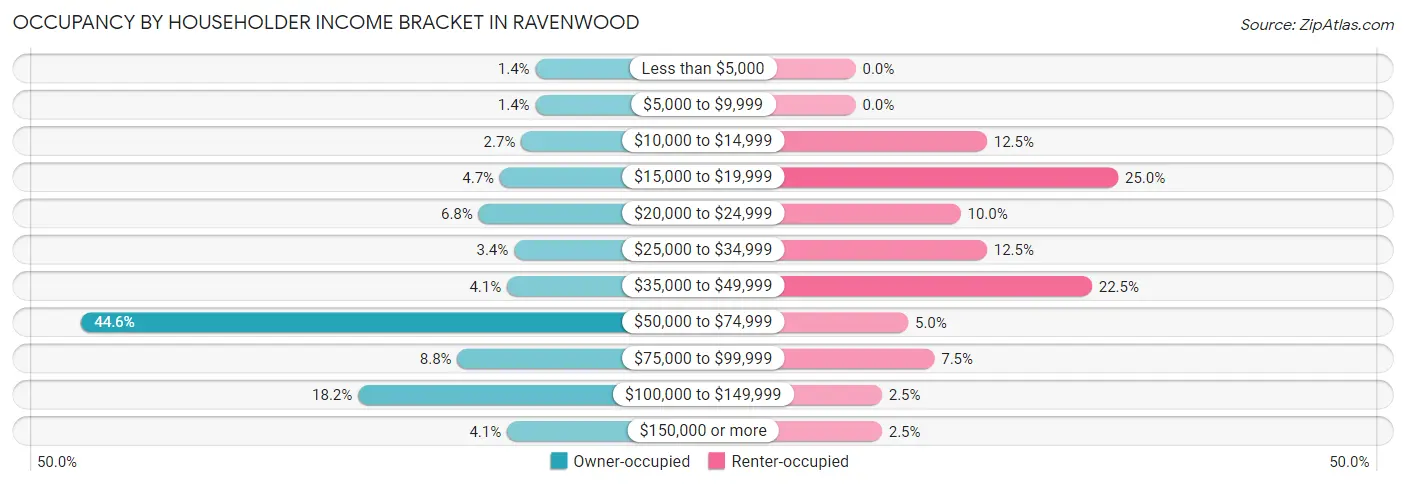
| Income Bracket | Owner-occupied | Renter-occupied |
| Less than $5,000 | 2 (1.3%) | 0 (0.0%) |
| $5,000 to $9,999 | 2 (1.3%) | 0 (0.0%) |
| $10,000 to $14,999 | 4 (2.7%) | 5 (12.5%) |
| $15,000 to $19,999 | 7 (4.7%) | 10 (25.0%) |
| $20,000 to $24,999 | 10 (6.8%) | 4 (10.0%) |
| $25,000 to $34,999 | 5 (3.4%) | 5 (12.5%) |
| $35,000 to $49,999 | 6 (4.1%) | 9 (22.5%) |
| $50,000 to $74,999 | 66 (44.6%) | 2 (5.0%) |
| $75,000 to $99,999 | 13 (8.8%) | 3 (7.5%) |
| $100,000 to $149,999 | 27 (18.2%) | 1 (2.5%) |
| $150,000 or more | 6 (4.1%) | 1 (2.5%) |
| Total | 148 (100.0%) | 40 (100.0%) |
Monthly Housing Cost Tiers in Ravenwood
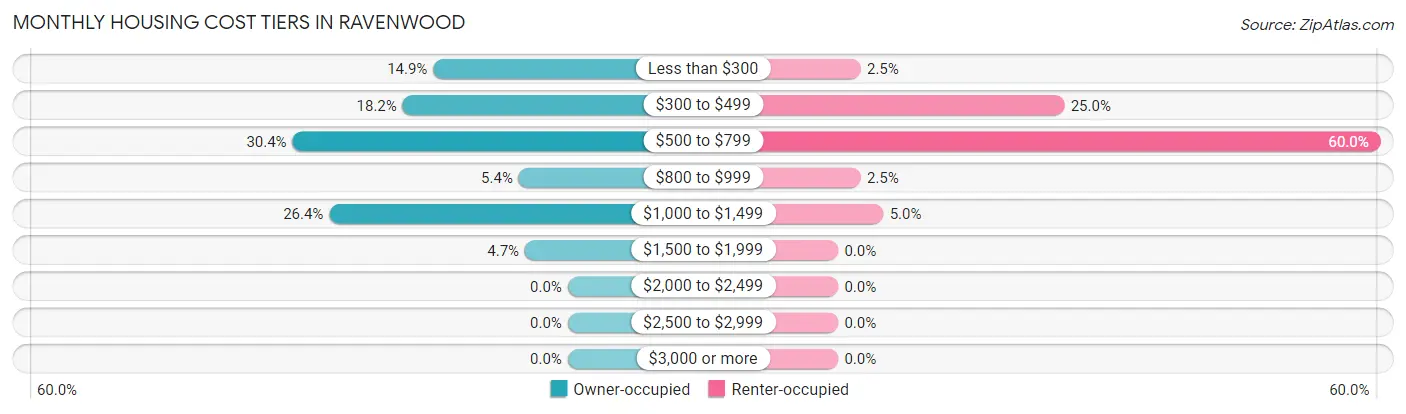
| Monthly Cost | Owner-occupied | Renter-occupied |
| Less than $300 | 22 (14.9%) | 1 (2.5%) |
| $300 to $499 | 27 (18.2%) | 10 (25.0%) |
| $500 to $799 | 45 (30.4%) | 24 (60.0%) |
| $800 to $999 | 8 (5.4%) | 1 (2.5%) |
| $1,000 to $1,499 | 39 (26.4%) | 2 (5.0%) |
| $1,500 to $1,999 | 7 (4.7%) | 0 (0.0%) |
| $2,000 to $2,499 | 0 (0.0%) | 0 (0.0%) |
| $2,500 to $2,999 | 0 (0.0%) | 0 (0.0%) |
| $3,000 or more | 0 (0.0%) | 0 (0.0%) |
| Total | 148 (100.0%) | 40 (100.0%) |
Physical Housing Characteristics in Ravenwood
Housing Structures in Ravenwood
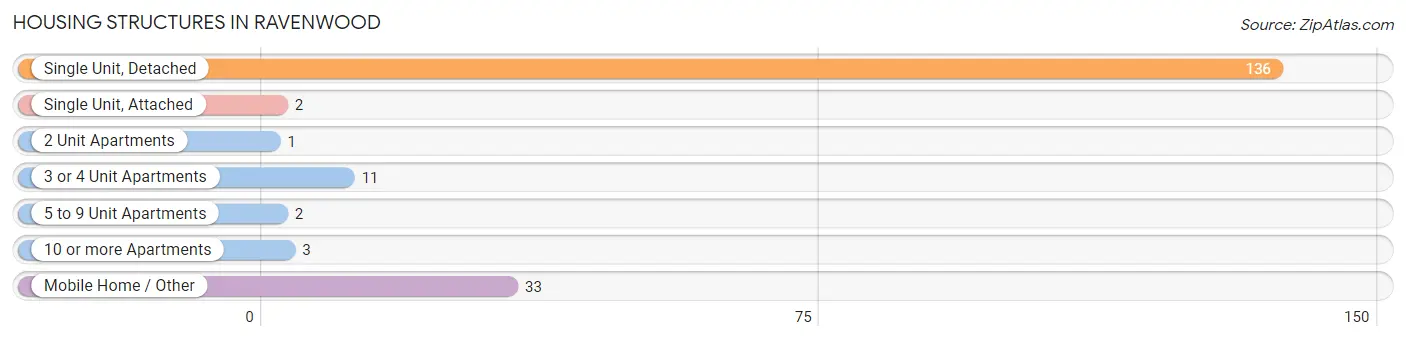
| Structure Type | # Housing Units | % Housing Units |
| Single Unit, Detached | 136 | 72.3% |
| Single Unit, Attached | 2 | 1.1% |
| 2 Unit Apartments | 1 | 0.5% |
| 3 or 4 Unit Apartments | 11 | 5.9% |
| 5 to 9 Unit Apartments | 2 | 1.1% |
| 10 or more Apartments | 3 | 1.6% |
| Mobile Home / Other | 33 | 17.5% |
| Total | 188 | 100.0% |
Housing Structures by Occupancy in Ravenwood
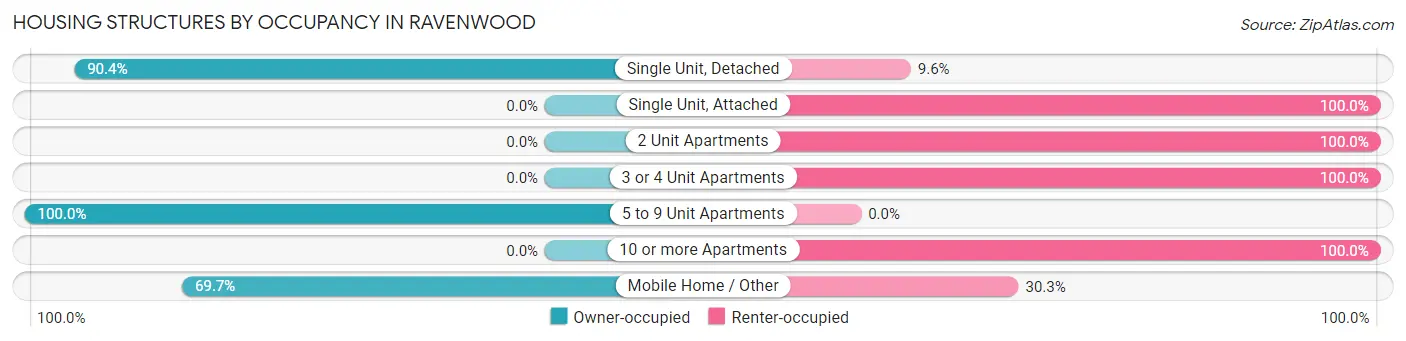
| Structure Type | Owner-occupied | Renter-occupied |
| Single Unit, Detached | 123 (90.4%) | 13 (9.6%) |
| Single Unit, Attached | 0 (0.0%) | 2 (100.0%) |
| 2 Unit Apartments | 0 (0.0%) | 1 (100.0%) |
| 3 or 4 Unit Apartments | 0 (0.0%) | 11 (100.0%) |
| 5 to 9 Unit Apartments | 2 (100.0%) | 0 (0.0%) |
| 10 or more Apartments | 0 (0.0%) | 3 (100.0%) |
| Mobile Home / Other | 23 (69.7%) | 10 (30.3%) |
| Total | 148 (78.7%) | 40 (21.3%) |
Housing Structures by Number of Rooms in Ravenwood
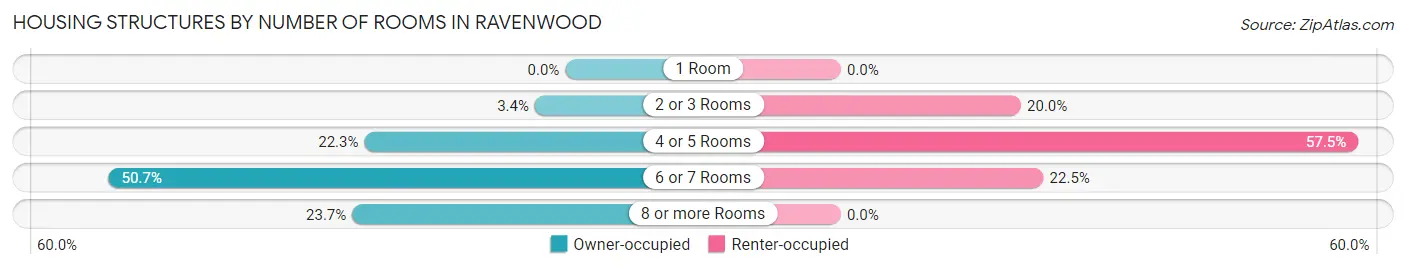
| Number of Rooms | Owner-occupied | Renter-occupied |
| 1 Room | 0 (0.0%) | 0 (0.0%) |
| 2 or 3 Rooms | 5 (3.4%) | 8 (20.0%) |
| 4 or 5 Rooms | 33 (22.3%) | 23 (57.5%) |
| 6 or 7 Rooms | 75 (50.7%) | 9 (22.5%) |
| 8 or more Rooms | 35 (23.6%) | 0 (0.0%) |
| Total | 148 (100.0%) | 40 (100.0%) |
Housing Structure by Heating Type in Ravenwood
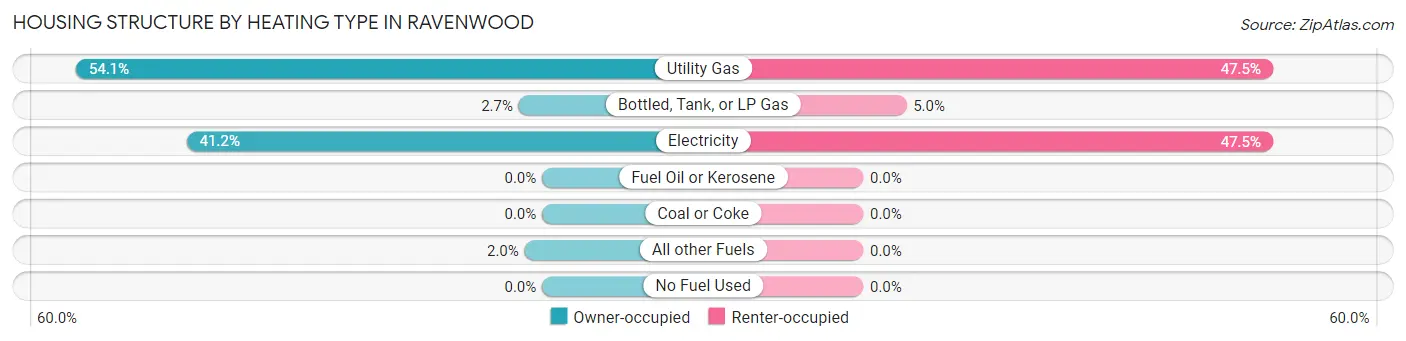
| Heating Type | Owner-occupied | Renter-occupied |
| Utility Gas | 80 (54.0%) | 19 (47.5%) |
| Bottled, Tank, or LP Gas | 4 (2.7%) | 2 (5.0%) |
| Electricity | 61 (41.2%) | 19 (47.5%) |
| Fuel Oil or Kerosene | 0 (0.0%) | 0 (0.0%) |
| Coal or Coke | 0 (0.0%) | 0 (0.0%) |
| All other Fuels | 3 (2.0%) | 0 (0.0%) |
| No Fuel Used | 0 (0.0%) | 0 (0.0%) |
| Total | 148 (100.0%) | 40 (100.0%) |
Household Vehicle Usage in Ravenwood
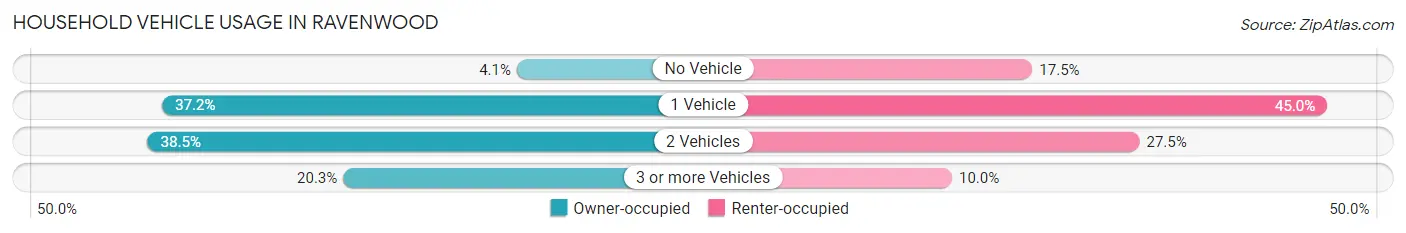
| Vehicles per Household | Owner-occupied | Renter-occupied |
| No Vehicle | 6 (4.1%) | 7 (17.5%) |
| 1 Vehicle | 55 (37.2%) | 18 (45.0%) |
| 2 Vehicles | 57 (38.5%) | 11 (27.5%) |
| 3 or more Vehicles | 30 (20.3%) | 4 (10.0%) |
| Total | 148 (100.0%) | 40 (100.0%) |
Real Estate & Mortgages in Ravenwood
Real Estate and Mortgage Overview in Ravenwood
| Characteristic | Without Mortgage | With Mortgage |
| Housing Units | 72 | 76 |
| Median Property Value | $31,700 | $101,700 |
| Median Household Income | $51,875 | $0 |
| Monthly Housing Costs | $400 | $0 |
| Real Estate Taxes | $539 | $2 |
Property Value by Mortgage Status in Ravenwood
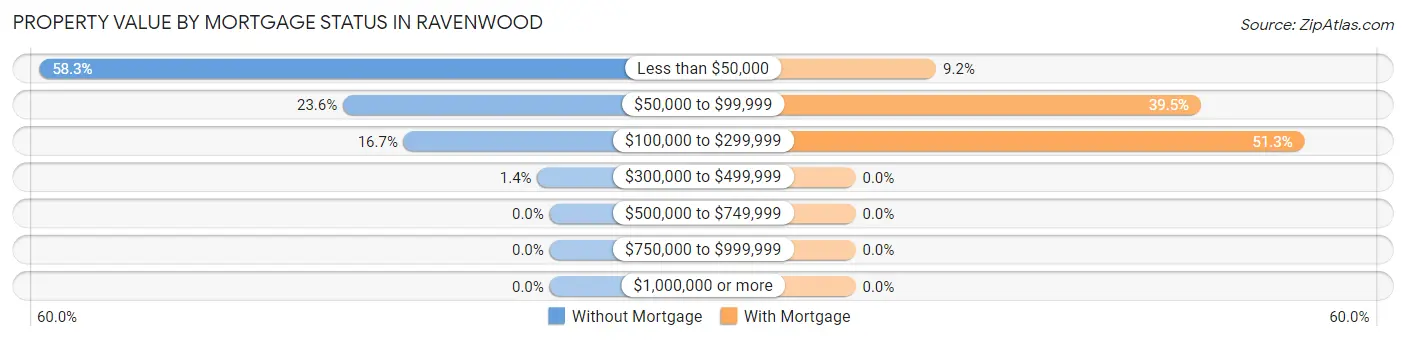
| Property Value | Without Mortgage | With Mortgage |
| Less than $50,000 | 42 (58.3%) | 7 (9.2%) |
| $50,000 to $99,999 | 17 (23.6%) | 30 (39.5%) |
| $100,000 to $299,999 | 12 (16.7%) | 39 (51.3%) |
| $300,000 to $499,999 | 1 (1.4%) | 0 (0.0%) |
| $500,000 to $749,999 | 0 (0.0%) | 0 (0.0%) |
| $750,000 to $999,999 | 0 (0.0%) | 0 (0.0%) |
| $1,000,000 or more | 0 (0.0%) | 0 (0.0%) |
| Total | 72 (100.0%) | 76 (100.0%) |
Household Income by Mortgage Status in Ravenwood
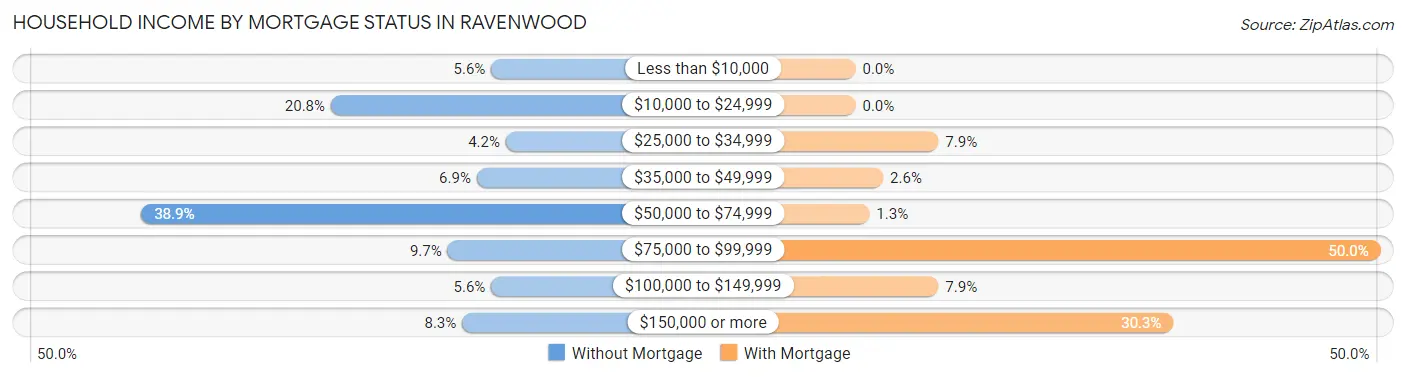
| Household Income | Without Mortgage | With Mortgage |
| Less than $10,000 | 4 (5.6%) | 0 (0.0%) |
| $10,000 to $24,999 | 15 (20.8%) | 0 (0.0%) |
| $25,000 to $34,999 | 3 (4.2%) | 6 (7.9%) |
| $35,000 to $49,999 | 5 (6.9%) | 2 (2.6%) |
| $50,000 to $74,999 | 28 (38.9%) | 1 (1.3%) |
| $75,000 to $99,999 | 7 (9.7%) | 38 (50.0%) |
| $100,000 to $149,999 | 4 (5.6%) | 6 (7.9%) |
| $150,000 or more | 6 (8.3%) | 23 (30.3%) |
| Total | 72 (100.0%) | 76 (100.0%) |
Property Value to Household Income Ratio in Ravenwood
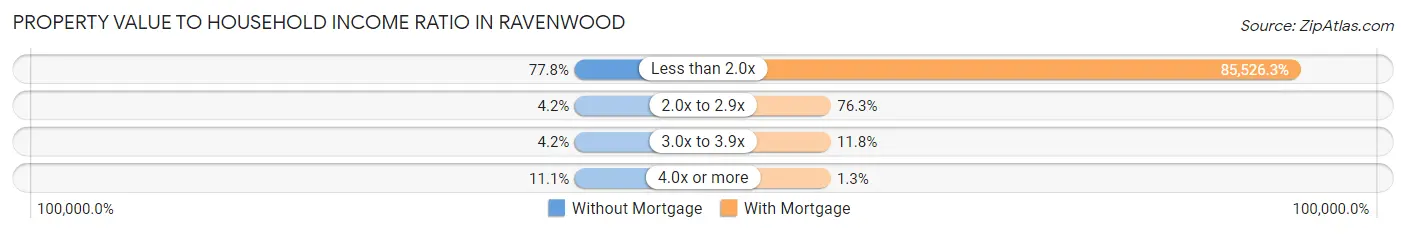
| Value-to-Income Ratio | Without Mortgage | With Mortgage |
| Less than 2.0x | 56 (77.8%) | 65,000 (85,526.3%) |
| 2.0x to 2.9x | 3 (4.2%) | 58 (76.3%) |
| 3.0x to 3.9x | 3 (4.2%) | 9 (11.8%) |
| 4.0x or more | 8 (11.1%) | 1 (1.3%) |
| Total | 72 (100.0%) | 76 (100.0%) |
Real Estate Taxes by Mortgage Status in Ravenwood
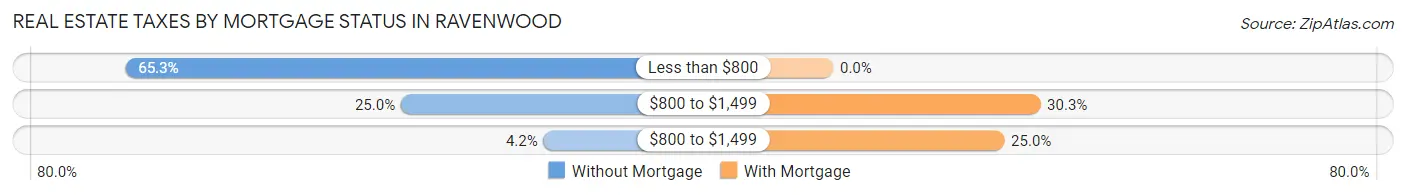
| Property Taxes | Without Mortgage | With Mortgage |
| Less than $800 | 47 (65.3%) | 0 (0.0%) |
| $800 to $1,499 | 18 (25.0%) | 23 (30.3%) |
| $800 to $1,499 | 3 (4.2%) | 19 (25.0%) |
| Total | 72 (100.0%) | 76 (100.0%) |
Health & Disability in Ravenwood
Health Insurance Coverage by Age in Ravenwood
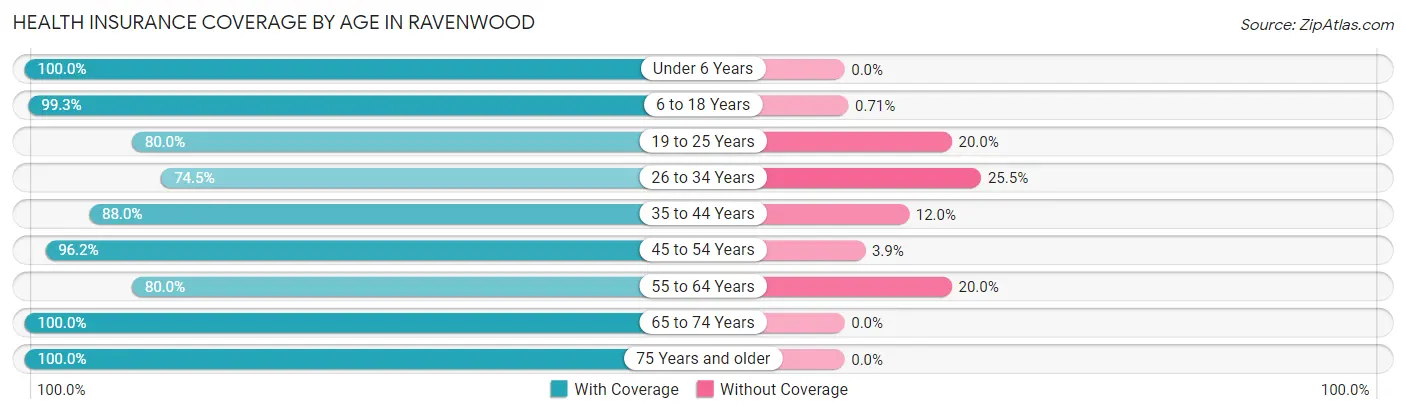
| Age Bracket | With Coverage | Without Coverage |
| Under 6 Years | 40 (100.0%) | 0 (0.0%) |
| 6 to 18 Years | 140 (99.3%) | 1 (0.7%) |
| 19 to 25 Years | 24 (80.0%) | 6 (20.0%) |
| 26 to 34 Years | 38 (74.5%) | 13 (25.5%) |
| 35 to 44 Years | 117 (88.0%) | 16 (12.0%) |
| 45 to 54 Years | 25 (96.2%) | 1 (3.8%) |
| 55 to 64 Years | 28 (80.0%) | 7 (20.0%) |
| 65 to 74 Years | 51 (100.0%) | 0 (0.0%) |
| 75 Years and older | 23 (100.0%) | 0 (0.0%) |
| Total | 486 (91.7%) | 44 (8.3%) |
Health Insurance Coverage by Citizenship Status in Ravenwood
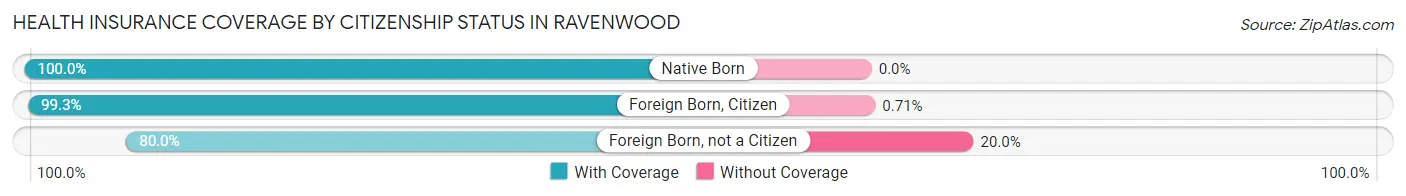
| Citizenship Status | With Coverage | Without Coverage |
| Native Born | 40 (100.0%) | 0 (0.0%) |
| Foreign Born, Citizen | 140 (99.3%) | 1 (0.7%) |
| Foreign Born, not a Citizen | 24 (80.0%) | 6 (20.0%) |
Health Insurance Coverage by Household Income in Ravenwood
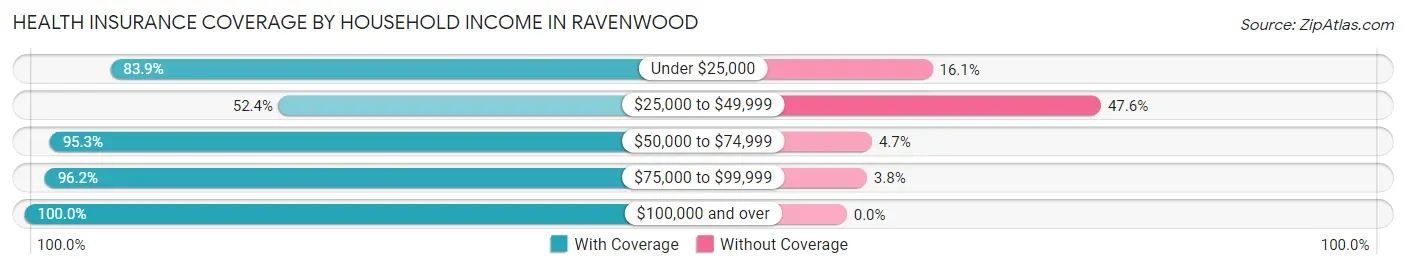
| Household Income | With Coverage | Without Coverage |
| Under $25,000 | 47 (83.9%) | 9 (16.1%) |
| $25,000 to $49,999 | 22 (52.4%) | 20 (47.6%) |
| $50,000 to $74,999 | 263 (95.3%) | 13 (4.7%) |
| $75,000 to $99,999 | 51 (96.2%) | 2 (3.8%) |
| $100,000 and over | 103 (100.0%) | 0 (0.0%) |
Public vs Private Health Insurance Coverage by Age in Ravenwood
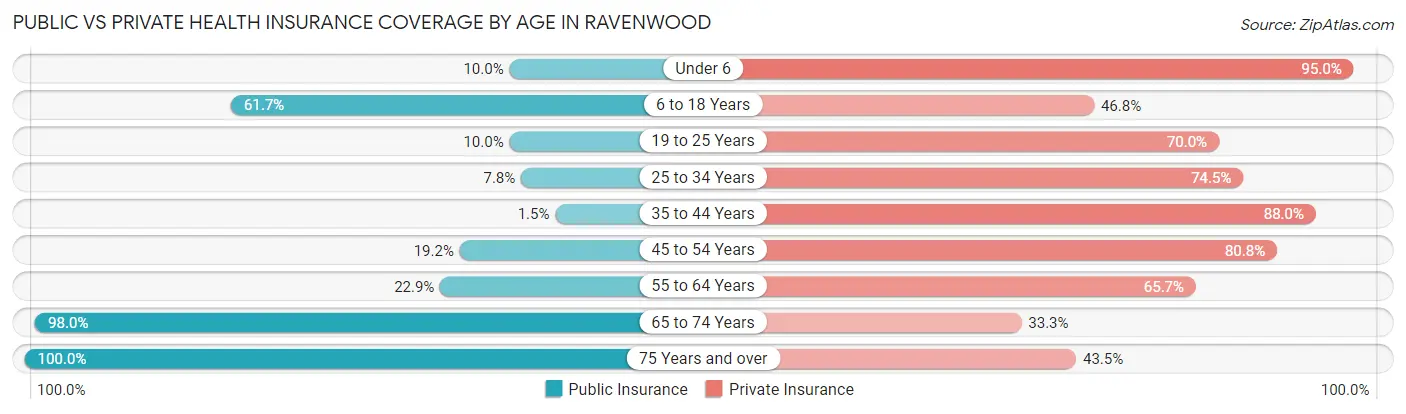
| Age Bracket | Public Insurance | Private Insurance |
| Under 6 | 4 (10.0%) | 38 (95.0%) |
| 6 to 18 Years | 87 (61.7%) | 66 (46.8%) |
| 19 to 25 Years | 3 (10.0%) | 21 (70.0%) |
| 25 to 34 Years | 4 (7.8%) | 38 (74.5%) |
| 35 to 44 Years | 2 (1.5%) | 117 (88.0%) |
| 45 to 54 Years | 5 (19.2%) | 21 (80.8%) |
| 55 to 64 Years | 8 (22.9%) | 23 (65.7%) |
| 65 to 74 Years | 50 (98.0%) | 17 (33.3%) |
| 75 Years and over | 23 (100.0%) | 10 (43.5%) |
| Total | 186 (35.1%) | 351 (66.2%) |
Disability Status by Sex by Age in Ravenwood
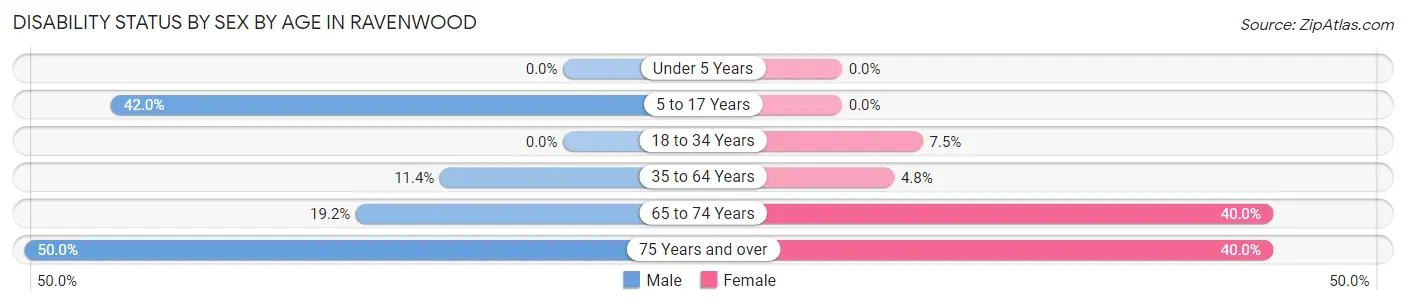
| Age Bracket | Male | Female |
| Under 5 Years | 0 (0.0%) | 0 (0.0%) |
| 5 to 17 Years | 34 (42.0%) | 0 (0.0%) |
| 18 to 34 Years | 0 (0.0%) | 3 (7.5%) |
| 35 to 64 Years | 8 (11.4%) | 6 (4.8%) |
| 65 to 74 Years | 5 (19.2%) | 10 (40.0%) |
| 75 Years and over | 4 (50.0%) | 6 (40.0%) |
Disability Class by Sex by Age in Ravenwood
Disability Class: Hearing Difficulty
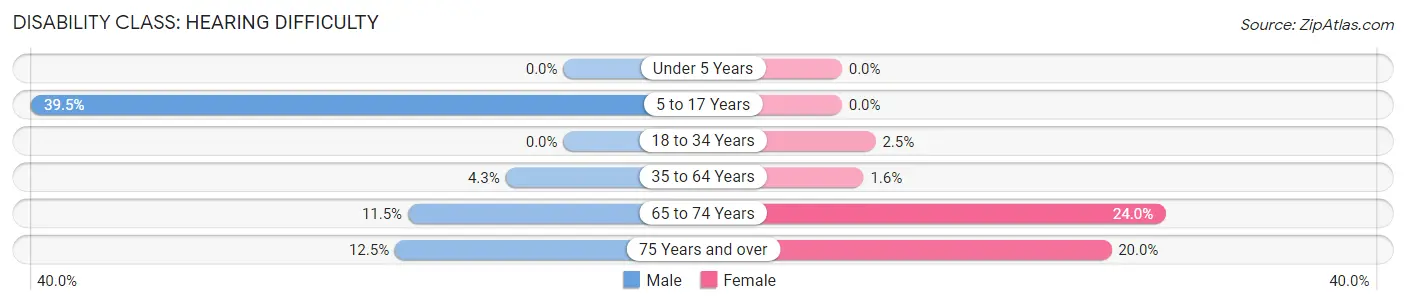
| Age Bracket | Male | Female |
| Under 5 Years | 0 (0.0%) | 0 (0.0%) |
| 5 to 17 Years | 32 (39.5%) | 0 (0.0%) |
| 18 to 34 Years | 0 (0.0%) | 1 (2.5%) |
| 35 to 64 Years | 3 (4.3%) | 2 (1.6%) |
| 65 to 74 Years | 3 (11.5%) | 6 (24.0%) |
| 75 Years and over | 1 (12.5%) | 3 (20.0%) |
Disability Class: Vision Difficulty
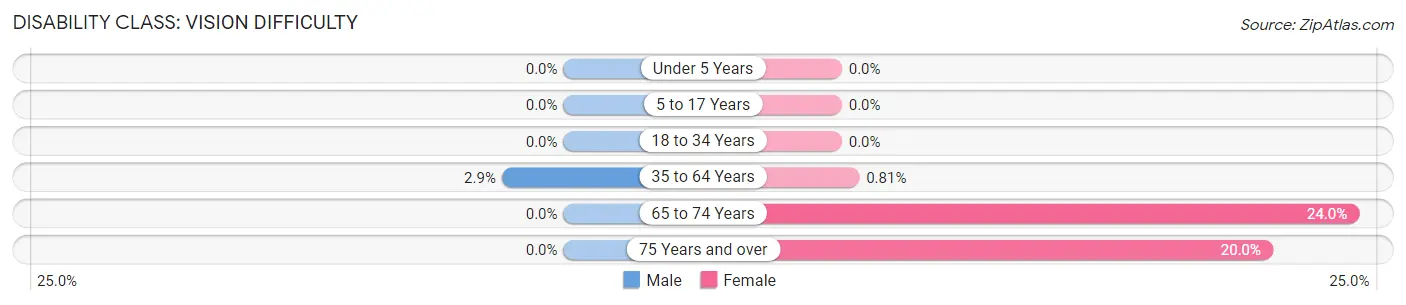
| Age Bracket | Male | Female |
| Under 5 Years | 0 (0.0%) | 0 (0.0%) |
| 5 to 17 Years | 0 (0.0%) | 0 (0.0%) |
| 18 to 34 Years | 0 (0.0%) | 0 (0.0%) |
| 35 to 64 Years | 2 (2.9%) | 1 (0.8%) |
| 65 to 74 Years | 0 (0.0%) | 6 (24.0%) |
| 75 Years and over | 0 (0.0%) | 3 (20.0%) |
Disability Class: Cognitive Difficulty
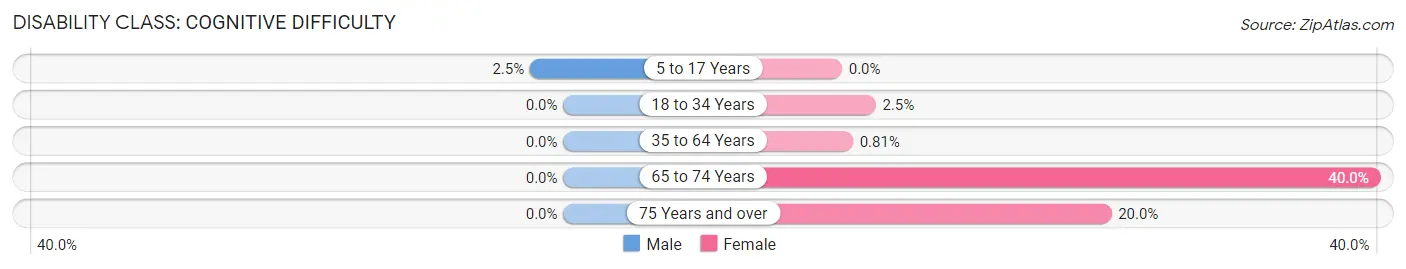
| Age Bracket | Male | Female |
| 5 to 17 Years | 2 (2.5%) | 0 (0.0%) |
| 18 to 34 Years | 0 (0.0%) | 1 (2.5%) |
| 35 to 64 Years | 0 (0.0%) | 1 (0.8%) |
| 65 to 74 Years | 0 (0.0%) | 10 (40.0%) |
| 75 Years and over | 0 (0.0%) | 3 (20.0%) |
Disability Class: Ambulatory Difficulty
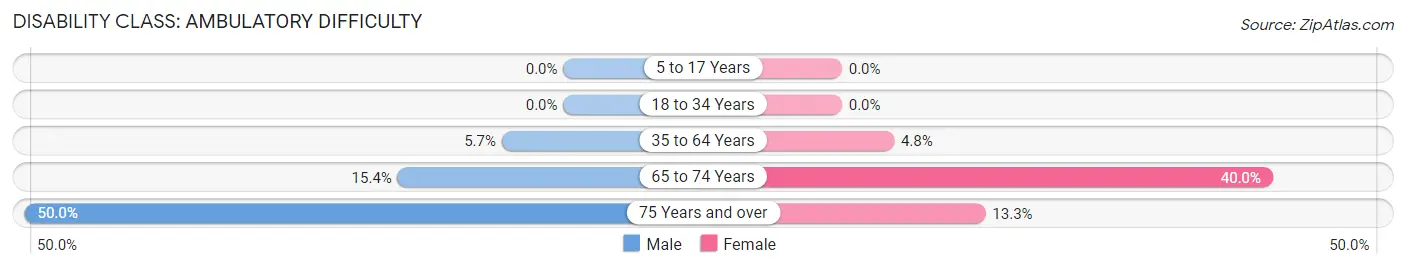
| Age Bracket | Male | Female |
| 5 to 17 Years | 0 (0.0%) | 0 (0.0%) |
| 18 to 34 Years | 0 (0.0%) | 0 (0.0%) |
| 35 to 64 Years | 4 (5.7%) | 6 (4.8%) |
| 65 to 74 Years | 4 (15.4%) | 10 (40.0%) |
| 75 Years and over | 4 (50.0%) | 2 (13.3%) |
Disability Class: Self-Care Difficulty
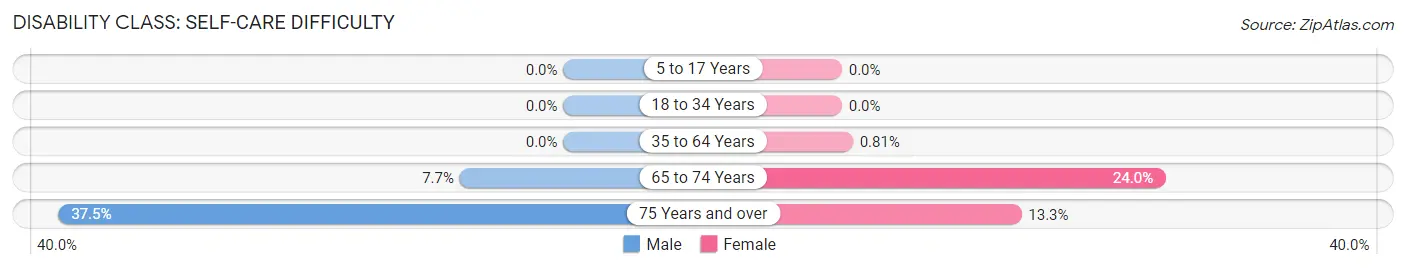
| Age Bracket | Male | Female |
| 5 to 17 Years | 0 (0.0%) | 0 (0.0%) |
| 18 to 34 Years | 0 (0.0%) | 0 (0.0%) |
| 35 to 64 Years | 0 (0.0%) | 1 (0.8%) |
| 65 to 74 Years | 2 (7.7%) | 6 (24.0%) |
| 75 Years and over | 3 (37.5%) | 2 (13.3%) |
Technology Access in Ravenwood
Computing Device Access in Ravenwood
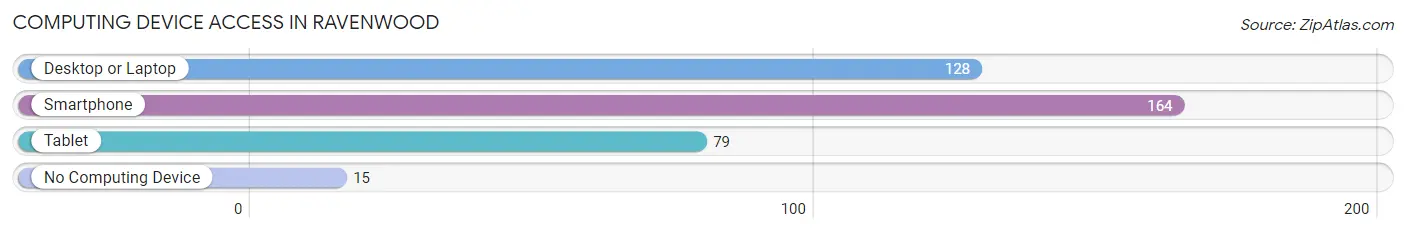
| Device Type | # Households | % Households |
| Desktop or Laptop | 128 | 68.1% |
| Smartphone | 164 | 87.2% |
| Tablet | 79 | 42.0% |
| No Computing Device | 15 | 8.0% |
| Total | 188 | 100.0% |
Internet Access in Ravenwood
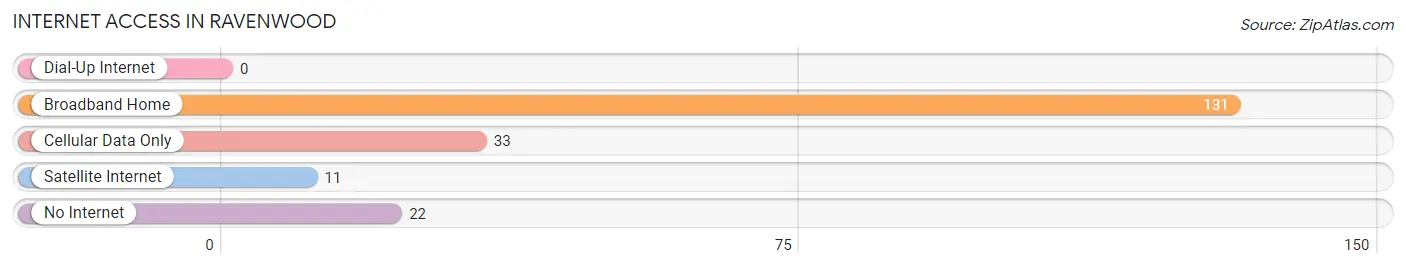
| Internet Type | # Households | % Households |
| Dial-Up Internet | 0 | 0.0% |
| Broadband Home | 131 | 69.7% |
| Cellular Data Only | 33 | 17.5% |
| Satellite Internet | 11 | 5.9% |
| No Internet | 22 | 11.7% |
| Total | 188 | 100.0% |
Ravenwood Summary
Ravenwood is a small town located in the northwest corner of Missouri, in Nodaway County. It is situated on the banks of the Nodaway River, and is surrounded by rolling hills and farmland. The town was founded in 1872, and has a population of approximately 1,000 people.
Ravenwood is located in the northwest corner of Missouri, in Nodaway County. It is situated on the banks of the Nodaway River, and is surrounded by rolling hills and farmland. The town was founded in 1872, and has a population of approximately 1,000 people. The town is located in the northwest corner of Missouri, and is approximately 30 miles from the state capital of Jefferson City.
Ravenwood is a small rural town, and the economy is largely based on agriculture. The town is home to several small businesses, including a grocery store, a hardware store, a bank, and a few restaurants. The town also has a post office, a library, and a few churches. The town is served by the Nodaway Valley School District, which includes a high school, a middle school, and an elementary school.
The geography of Ravenwood is characterized by rolling hills and farmland. The town is located in the northwest corner of Missouri, and is approximately 30 miles from the state capital of Jefferson City. The town is situated on the banks of the Nodaway River, and is surrounded by rolling hills and farmland. The town is located in the northwest corner of Missouri, and is approximately 30 miles from the state capital of Jefferson City.
The population of Ravenwood is approximately 1,000 people. The town is predominantly white, with a small percentage of African Americans and Hispanics. The median age of the population is approximately 40 years old. The median household income is approximately $40,000, and the median home value is approximately $90,000.
Ravenwood is a small rural town, and the economy is largely based on agriculture. The town is home to several small businesses, including a grocery store, a hardware store, a bank, and a few restaurants. The town also has a post office, a library, and a few churches. The town is served by the Nodaway Valley School District, which includes a high school, a middle school, and an elementary school.
Ravenwood is a small rural town, and the economy is largely based on agriculture. The town is home to several small businesses, including a grocery store, a hardware store, a bank, and a few restaurants. The town also has a post office, a library, and a few churches. The town is served by the Nodaway Valley School District, which includes a high school, a middle school, and an elementary school. The town is also home to a few small manufacturing businesses, including a furniture factory and a plastics factory.
Ravenwood is a small rural town, and the economy is largely based on agriculture. The town is home to several small businesses, including a grocery store, a hardware store, a bank, and a few restaurants. The town also has a post office, a library, and a few churches. The town is served by the Nodaway Valley School District, which includes a high school, a middle school, and an elementary school. The town is also home to a few small manufacturing businesses, including a furniture factory and a plastics factory. The town is also home to a few small tourist attractions, including a historic covered bridge and a museum.
Ravenwood is a small rural town, and the economy is largely based on agriculture. The town is home to several small businesses, including a grocery store, a hardware store, a bank, and a few restaurants. The town also has a post office, a library, and a few churches. The town is served by the Nodaway Valley School District, which includes a high school, a middle school, and an elementary school. The town is also home to a few small manufacturing businesses, including a furniture factory and a plastics factory. The town is also home to a few small tourist attractions, including a historic covered bridge and a museum. The town is also home to a few small parks, including a city park and a county park.
Ravenwood is a small rural town, and the economy is largely based on agriculture. The town is home to several small businesses, including a grocery store, a hardware store, a bank, and a few restaurants. The town also has a post office, a library, and a few churches. The town is served by the Nodaway Valley School District, which includes a high school, a middle school, and an elementary school. The town is also home to a few small manufacturing businesses, including a furniture factory and a plastics factory. The town is also home to a few small tourist attractions, including a historic covered bridge and a museum. The town is also home to a few small parks, including a city park and a county park. The town is also home to a few small recreational facilities, including a golf course and a swimming pool.
Ravenwood is a small rural town, and the economy is largely based on agriculture. The town is home to several small businesses, including a grocery store, a hardware store, a bank, and a few restaurants. The town also has a post office, a library, and a few churches. The town is served by the Nodaway Valley School District, which includes a high school, a middle school, and an elementary school. The town is also home to a few small manufacturing businesses, including a furniture factory and a plastics factory. The town is also home to a few small tourist attractions, including a historic covered bridge and a museum. The town is also home to a few small parks, including a city park and a county park. The town is also home to a few small recreational facilities, including a golf course and a swimming pool. The town is also home to a few small community organizations, including a Lions Club and a Rotary Club.
Ravenwood is a small rural town, and the economy is largely based on agriculture. The town is home to several small businesses, including a grocery store, a hardware store, a bank, and a few restaurants. The town also has a post office, a library, and a few churches. The town is served by the Nodaway Valley School District, which includes a high school, a middle school, and an elementary school. The town is also home to a few small manufacturing businesses, including a furniture factory and a plastics factory. The town is also home to a few small tourist attractions, including a historic covered bridge and a museum. The town is also home to a few small parks, including a city park and a county park. The town is also home to a few small recreational facilities, including a golf course and a swimming pool. The town is also home to a few small community organizations, including a Lions Club and a Rotary Club. The town is also home to a few small cultural organizations, including a theater group and a historical society.
Ravenwood is a small rural town, and the economy is largely based on agriculture. The town is home to several small businesses, including a grocery store, a hardware store, a bank, and a few restaurants. The town also has a post office, a library, and a few churches. The town is served by the Nodaway Valley School District, which includes a high school, a middle school, and an elementary school. The town is also home to a few small manufacturing businesses, including a furniture factory and a plastics factory. The town is also home to a few small tourist attractions, including a historic covered bridge and a museum. The town is also home to a few small parks, including a city park and a county park. The town is also home to a few small recreational facilities, including a golf course and a swimming pool. The town is also home to a few small community organizations, including a Lions Club and a Rotary Club. The town is also home to a few small cultural organizations, including a theater group and a historical society. The town is also home to a few small medical facilities, including a hospital and a clinic.
Ravenwood is a small rural town, and the economy is largely based on agriculture. The town is home to several small businesses, including a grocery store, a hardware store, a bank, and a few restaurants. The town also has a post office, a library, and a few churches. The town is served by the Nodaway Valley School District, which includes a high school, a middle school, and an elementary school. The town is also home to a few small manufacturing businesses, including a furniture factory and a plastics factory. The town is also home to a few small tourist attractions, including a historic covered bridge and a museum. The town is also home to a few small parks, including a city park and a county park. The town is also home to a few small recreational facilities, including a golf course and a swimming pool. The town is also home to a few small community organizations, including a Lions Club and a Rotary Club. The town is also home to a few small cultural organizations, including a theater group and a historical society. The town is also home to a few small medical facilities, including a hospital and a clinic. The town is also home to a few small government offices, including a police station and a fire station.
Ravenwood is a small rural town, and the economy is largely based on agriculture. The town is home to several small businesses, including a grocery store, a hardware store, a bank, and a few restaurants. The town also has a post office, a library, and a few churches. The town is served by the Nodaway Valley School District, which includes a high school, a middle school, and an elementary school. The town is also home to a few small manufacturing businesses, including a furniture factory and a plastics factory. The town is also home to a few small tourist attractions, including a historic covered bridge and a museum. The town is also home to a few small parks, including a city park and a county park. The town is also home to a few small recreational facilities, including a golf course and a swimming pool. The town is also home to a few small community organizations, including a Lions Club and a Rotary Club. The town is also home to a few small cultural organizations, including a theater group and a historical society. The town is also home to a few small medical facilities, including a hospital and a clinic. The town is also home to a few small government offices, including a police station and a fire station. The town is also home to a few small media outlets, including a newspaper and a radio station.
Ravenwood is a small rural town, and the economy is largely based on agriculture. The town is home to several small businesses, including a grocery store, a hardware store, a bank, and a few restaurants. The town also has a post office, a library, and a few churches. The town is served by the Nodaway Valley School District, which includes a high school, a middle school, and an elementary school. The town is also home to a few small manufacturing businesses, including a furniture factory and a plastics factory. The town is also home to a few small tourist attractions, including a historic covered bridge and a museum. The town is also home to a few small parks, including a city park and a county park. The town is also home to a few small recreational facilities, including a golf course and a swimming pool. The town is also home to a few small community organizations, including a Lions Club and a Rotary Club. The town is also home to a few small cultural organizations, including a theater group and a historical society. The town is also home to a few small medical facilities, including a hospital and a clinic. The town is also home to a few small government offices, including a police station and a fire station. The town is also home to a few small media outlets, including a newspaper and a radio station. The town is also home to a few small educational institutions, including a community college and a technical school.
Ravenwood is a small rural town, and the economy is largely based on agriculture. The town is home to several small businesses, including a grocery store, a hardware store, a bank, and a few restaurants. The town also has a post office, a library, and a few churches. The town is served by the Nodaway Valley School District, which includes a high school, a middle school, and an elementary school. The town is also home to a few small manufacturing businesses, including a furniture factory and a plastics factory. The town is also home to a few small tourist attractions, including a historic covered bridge and a museum. The town is also home to a few small parks, including a city park and a county park. The town is also home to a few small recreational facilities, including a golf course and a swimming pool. The town is also home to a few small community organizations, including a Lions Club and a Rotary Club. The town is also home to a few small cultural organizations, including a theater group and a historical society. The town is also home to a few small medical facilities, including a hospital and a clinic. The town is also home to a few small government offices, including a police station and a fire station. The town is also home to a few small media outlets, including a newspaper and a radio station. The town is also home to a few small educational institutions, including a community college and a technical school. The town is also home to a few small recreational activities, including fishing, hunting, and camping.
Ravenwood is a small rural town, and the economy is largely based on agriculture. The town is home to several small businesses, including a grocery store, a hardware store, a bank, and a few restaurants. The town also has a post office, a library, and a few churches. The town is served by the Nodaway Valley School District, which includes a high school, a middle school, and an elementary school. The town is also home to a few small manufacturing businesses, including a furniture factory and a plastics factory. The town is also home to a few small tourist attractions, including a historic covered bridge and a museum. The town is also home to a few small parks, including a city park and a county park. The town is also home to a few small recreational facilities, including a golf course and a swimming pool. The town is also home to a few small community organizations, including a Lions Club and a Rotary Club. The town is also home to a few small cultural organizations, including a theater group and a historical society. The town is also home to a few small medical facilities, including a hospital and a clinic. The town is also home to a few small government offices, including a police station and a fire station. The town is also home to a few small media outlets, including a newspaper and a radio station. The town is also home to a few small educational institutions, including a community college and a technical school. The town is also home to a few small recreational activities, including fishing, hunting, and camping. The town is also home to a few small community events, including a Fourth of July parade and a county fair.
Common Questions
What is Per Capita Income in Ravenwood?
Per Capita income in Ravenwood is $22,147.
What is the Median Family Income in Ravenwood?
Median Family Income in Ravenwood is $58,125.
What is the Median Household income in Ravenwood?
Median Household Income in Ravenwood is $55,588.
What is Income or Wage Gap in Ravenwood?
Income or Wage Gap in Ravenwood is 36.6%.
Women in Ravenwood earn 63.4 cents for every dollar earned by a man.
What is Inequality or Gini Index in Ravenwood?
Inequality or Gini Index in Ravenwood is 0.41.
What is the Total Population of Ravenwood?
Total Population of Ravenwood is 530.
What is the Total Male Population of Ravenwood?
Total Male Population of Ravenwood is 251.
What is the Total Female Population of Ravenwood?
Total Female Population of Ravenwood is 279.
What is the Ratio of Males per 100 Females in Ravenwood?
There are 89.96 Males per 100 Females in Ravenwood.
What is the Ratio of Females per 100 Males in Ravenwood?
There are 111.16 Females per 100 Males in Ravenwood.
What is the Median Population Age in Ravenwood?
Median Population Age in Ravenwood is 36.0 Years.
What is the Average Family Size in Ravenwood
Average Family Size in Ravenwood is 3.6 People.
What is the Average Household Size in Ravenwood
Average Household Size in Ravenwood is 2.8 People.
How Large is the Labor Force in Ravenwood?
There are 195 People in the Labor Forcein in Ravenwood.
What is the Percentage of People in the Labor Force in Ravenwood?
52.6% of People are in the Labor Force in Ravenwood.
What is the Unemployment Rate in Ravenwood?
Unemployment Rate in Ravenwood is 2.6%.