Campbell, MO Map & Demographics
Campbell Map
Campbell Overview
$17,278
PER CAPITA INCOME
$53,370
AVG FAMILY INCOME
$45,577
AVG HOUSEHOLD INCOME
40.2%
WAGE / INCOME GAP [ % ]
59.8¢/ $1
WAGE / INCOME GAP [ $ ]
$9,792
FAMILY INCOME DEFICIT
0.40
INEQUALITY / GINI INDEX
1,639
TOTAL POPULATION
845
MALE POPULATION
794
FEMALE POPULATION
106.42
MALES / 100 FEMALES
93.96
FEMALES / 100 MALES
37.0
MEDIAN AGE
3.5
AVG FAMILY SIZE
2.8
AVG HOUSEHOLD SIZE
625
LABOR FORCE [ PEOPLE ]
50.4%
PERCENT IN LABOR FORCE
8.0%
UNEMPLOYMENT RATE
Campbell Zip Codes
Campbell Area Codes
Income in Campbell
Income Overview in Campbell
Per Capita Income in Campbell is $17,278, while median incomes of families and households are $53,370 and $45,577 respectively.
| Characteristic | Number | Measure |
| Per Capita Income | 1,639 | $17,278 |
| Median Family Income | 378 | $53,370 |
| Mean Family Income | 378 | $59,485 |
| Median Household Income | 556 | $45,577 |
| Mean Household Income | 556 | $51,110 |
| Income Deficit | 378 | $9,792 |
| Wage / Income Gap (%) | 1,639 | 40.15% |
| Wage / Income Gap ($) | 1,639 | 59.85¢ per $1 |
| Gini / Inequality Index | 1,639 | 0.40 |
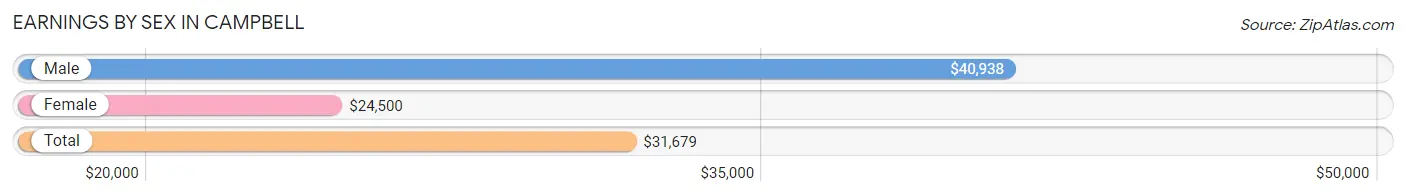
Earnings by Sex in Campbell
Average Earnings in Campbell are $31,679, $40,938 for men and $24,500 for women, a difference of 40.2%.
| Sex | Number | Average Earnings |
| Male | 293 (48.3%) | $40,938 |
| Female | 314 (51.7%) | $24,500 |
| Total | 607 (100.0%) | $31,679 |
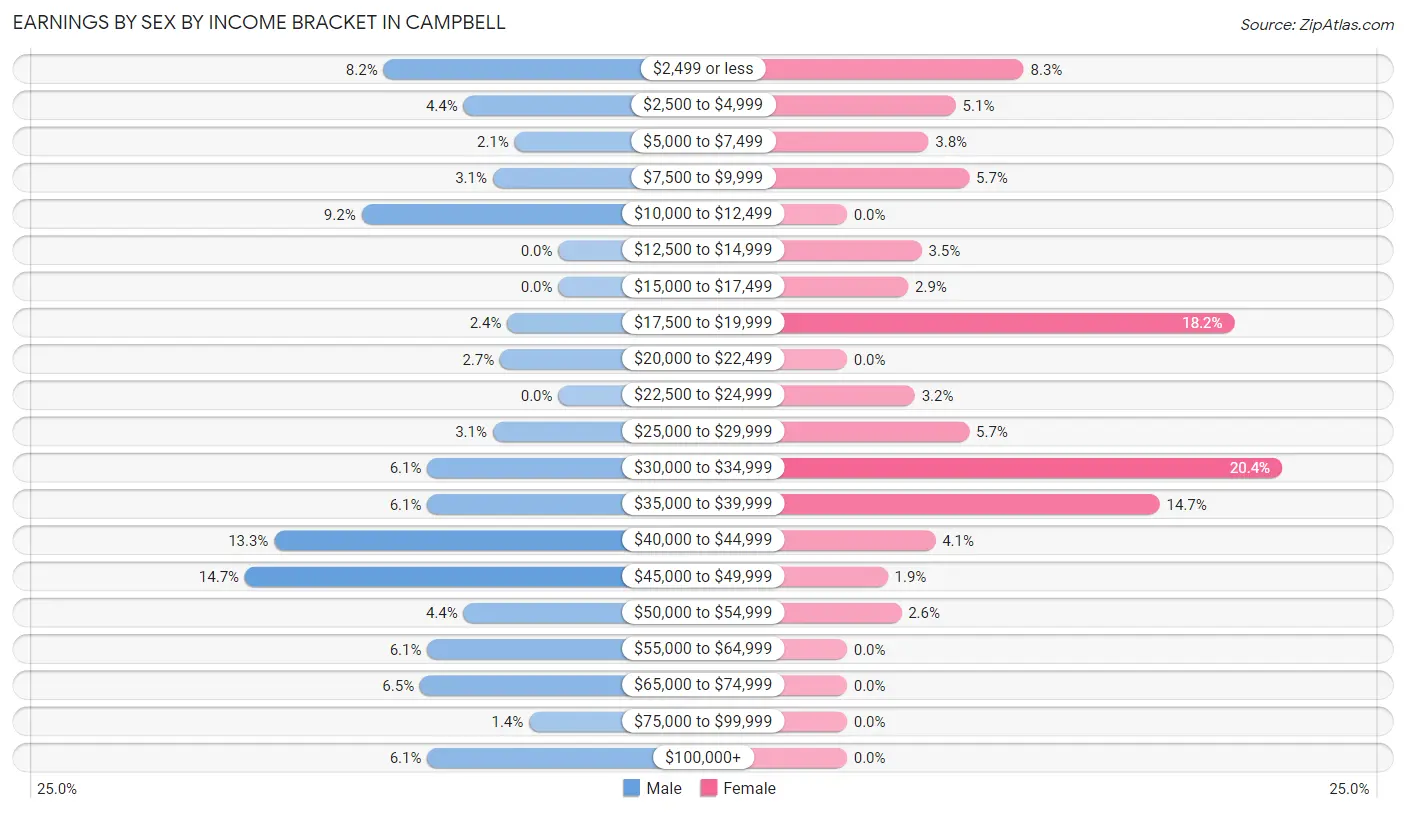
Earnings by Sex by Income Bracket in Campbell
The most common earnings brackets in Campbell are $45,000 to $49,999 for men (43 | 14.7%) and $30,000 to $34,999 for women (64 | 20.4%).
| Income | Male | Female |
| $2,499 or less | 24 (8.2%) | 26 (8.3%) |
| $2,500 to $4,999 | 13 (4.4%) | 16 (5.1%) |
| $5,000 to $7,499 | 6 (2.1%) | 12 (3.8%) |
| $7,500 to $9,999 | 9 (3.1%) | 18 (5.7%) |
| $10,000 to $12,499 | 27 (9.2%) | 0 (0.0%) |
| $12,500 to $14,999 | 0 (0.0%) | 11 (3.5%) |
| $15,000 to $17,499 | 0 (0.0%) | 9 (2.9%) |
| $17,500 to $19,999 | 7 (2.4%) | 57 (18.1%) |
| $20,000 to $22,499 | 8 (2.7%) | 0 (0.0%) |
| $22,500 to $24,999 | 0 (0.0%) | 10 (3.2%) |
| $25,000 to $29,999 | 9 (3.1%) | 18 (5.7%) |
| $30,000 to $34,999 | 18 (6.1%) | 64 (20.4%) |
| $35,000 to $39,999 | 18 (6.1%) | 46 (14.6%) |
| $40,000 to $44,999 | 39 (13.3%) | 13 (4.1%) |
| $45,000 to $49,999 | 43 (14.7%) | 6 (1.9%) |
| $50,000 to $54,999 | 13 (4.4%) | 8 (2.5%) |
| $55,000 to $64,999 | 18 (6.1%) | 0 (0.0%) |
| $65,000 to $74,999 | 19 (6.5%) | 0 (0.0%) |
| $75,000 to $99,999 | 4 (1.4%) | 0 (0.0%) |
| $100,000+ | 18 (6.1%) | 0 (0.0%) |
| Total | 293 (100.0%) | 314 (100.0%) |
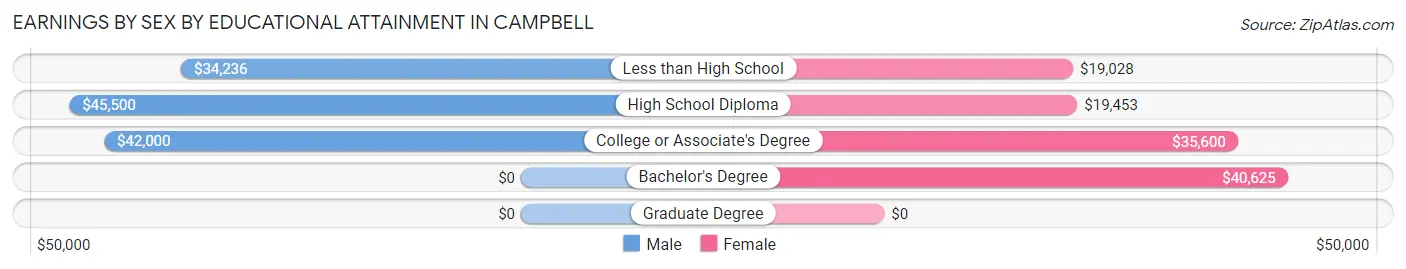
Earnings by Sex by Educational Attainment in Campbell
Average earnings in Campbell are $41,000 for men and $25,750 for women, a difference of 37.2%. Men with an educational attainment of high school diploma enjoy the highest average annual earnings of $45,500, while those with less than high school education earn the least with $34,236. Women with an educational attainment of bachelor's degree earn the most with the average annual earnings of $40,625, while those with less than high school education have the smallest earnings of $19,028.
| Educational Attainment | Male Income | Female Income |
| Less than High School | $34,236 | $19,028 |
| High School Diploma | $45,500 | $19,453 |
| College or Associate's Degree | $42,000 | $35,600 |
| Bachelor's Degree | - | - |
| Graduate Degree | - | - |
| Total | $41,000 | $25,750 |
Family Income in Campbell
Family Income Brackets in Campbell
According to the Campbell family income data, there are 126 families falling into the $50,000 to $74,999 income range, which is the most common income bracket and makes up 33.3% of all families. Conversely, the $10,000 to $14,999 income bracket is the least frequent group with only 4 families (1.1%) belonging to this category.

| Income Bracket | # Families | % Families |
| Less than $10,000 | 19 | 5.0% |
| $10,000 to $14,999 | 4 | 1.1% |
| $15,000 to $24,999 | 48 | 12.7% |
| $25,000 to $34,999 | 22 | 5.8% |
| $35,000 to $49,999 | 72 | 19.0% |
| $50,000 to $74,999 | 126 | 33.3% |
| $75,000 to $99,999 | 33 | 8.7% |
| $100,000 to $149,999 | 36 | 9.5% |
| $150,000 to $199,999 | 14 | 3.7% |
| $200,000+ | 4 | 1.1% |
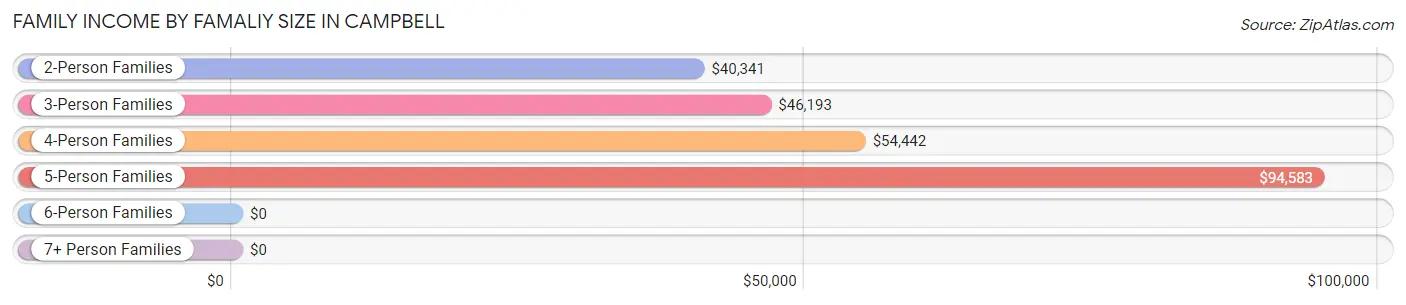
Family Income by Famaliy Size in Campbell
5-person families (45 | 11.9%) account for the highest median family income in Campbell with $94,583 per family, while 2-person families (146 | 38.6%) have the highest median income of $20,170 per family member.
| Income Bracket | # Families | Median Income |
| 2-Person Families | 146 (38.6%) | $40,341 |
| 3-Person Families | 45 (11.9%) | $46,193 |
| 4-Person Families | 125 (33.1%) | $54,442 |
| 5-Person Families | 45 (11.9%) | $94,583 |
| 6-Person Families | 12 (3.2%) | $0 |
| 7+ Person Families | 5 (1.3%) | $0 |
| Total | 378 (100.0%) | $53,370 |
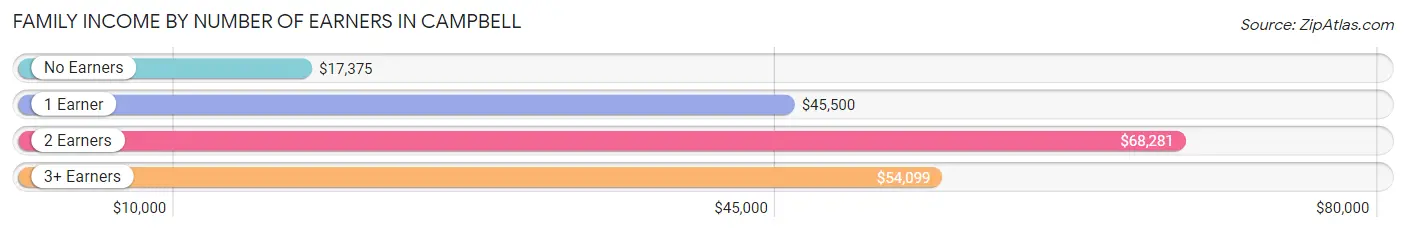
Family Income by Number of Earners in Campbell
The median family income in Campbell is $53,370, with families comprising 2 earners (95) having the highest median family income of $68,281, while families with no earners (74) have the lowest median family income of $17,375, accounting for 25.1% and 19.6% of families, respectively.
| Number of Earners | # Families | Median Income |
| No Earners | 74 (19.6%) | $17,375 |
| 1 Earner | 154 (40.7%) | $45,500 |
| 2 Earners | 95 (25.1%) | $68,281 |
| 3+ Earners | 55 (14.5%) | $54,099 |
| Total | 378 (100.0%) | $53,370 |
Household Income in Campbell
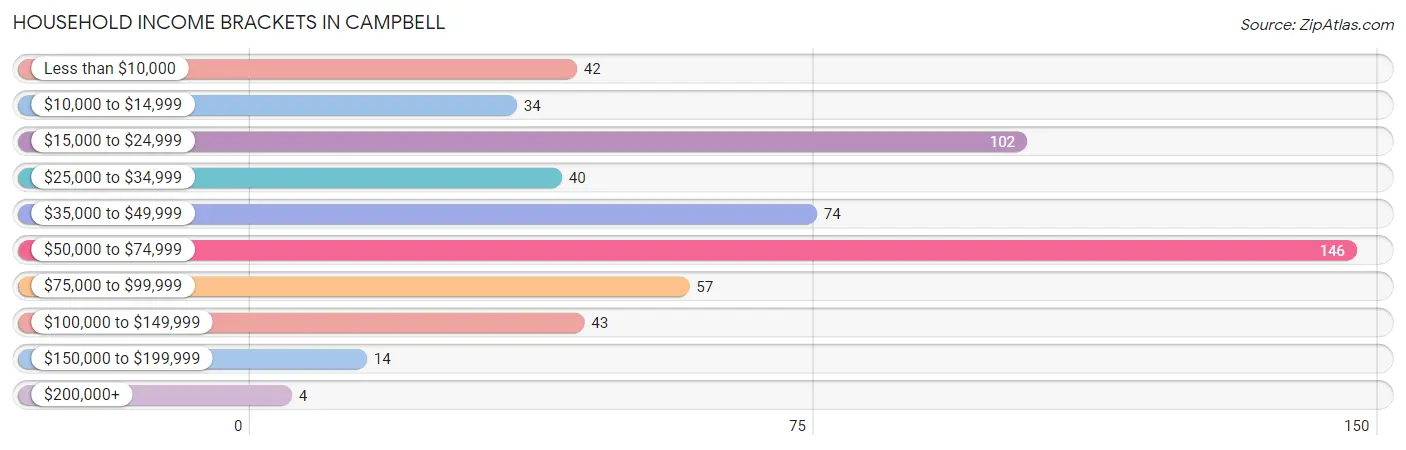
Household Income Brackets in Campbell
With 146 households falling in the category, the $50,000 to $74,999 income range is the most frequent in Campbell, accounting for 26.3% of all households. In contrast, only 4 households (0.7%) fall into the $200,000+ income bracket, making it the least populous group.
| Income Bracket | # Households | % Households |
| Less than $10,000 | 42 | 7.6% |
| $10,000 to $14,999 | 34 | 6.1% |
| $15,000 to $24,999 | 102 | 18.3% |
| $25,000 to $34,999 | 40 | 7.2% |
| $35,000 to $49,999 | 74 | 13.3% |
| $50,000 to $74,999 | 146 | 26.3% |
| $75,000 to $99,999 | 57 | 10.3% |
| $100,000 to $149,999 | 43 | 7.7% |
| $150,000 to $199,999 | 14 | 2.5% |
| $200,000+ | 4 | 0.7% |
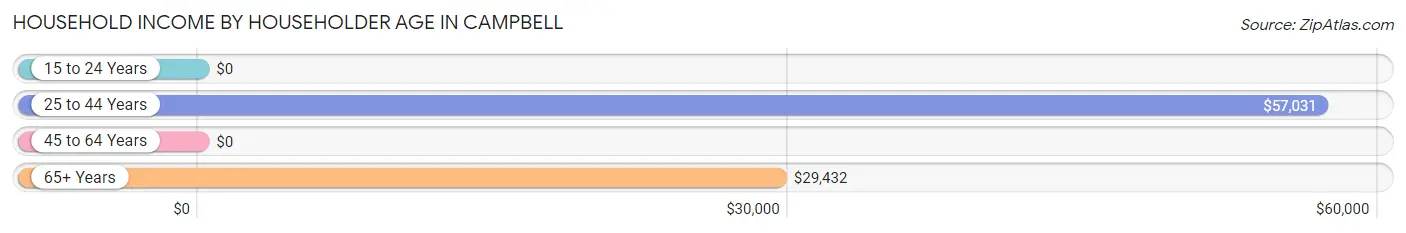
Household Income by Householder Age in Campbell
The median household income in Campbell is $45,577, with the highest median household income of $57,031 found in the 25 to 44 years age bracket for the primary householder. A total of 171 households (30.8%) fall into this category. Meanwhile, the 15 to 24 years age bracket for the primary householder has the lowest median household income of $0, with 23 households (4.1%) in this group.
| Income Bracket | # Households | Median Income |
| 15 to 24 Years | 23 (4.1%) | $0 |
| 25 to 44 Years | 171 (30.8%) | $57,031 |
| 45 to 64 Years | 233 (41.9%) | $0 |
| 65+ Years | 129 (23.2%) | $29,432 |
| Total | 556 (100.0%) | $45,577 |
Poverty in Campbell
Income Below Poverty by Sex and Age in Campbell
With 26.2% poverty level for males and 28.1% for females among the residents of Campbell, 16 and 17 year old males and 12 to 14 year old females are the most vulnerable to poverty, with 39 males (90.7%) and 6 females (75.0%) in their respective age groups living below the poverty level.
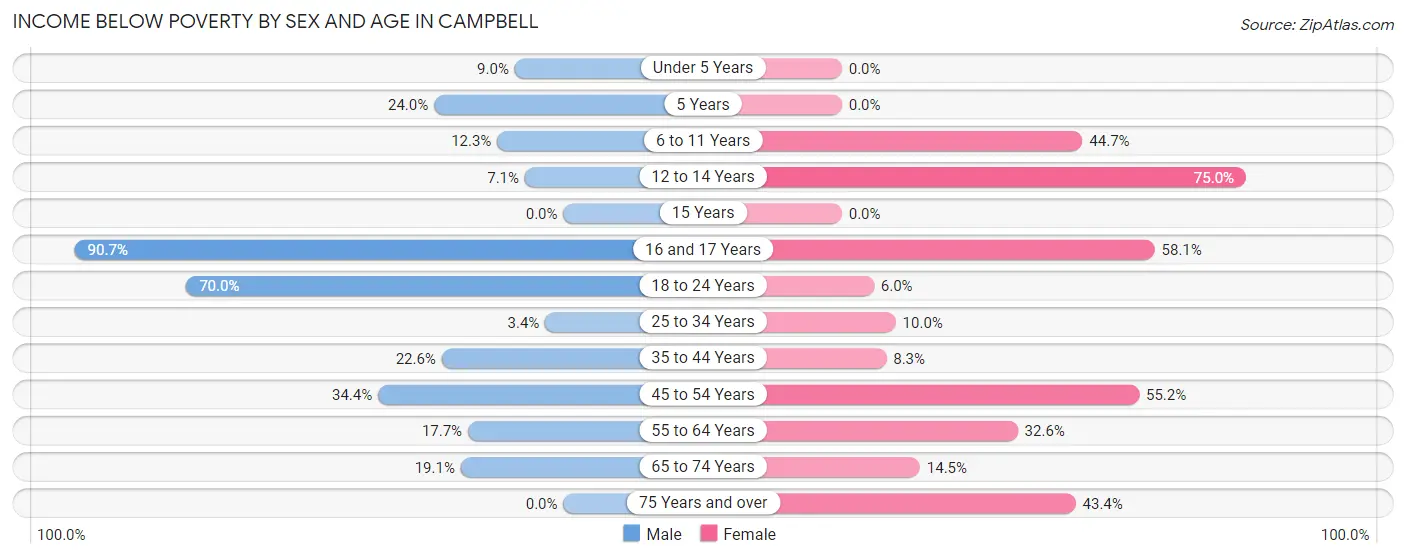
| Age Bracket | Male | Female |
| Under 5 Years | 12 (9.0%) | 0 (0.0%) |
| 5 Years | 6 (24.0%) | 0 (0.0%) |
| 6 to 11 Years | 7 (12.3%) | 46 (44.7%) |
| 12 to 14 Years | 2 (7.1%) | 6 (75.0%) |
| 15 Years | 0 (0.0%) | 0 (0.0%) |
| 16 and 17 Years | 39 (90.7%) | 18 (58.1%) |
| 18 to 24 Years | 63 (70.0%) | 5 (5.9%) |
| 25 to 34 Years | 3 (3.4%) | 4 (10.0%) |
| 35 to 44 Years | 14 (22.6%) | 9 (8.3%) |
| 45 to 54 Years | 43 (34.4%) | 48 (55.2%) |
| 55 to 64 Years | 17 (17.7%) | 47 (32.6%) |
| 65 to 74 Years | 4 (19.1%) | 10 (14.5%) |
| 75 Years and over | 0 (0.0%) | 23 (43.4%) |
| Total | 210 (26.2%) | 216 (28.1%) |
Income Above Poverty by Sex and Age in Campbell
According to the poverty statistics in Campbell, males aged 75 years and over and females aged under 5 years are the age groups that are most secure financially, with 100.0% of males and 100.0% of females in these age groups living above the poverty line.
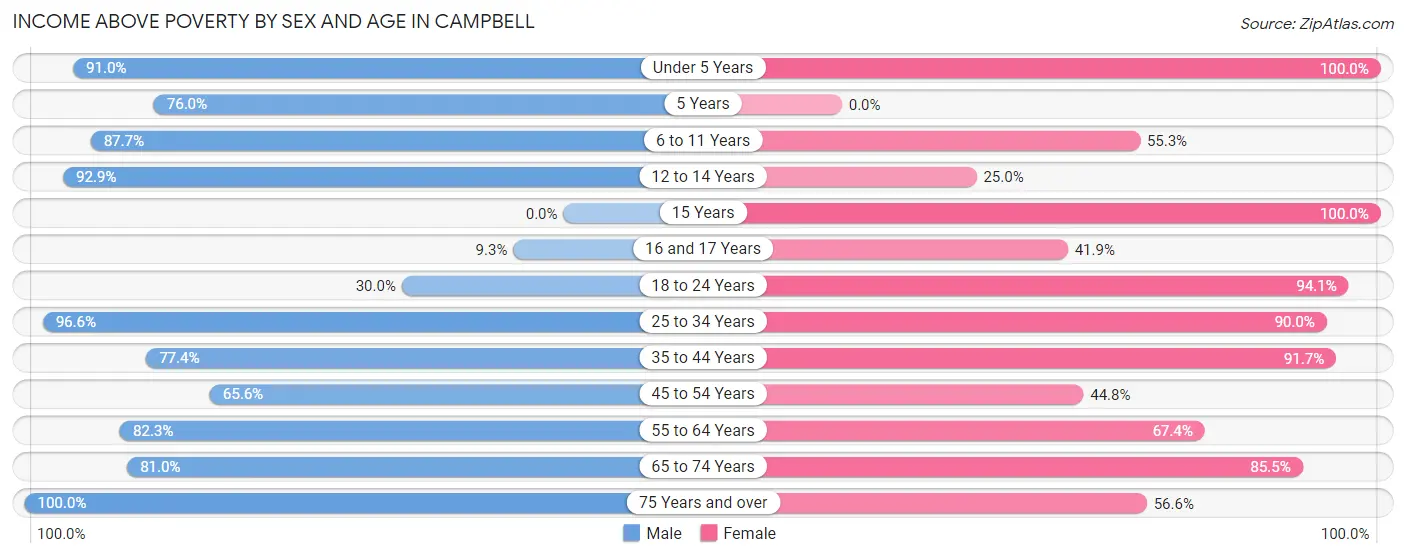
| Age Bracket | Male | Female |
| Under 5 Years | 121 (91.0%) | 23 (100.0%) |
| 5 Years | 19 (76.0%) | 0 (0.0%) |
| 6 to 11 Years | 50 (87.7%) | 57 (55.3%) |
| 12 to 14 Years | 26 (92.9%) | 2 (25.0%) |
| 15 Years | 0 (0.0%) | 18 (100.0%) |
| 16 and 17 Years | 4 (9.3%) | 13 (41.9%) |
| 18 to 24 Years | 27 (30.0%) | 79 (94.1%) |
| 25 to 34 Years | 86 (96.6%) | 36 (90.0%) |
| 35 to 44 Years | 48 (77.4%) | 100 (91.7%) |
| 45 to 54 Years | 82 (65.6%) | 39 (44.8%) |
| 55 to 64 Years | 79 (82.3%) | 97 (67.4%) |
| 65 to 74 Years | 17 (80.9%) | 59 (85.5%) |
| 75 Years and over | 32 (100.0%) | 30 (56.6%) |
| Total | 591 (73.8%) | 553 (71.9%) |
Income Below Poverty Among Married-Couple Families in Campbell
The poverty statistics for married-couple families in Campbell show that 5.8% or 14 of the total 241 families live below the poverty line. Families with 3 or 4 children have the highest poverty rate of 15.1%, comprising of 5 families. On the other hand, families with 1 or 2 children have the lowest poverty rate of 3.0%, which includes 4 families.
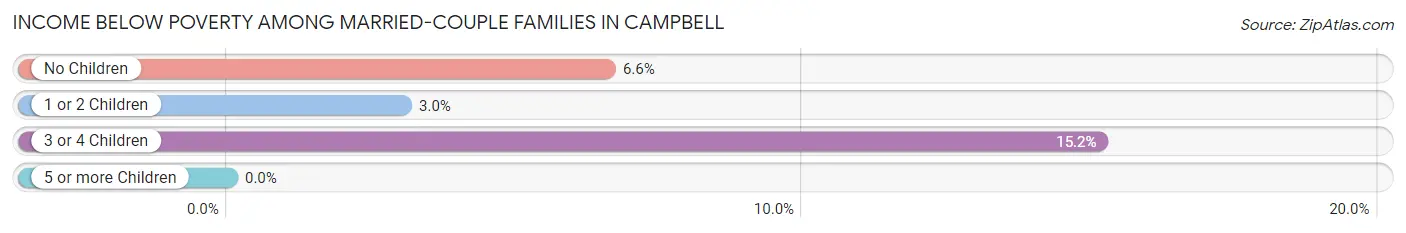
| Children | Above Poverty | Below Poverty |
| No Children | 71 (93.4%) | 5 (6.6%) |
| 1 or 2 Children | 128 (97.0%) | 4 (3.0%) |
| 3 or 4 Children | 28 (84.9%) | 5 (15.1%) |
| 5 or more Children | 0 (0.0%) | 0 (0.0%) |
| Total | 227 (94.2%) | 14 (5.8%) |
Income Below Poverty Among Single-Parent Households in Campbell
According to the poverty data in Campbell, 37.5% or 15 single-father households and 34.0% or 33 single-mother households are living below the poverty line. Among single-father households, those with 1 or 2 children have the highest poverty rate, with 15 households (40.5%) experiencing poverty. Likewise, among single-mother households, those with 1 or 2 children have the highest poverty rate, with 26 households (48.1%) falling below the poverty line.
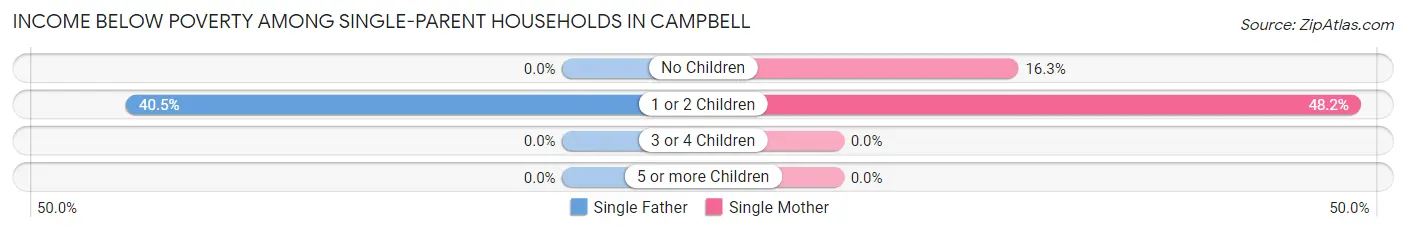
| Children | Single Father | Single Mother |
| No Children | 0 (0.0%) | 7 (16.3%) |
| 1 or 2 Children | 15 (40.5%) | 26 (48.1%) |
| 3 or 4 Children | 0 (0.0%) | 0 (0.0%) |
| 5 or more Children | 0 (0.0%) | 0 (0.0%) |
| Total | 15 (37.5%) | 33 (34.0%) |
Income Below Poverty Among Married-Couple vs Single-Parent Households in Campbell
The poverty data for Campbell shows that 14 of the married-couple family households (5.8%) and 48 of the single-parent households (35.0%) are living below the poverty level. Within the married-couple family households, those with 3 or 4 children have the highest poverty rate, with 5 households (15.1%) falling below the poverty line. Among the single-parent households, those with 1 or 2 children have the highest poverty rate, with 41 household (45.1%) living below poverty.
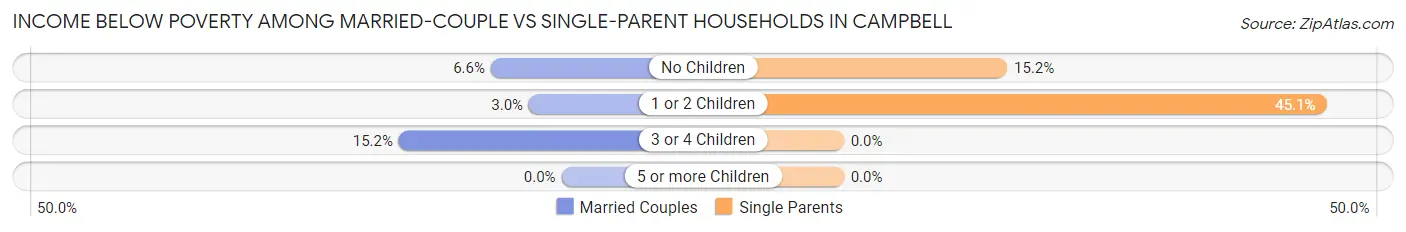
| Children | Married-Couple Families | Single-Parent Households |
| No Children | 5 (6.6%) | 7 (15.2%) |
| 1 or 2 Children | 4 (3.0%) | 41 (45.1%) |
| 3 or 4 Children | 5 (15.1%) | 0 (0.0%) |
| 5 or more Children | 0 (0.0%) | 0 (0.0%) |
| Total | 14 (5.8%) | 48 (35.0%) |
Race in Campbell
The most populous races in Campbell are White / Caucasian (1,319 | 80.5%), Two or more Races (285 | 17.4%), and Hawaiian / Pacific (22 | 1.3%).
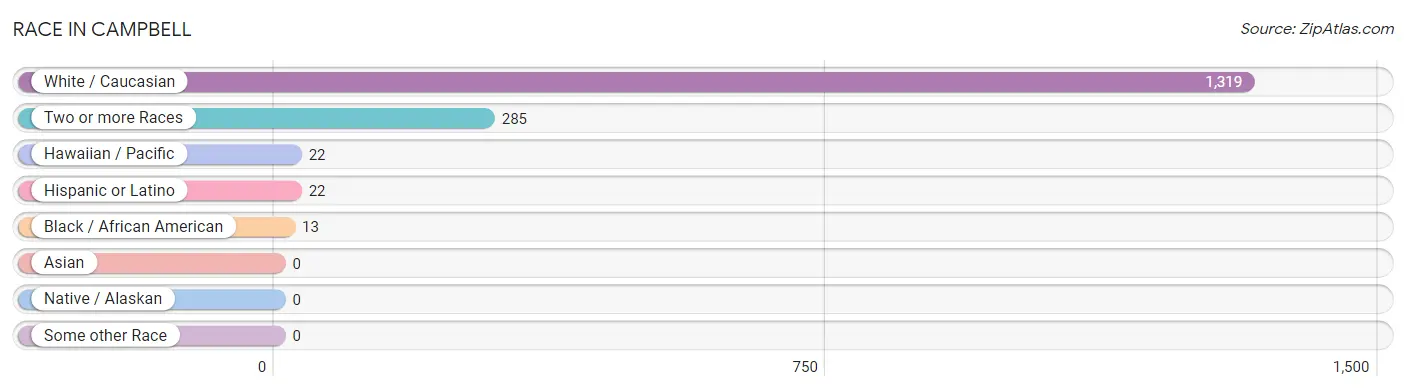
| Race | # Population | % Population |
| Asian | 0 | 0.0% |
| Black / African American | 13 | 0.8% |
| Hawaiian / Pacific | 22 | 1.3% |
| Hispanic or Latino | 22 | 1.3% |
| Native / Alaskan | 0 | 0.0% |
| White / Caucasian | 1,319 | 80.5% |
| Two or more Races | 285 | 17.4% |
| Some other Race | 0 | 0.0% |
| Total | 1,639 | 100.0% |
Ancestry in Campbell
The most populous ancestries reported in Campbell are German (232 | 14.1%), Irish (162 | 9.9%), American (139 | 8.5%), Cherokee (116 | 7.1%), and Dutch (111 | 6.8%), together accounting for 46.4% of all Campbell residents.
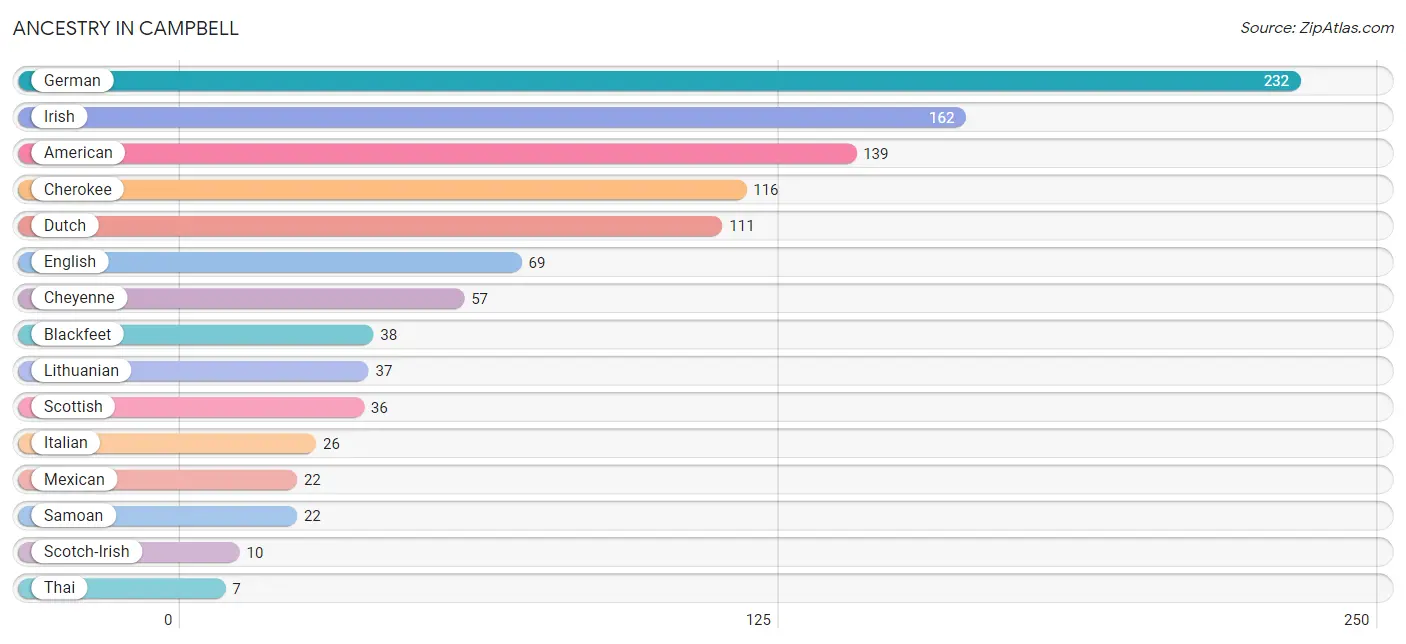
| Ancestry | # Population | % Population |
| American | 139 | 8.5% |
| Blackfeet | 38 | 2.3% |
| Cherokee | 116 | 7.1% |
| Cheyenne | 57 | 3.5% |
| Dutch | 111 | 6.8% |
| English | 69 | 4.2% |
| German | 232 | 14.1% |
| Irish | 162 | 9.9% |
| Italian | 26 | 1.6% |
| Lithuanian | 37 | 2.3% |
| Mexican | 22 | 1.3% |
| Polish | 2 | 0.1% |
| Samoan | 22 | 1.3% |
| Scotch-Irish | 10 | 0.6% |
| Scottish | 36 | 2.2% |
| Swedish | 6 | 0.4% |
| Thai | 7 | 0.4% |
| Welsh | 2 | 0.1% | View All 18 Rows |
Immigrants in Campbell

| Immigration Origin | # Population | % Population | View All 0 Rows |
Sex and Age in Campbell
Sex and Age in Campbell
The most populous age groups in Campbell are Under 5 Years (133 | 15.7%) for men and 35 to 39 Years (94 | 11.8%) for women.
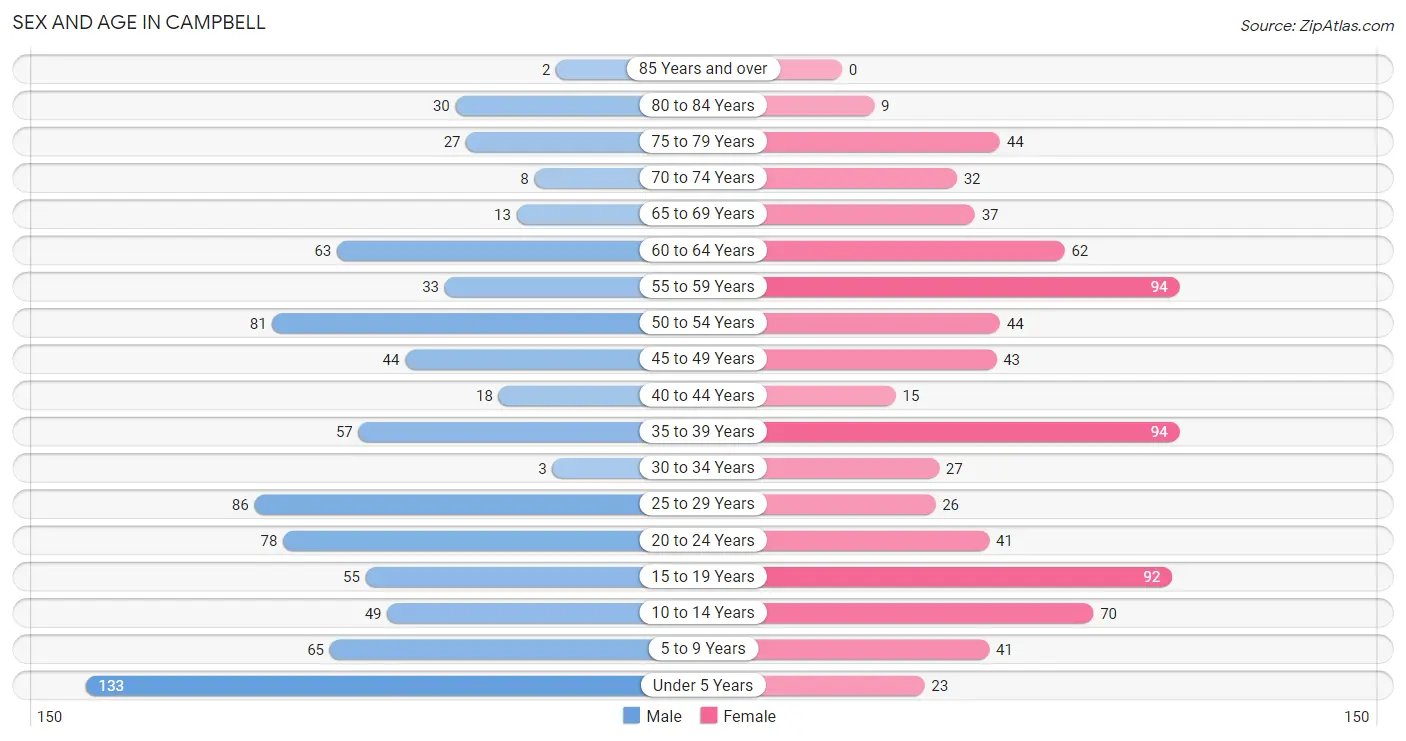
| Age Bracket | Male | Female |
| Under 5 Years | 133 (15.7%) | 23 (2.9%) |
| 5 to 9 Years | 65 (7.7%) | 41 (5.2%) |
| 10 to 14 Years | 49 (5.8%) | 70 (8.8%) |
| 15 to 19 Years | 55 (6.5%) | 92 (11.6%) |
| 20 to 24 Years | 78 (9.2%) | 41 (5.2%) |
| 25 to 29 Years | 86 (10.2%) | 26 (3.3%) |
| 30 to 34 Years | 3 (0.4%) | 27 (3.4%) |
| 35 to 39 Years | 57 (6.8%) | 94 (11.8%) |
| 40 to 44 Years | 18 (2.1%) | 15 (1.9%) |
| 45 to 49 Years | 44 (5.2%) | 43 (5.4%) |
| 50 to 54 Years | 81 (9.6%) | 44 (5.5%) |
| 55 to 59 Years | 33 (3.9%) | 94 (11.8%) |
| 60 to 64 Years | 63 (7.5%) | 62 (7.8%) |
| 65 to 69 Years | 13 (1.5%) | 37 (4.7%) |
| 70 to 74 Years | 8 (0.9%) | 32 (4.0%) |
| 75 to 79 Years | 27 (3.2%) | 44 (5.5%) |
| 80 to 84 Years | 30 (3.5%) | 9 (1.1%) |
| 85 Years and over | 2 (0.2%) | 0 (0.0%) |
| Total | 845 (100.0%) | 794 (100.0%) |
Families and Households in Campbell
Median Family Size in Campbell
The median family size in Campbell is 3.46 persons per family, with single male/father families (40 | 10.6%) accounting for the largest median family size of 3.9 persons per family. On the other hand, single female/mother families (97 | 25.7%) represent the smallest median family size with 2.80 persons per family.
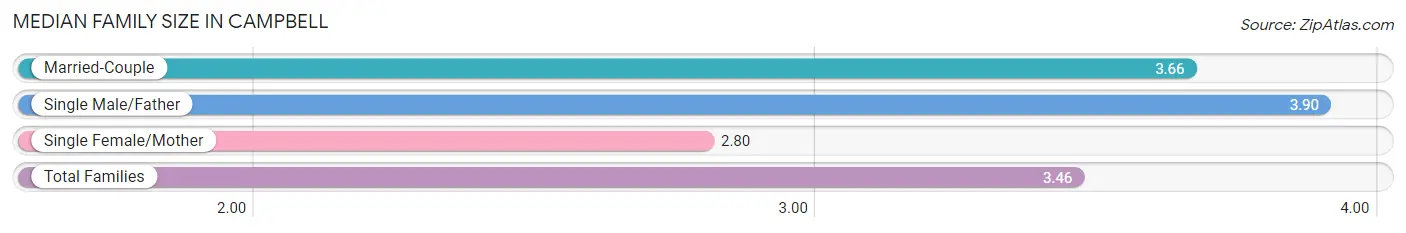
| Family Type | # Families | Family Size |
| Married-Couple | 241 (63.8%) | 3.66 |
| Single Male/Father | 40 (10.6%) | 3.90 |
| Single Female/Mother | 97 (25.7%) | 2.80 |
| Total Families | 378 (100.0%) | 3.46 |
Median Household Size in Campbell
The median household size in Campbell is 2.83 persons per household, with single male/father households (40 | 7.2%) accounting for the largest median household size of 4.28 persons per household. non-family households (178 | 32.0%) represent the smallest median household size with 1.30 persons per household.
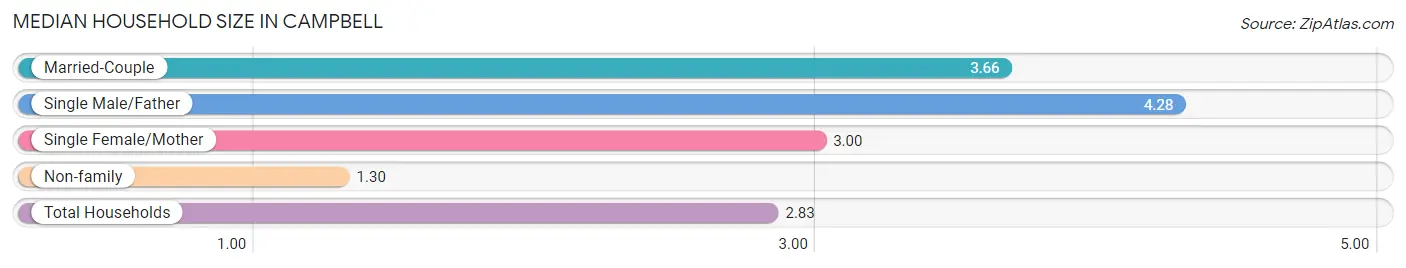
| Household Type | # Households | Household Size |
| Married-Couple | 241 (43.3%) | 3.66 |
| Single Male/Father | 40 (7.2%) | 4.28 |
| Single Female/Mother | 97 (17.4%) | 3.00 |
| Non-family | 178 (32.0%) | 1.30 |
| Total Households | 556 (100.0%) | 2.83 |
Household Size by Marriage Status in Campbell
Out of a total of 556 households in Campbell, 378 (68.0%) are family households, while 178 (32.0%) are nonfamily households. The most numerous type of family households are 4-person households, comprising 145, and the most common type of nonfamily households are 1-person households, comprising 140.
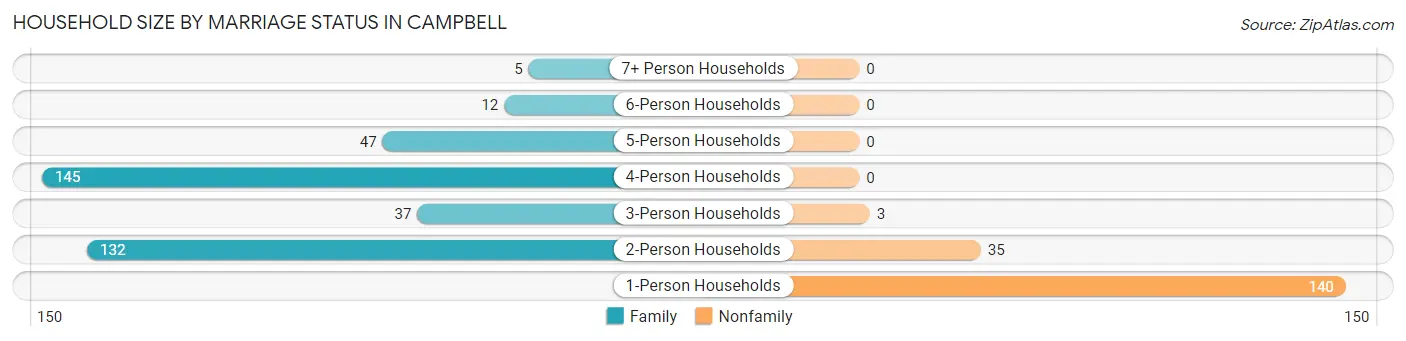
| Household Size | Family Households | Nonfamily Households |
| 1-Person Households | - | 140 (25.2%) |
| 2-Person Households | 132 (23.7%) | 35 (6.3%) |
| 3-Person Households | 37 (6.7%) | 3 (0.5%) |
| 4-Person Households | 145 (26.1%) | 0 (0.0%) |
| 5-Person Households | 47 (8.5%) | 0 (0.0%) |
| 6-Person Households | 12 (2.2%) | 0 (0.0%) |
| 7+ Person Households | 5 (0.9%) | 0 (0.0%) |
| Total | 378 (68.0%) | 178 (32.0%) |
Female Fertility in Campbell
Fertility by Age in Campbell
Average fertility rate in Campbell is 78.0 births per 1,000 women. Women in the age bracket of 20 to 34 years have the highest fertility rate with 287.0 births per 1,000 women. Women in the age bracket of 20 to 34 years acount for 100.0% of all women with births.
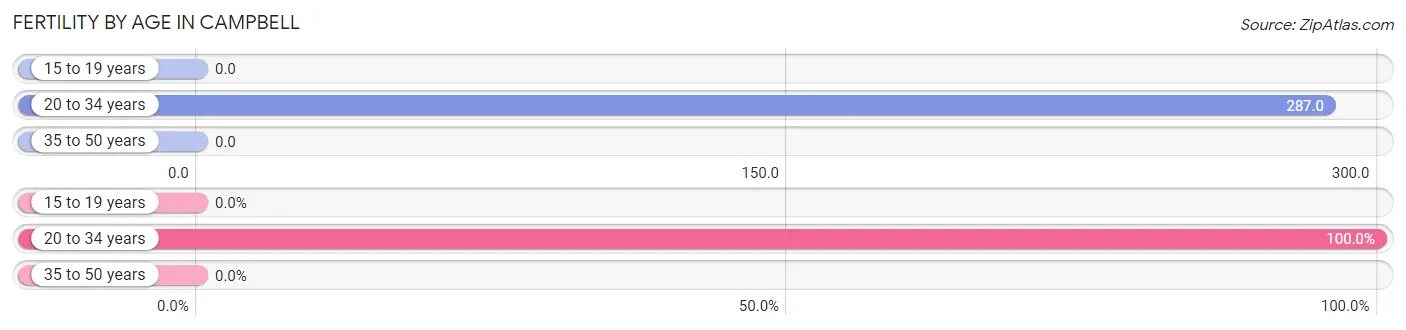
| Age Bracket | Women with Births | Births / 1,000 Women |
| 15 to 19 years | 0 (0.0%) | 0.0 |
| 20 to 34 years | 27 (100.0%) | 287.0 |
| 35 to 50 years | 0 (0.0%) | 0.0 |
| Total | 27 (100.0%) | 78.0 |
Fertility by Age by Marriage Status in Campbell
40.7% of women with births (27) in Campbell are married. The highest percentage of unmarried women with births falls into 20 to 34 years age bracket with 59.3% of them unmarried at the time of birth, while the lowest percentage of unmarried women with births belong to 20 to 34 years age bracket with 59.3% of them unmarried.
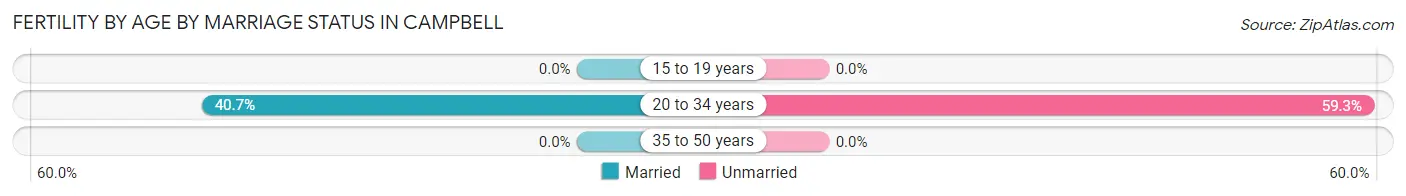
| Age Bracket | Married | Unmarried |
| 15 to 19 years | 0 (0.0%) | 0 (0.0%) |
| 20 to 34 years | 11 (40.7%) | 16 (59.3%) |
| 35 to 50 years | 0 (0.0%) | 0 (0.0%) |
| Total | 11 (40.7%) | 16 (59.3%) |
Fertility by Education in Campbell
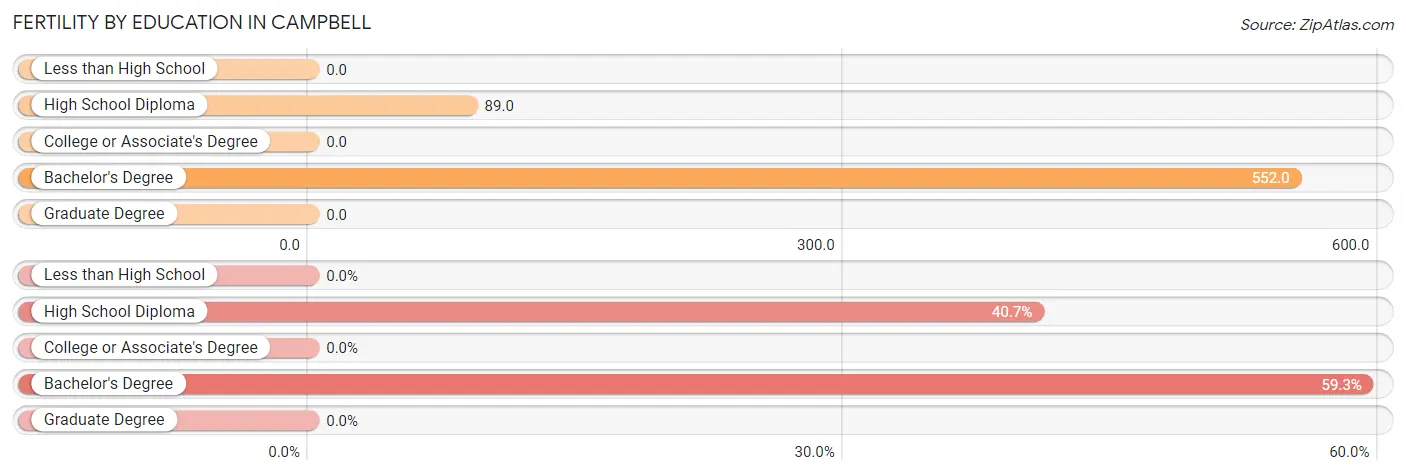
| Educational Attainment | Women with Births | Births / 1,000 Women |
| Less than High School | 0 (0.0%) | 0.0 |
| High School Diploma | 11 (40.7%) | 89.0 |
| College or Associate's Degree | 0 (0.0%) | 0.0 |
| Bachelor's Degree | 16 (59.3%) | 552.0 |
| Graduate Degree | 0 (0.0%) | 0.0 |
| Total | 27 (100.0%) | 78.0 |
Fertility by Education by Marriage Status in Campbell
59.3% of women with births in Campbell are unmarried. Women with the educational attainment of high school diploma are most likely to be married with 100.0% of them married at childbirth, while women with the educational attainment of bachelor's degree are least likely to be married with 100.0% of them unmarried at childbirth.
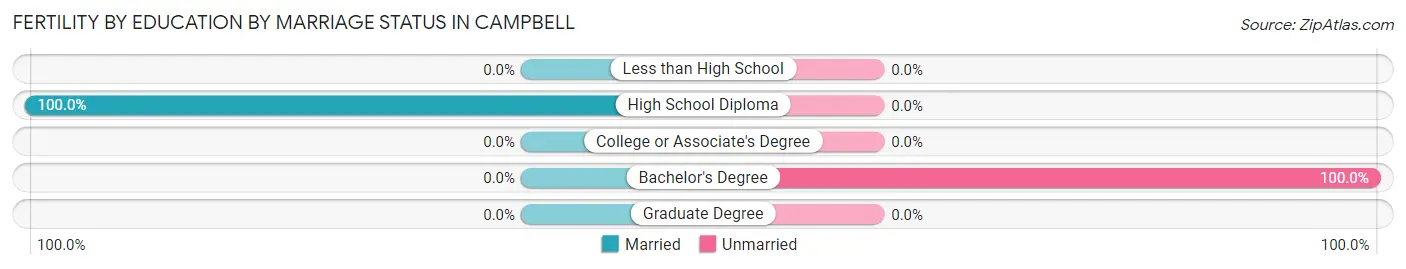
| Educational Attainment | Married | Unmarried |
| Less than High School | 0 (0.0%) | 0 (0.0%) |
| High School Diploma | 11 (100.0%) | 0 (0.0%) |
| College or Associate's Degree | 0 (0.0%) | 0 (0.0%) |
| Bachelor's Degree | 0 (0.0%) | 16 (100.0%) |
| Graduate Degree | 0 (0.0%) | 0 (0.0%) |
| Total | 11 (40.7%) | 16 (59.3%) |
Employment Characteristics in Campbell
Employment by Class of Employer in Campbell
Among the 570 employed individuals in Campbell, private company employees (363 | 63.7%), state government employees (76 | 13.3%), and local government employees (56 | 9.8%) make up the most common classes of employment.
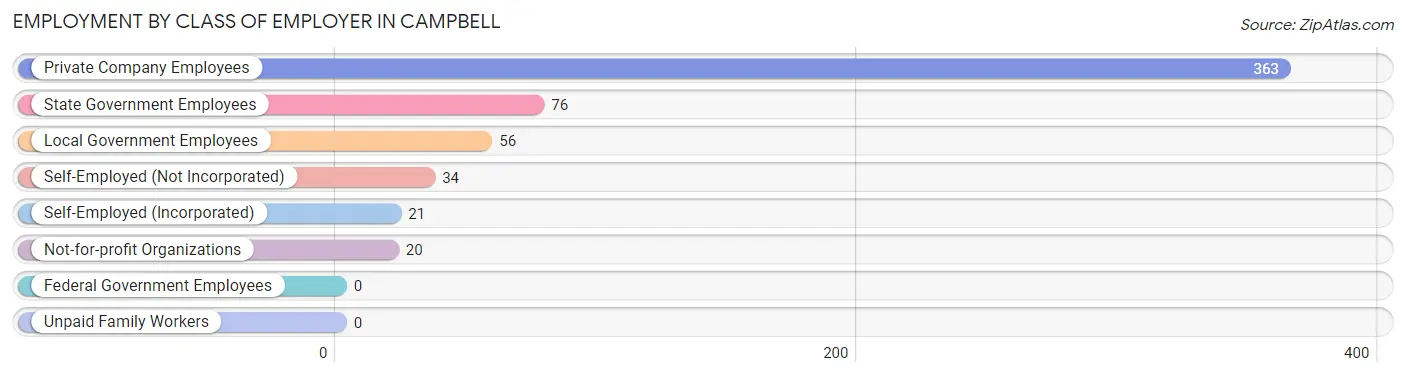
| Employer Class | # Employees | % Employees |
| Private Company Employees | 363 | 63.7% |
| Self-Employed (Incorporated) | 21 | 3.7% |
| Self-Employed (Not Incorporated) | 34 | 6.0% |
| Not-for-profit Organizations | 20 | 3.5% |
| Local Government Employees | 56 | 9.8% |
| State Government Employees | 76 | 13.3% |
| Federal Government Employees | 0 | 0.0% |
| Unpaid Family Workers | 0 | 0.0% |
| Total | 570 | 100.0% |
Employment Status by Age in Campbell
According to the labor force statistics for Campbell, out of the total population over 16 years of age (1,240), 50.4% or 625 individuals are in the labor force, with 8.0% or 50 of them unemployed. The age group with the highest labor force participation rate is 20 to 24 years, with 83.2% or 99 individuals in the labor force. Within the labor force, the 20 to 24 years age range has the highest percentage of unemployed individuals, with 48.5% or 48 of them being unemployed.
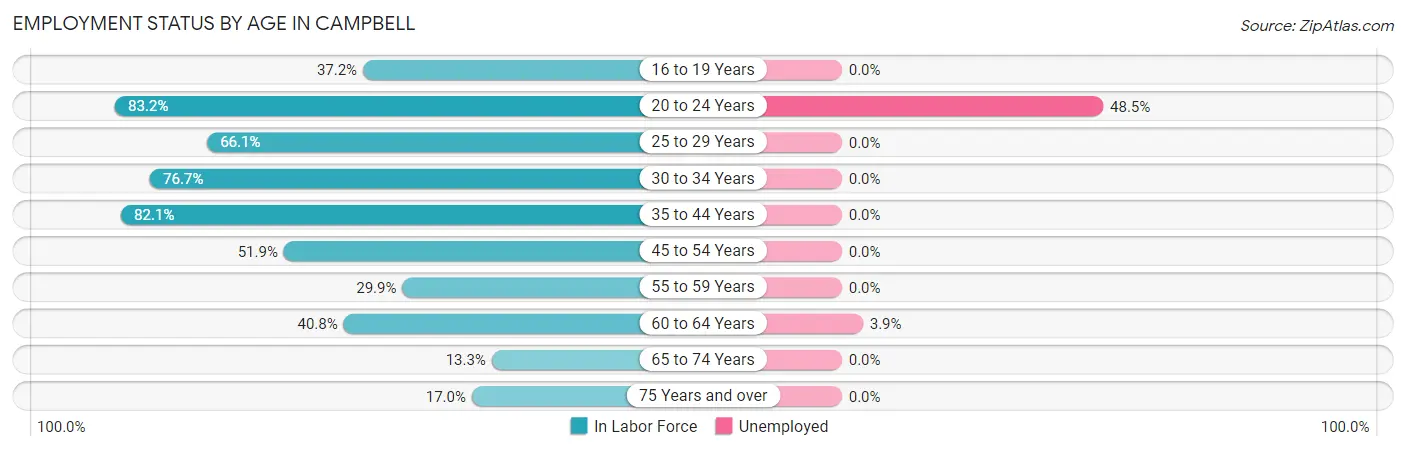
| Age Bracket | In Labor Force | Unemployed |
| 16 to 19 Years | 48 (37.2%) | 0 (0.0%) |
| 20 to 24 Years | 99 (83.2%) | 48 (48.5%) |
| 25 to 29 Years | 74 (66.1%) | 0 (0.0%) |
| 30 to 34 Years | 23 (76.7%) | 0 (0.0%) |
| 35 to 44 Years | 151 (82.1%) | 0 (0.0%) |
| 45 to 54 Years | 110 (51.9%) | 0 (0.0%) |
| 55 to 59 Years | 38 (29.9%) | 0 (0.0%) |
| 60 to 64 Years | 51 (40.8%) | 2 (3.9%) |
| 65 to 74 Years | 12 (13.3%) | 0 (0.0%) |
| 75 Years and over | 19 (17.0%) | 0 (0.0%) |
| Total | 625 (50.4%) | 50 (8.0%) |
Employment Status by Educational Attainment in Campbell
According to labor force statistics for Campbell, 56.6% of individuals (447) out of the total population between 25 and 64 years of age (790) are in the labor force, with 0.4% or 2 of them being unemployed. The group with the highest labor force participation rate are those with the educational attainment of bachelor's degree or higher, with 69.6% or 32 individuals in the labor force. Within the labor force, individuals with college / associate degree education have the highest percentage of unemployment, with 1.7% or 2 of them being unemployed.
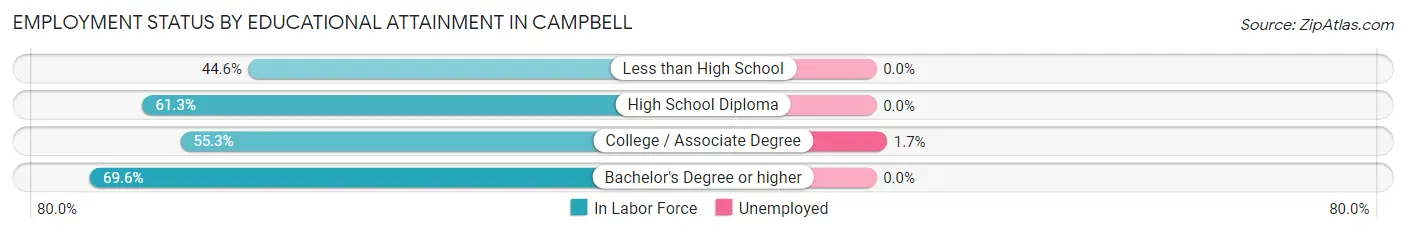
| Educational Attainment | In Labor Force | Unemployed |
| Less than High School | 75 (44.6%) | 0 (0.0%) |
| High School Diploma | 220 (61.3%) | 0 (0.0%) |
| College / Associate Degree | 120 (55.3%) | 4 (1.7%) |
| Bachelor's Degree or higher | 32 (69.6%) | 0 (0.0%) |
| Total | 447 (56.6%) | 3 (0.4%) |
Employment Occupations by Sex in Campbell
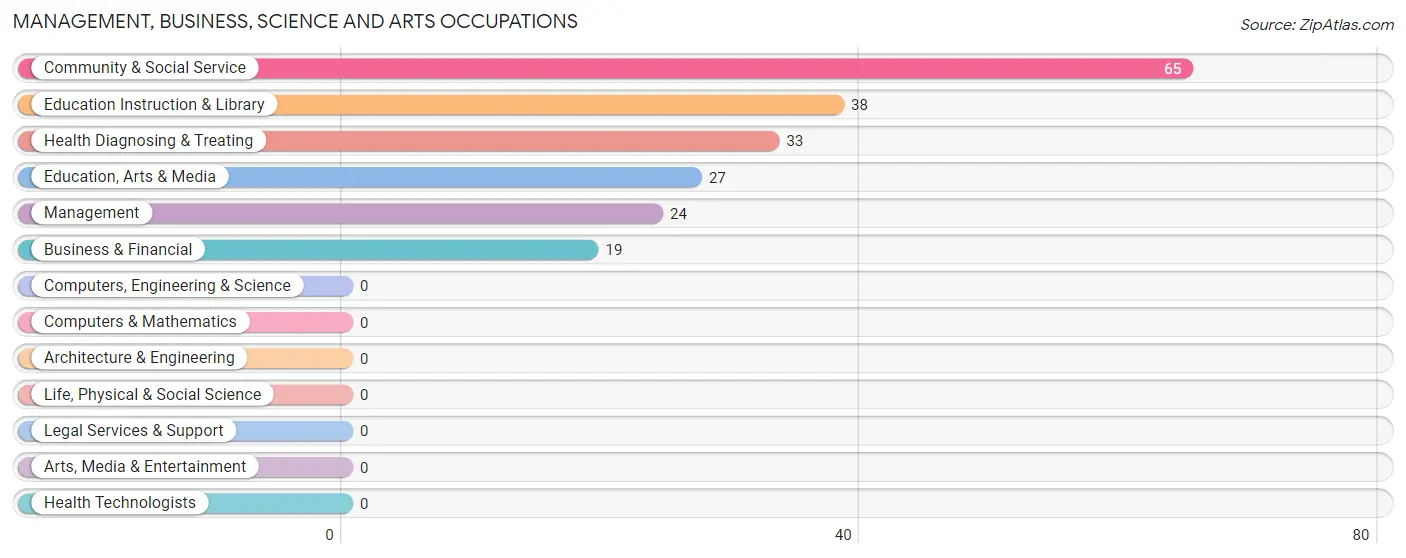
Management, Business, Science and Arts Occupations
The most common Management, Business, Science and Arts occupations in Campbell are Community & Social Service (65 | 11.3%), Education Instruction & Library (38 | 6.6%), Health Diagnosing & Treating (33 | 5.7%), Education, Arts & Media (27 | 4.7%), and Management (24 | 4.2%).
Management, Business, Science and Arts Occupations by Sex
Within the Management, Business, Science and Arts occupations in Campbell, the most male-oriented occupations are Business & Financial (84.2%), and Management (79.2%), while the most female-oriented occupations are Community & Social Service (100.0%), Education, Arts & Media (100.0%), and Education Instruction & Library (100.0%).
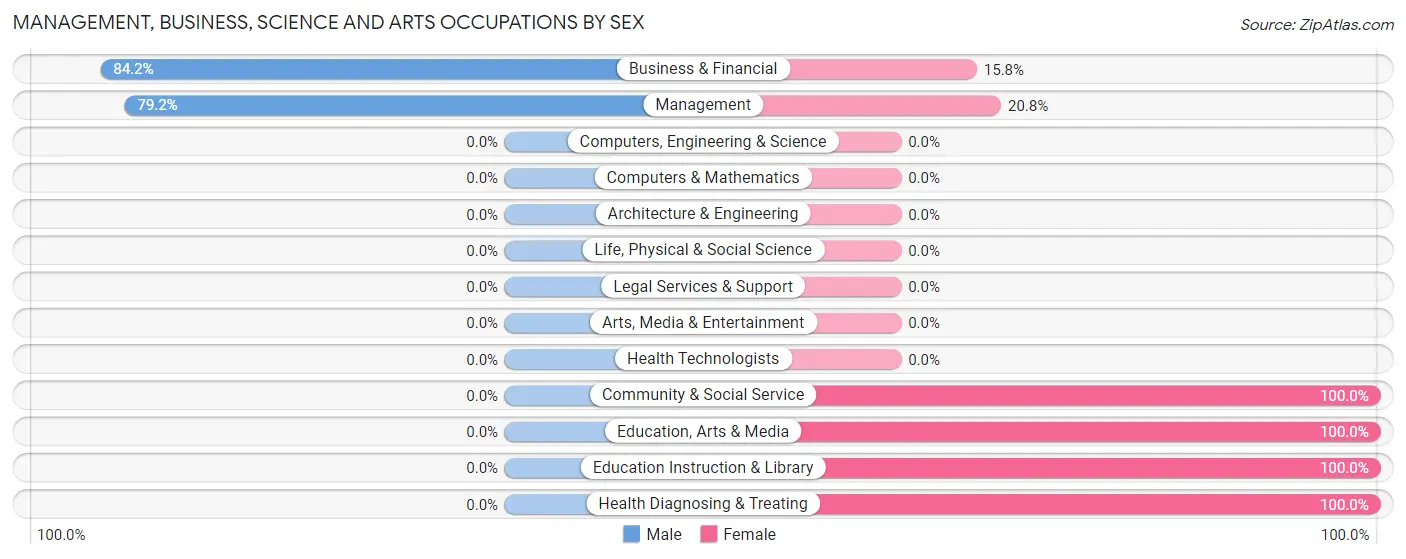
| Occupation | Male | Female |
| Management | 19 (79.2%) | 5 (20.8%) |
| Business & Financial | 16 (84.2%) | 3 (15.8%) |
| Computers, Engineering & Science | 0 (0.0%) | 0 (0.0%) |
| Computers & Mathematics | 0 (0.0%) | 0 (0.0%) |
| Architecture & Engineering | 0 (0.0%) | 0 (0.0%) |
| Life, Physical & Social Science | 0 (0.0%) | 0 (0.0%) |
| Community & Social Service | 0 (0.0%) | 65 (100.0%) |
| Education, Arts & Media | 0 (0.0%) | 27 (100.0%) |
| Legal Services & Support | 0 (0.0%) | 0 (0.0%) |
| Education Instruction & Library | 0 (0.0%) | 38 (100.0%) |
| Arts, Media & Entertainment | 0 (0.0%) | 0 (0.0%) |
| Health Diagnosing & Treating | 0 (0.0%) | 33 (100.0%) |
| Health Technologists | 0 (0.0%) | 0 (0.0%) |
| Total (Category) | 35 (24.8%) | 106 (75.2%) |
| Total (Overall) | 270 (47.0%) | 305 (53.0%) |
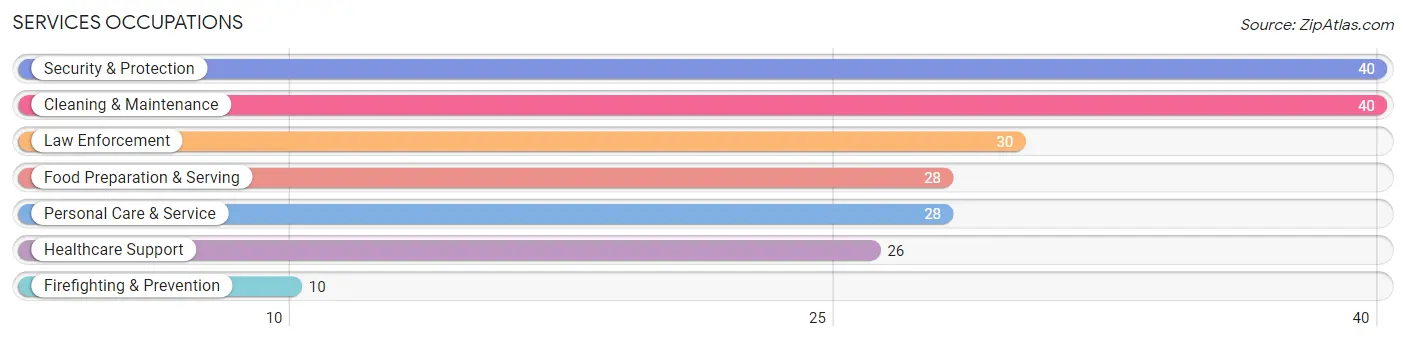
Services Occupations
The most common Services occupations in Campbell are Security & Protection (40 | 7.0%), Cleaning & Maintenance (40 | 7.0%), Law Enforcement (30 | 5.2%), Food Preparation & Serving (28 | 4.9%), and Personal Care & Service (28 | 4.9%).
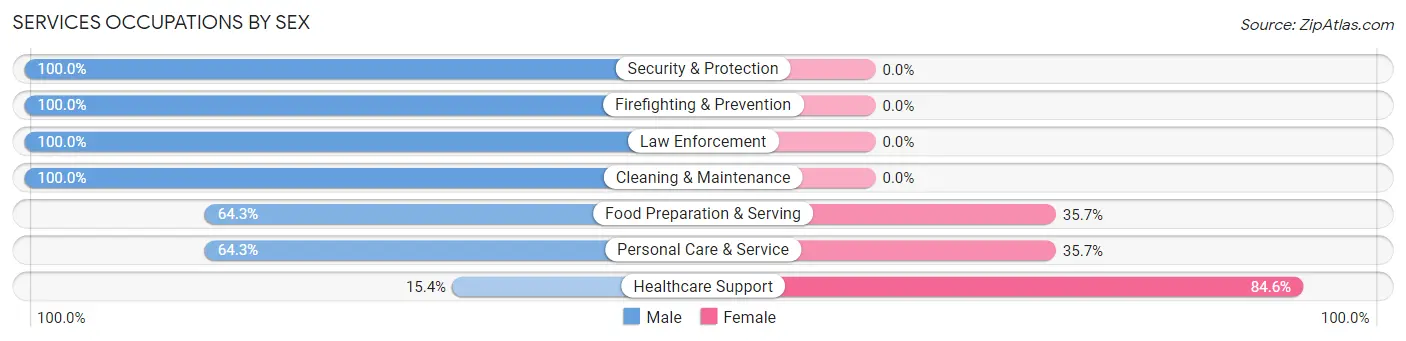
Services Occupations by Sex
Within the Services occupations in Campbell, the most male-oriented occupations are Security & Protection (100.0%), Firefighting & Prevention (100.0%), and Law Enforcement (100.0%), while the most female-oriented occupations are Healthcare Support (84.6%), Food Preparation & Serving (35.7%), and Personal Care & Service (35.7%).
| Occupation | Male | Female |
| Healthcare Support | 4 (15.4%) | 22 (84.6%) |
| Security & Protection | 40 (100.0%) | 0 (0.0%) |
| Firefighting & Prevention | 10 (100.0%) | 0 (0.0%) |
| Law Enforcement | 30 (100.0%) | 0 (0.0%) |
| Food Preparation & Serving | 18 (64.3%) | 10 (35.7%) |
| Cleaning & Maintenance | 40 (100.0%) | 0 (0.0%) |
| Personal Care & Service | 18 (64.3%) | 10 (35.7%) |
| Total (Category) | 120 (74.1%) | 42 (25.9%) |
| Total (Overall) | 270 (47.0%) | 305 (53.0%) |
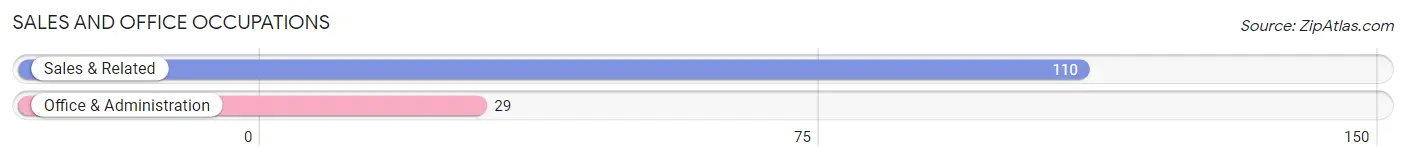
Sales and Office Occupations
The most common Sales and Office occupations in Campbell are Sales & Related (110 | 19.1%), and Office & Administration (29 | 5.0%).
Sales and Office Occupations by Sex
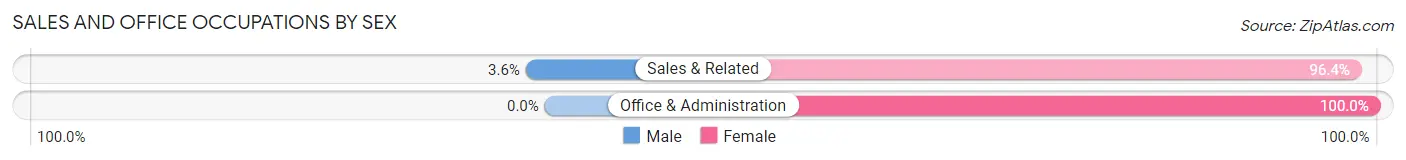
| Occupation | Male | Female |
| Sales & Related | 4 (3.6%) | 106 (96.4%) |
| Office & Administration | 0 (0.0%) | 29 (100.0%) |
| Total (Category) | 4 (2.9%) | 135 (97.1%) |
| Total (Overall) | 270 (47.0%) | 305 (53.0%) |
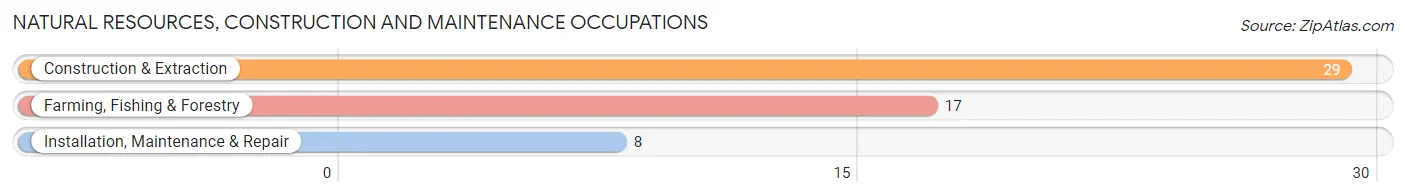
Natural Resources, Construction and Maintenance Occupations
The most common Natural Resources, Construction and Maintenance occupations in Campbell are Construction & Extraction (29 | 5.0%), Farming, Fishing & Forestry (17 | 3.0%), and Installation, Maintenance & Repair (8 | 1.4%).
Natural Resources, Construction and Maintenance Occupations by Sex
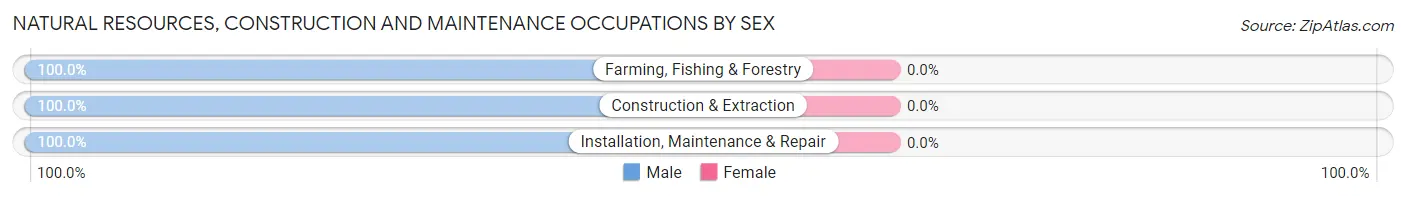
| Occupation | Male | Female |
| Farming, Fishing & Forestry | 17 (100.0%) | 0 (0.0%) |
| Construction & Extraction | 29 (100.0%) | 0 (0.0%) |
| Installation, Maintenance & Repair | 8 (100.0%) | 0 (0.0%) |
| Total (Category) | 54 (100.0%) | 0 (0.0%) |
| Total (Overall) | 270 (47.0%) | 305 (53.0%) |
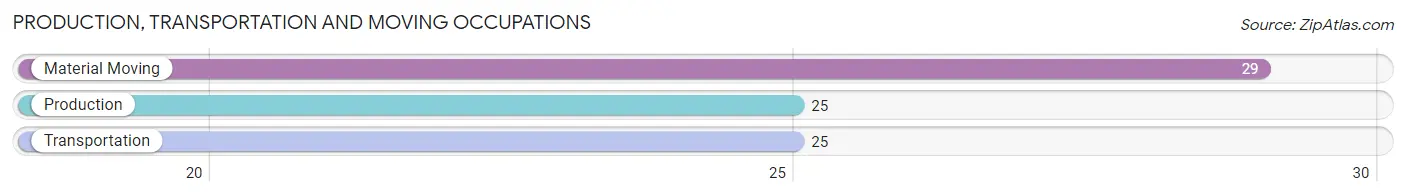
Production, Transportation and Moving Occupations
The most common Production, Transportation and Moving occupations in Campbell are Material Moving (29 | 5.0%), Production (25 | 4.3%), and Transportation (25 | 4.3%).
Production, Transportation and Moving Occupations by Sex
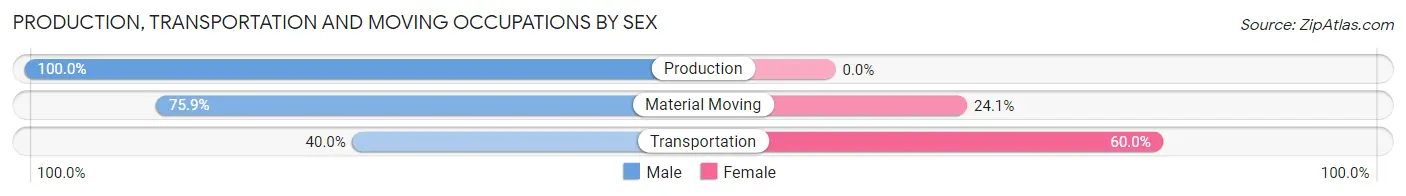
| Occupation | Male | Female |
| Production | 25 (100.0%) | 0 (0.0%) |
| Transportation | 10 (40.0%) | 15 (60.0%) |
| Material Moving | 22 (75.9%) | 7 (24.1%) |
| Total (Category) | 57 (72.2%) | 22 (27.9%) |
| Total (Overall) | 270 (47.0%) | 305 (53.0%) |
Employment Industries by Sex in Campbell
Employment Industries in Campbell
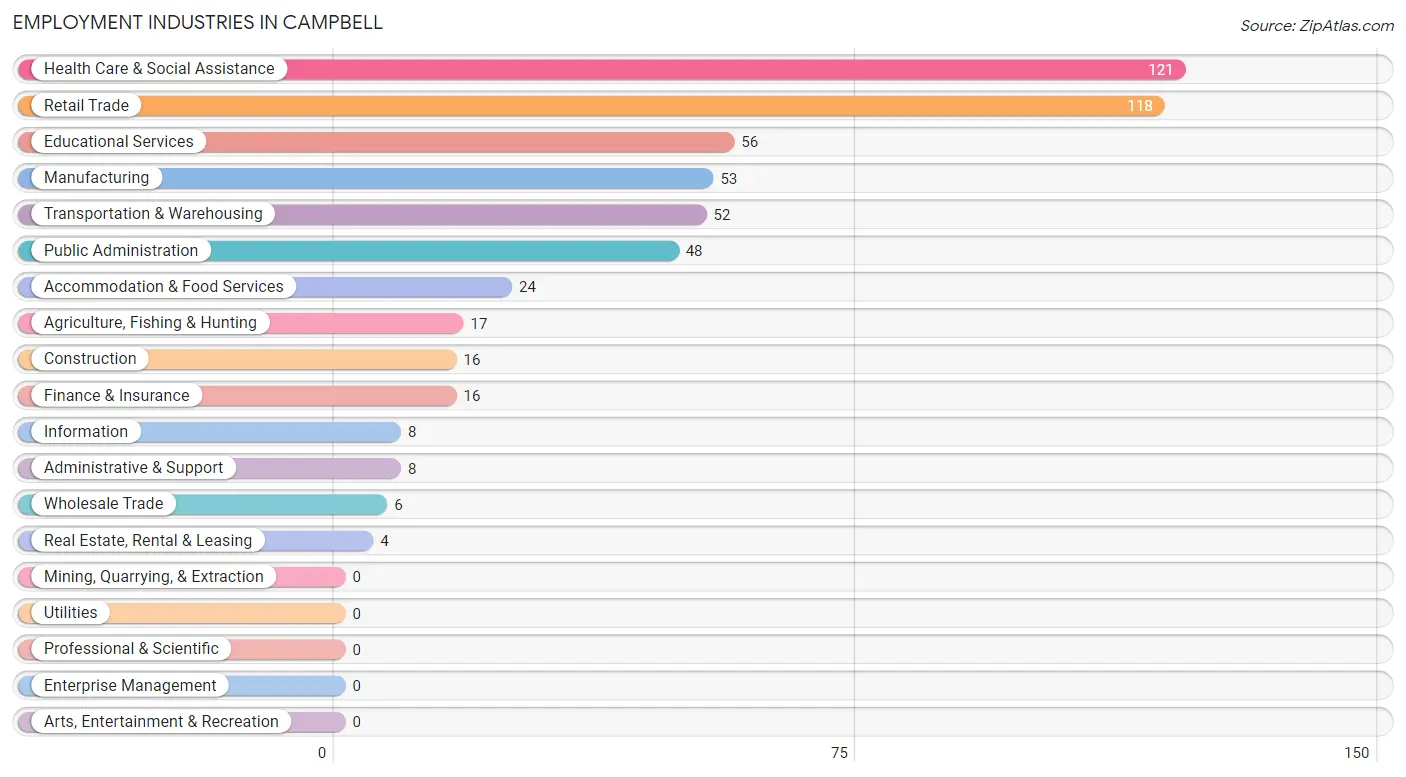
The major employment industries in Campbell include Health Care & Social Assistance (121 | 21.0%), Retail Trade (118 | 20.5%), Educational Services (56 | 9.7%), Manufacturing (53 | 9.2%), and Transportation & Warehousing (52 | 9.0%).
Employment Industries by Sex in Campbell
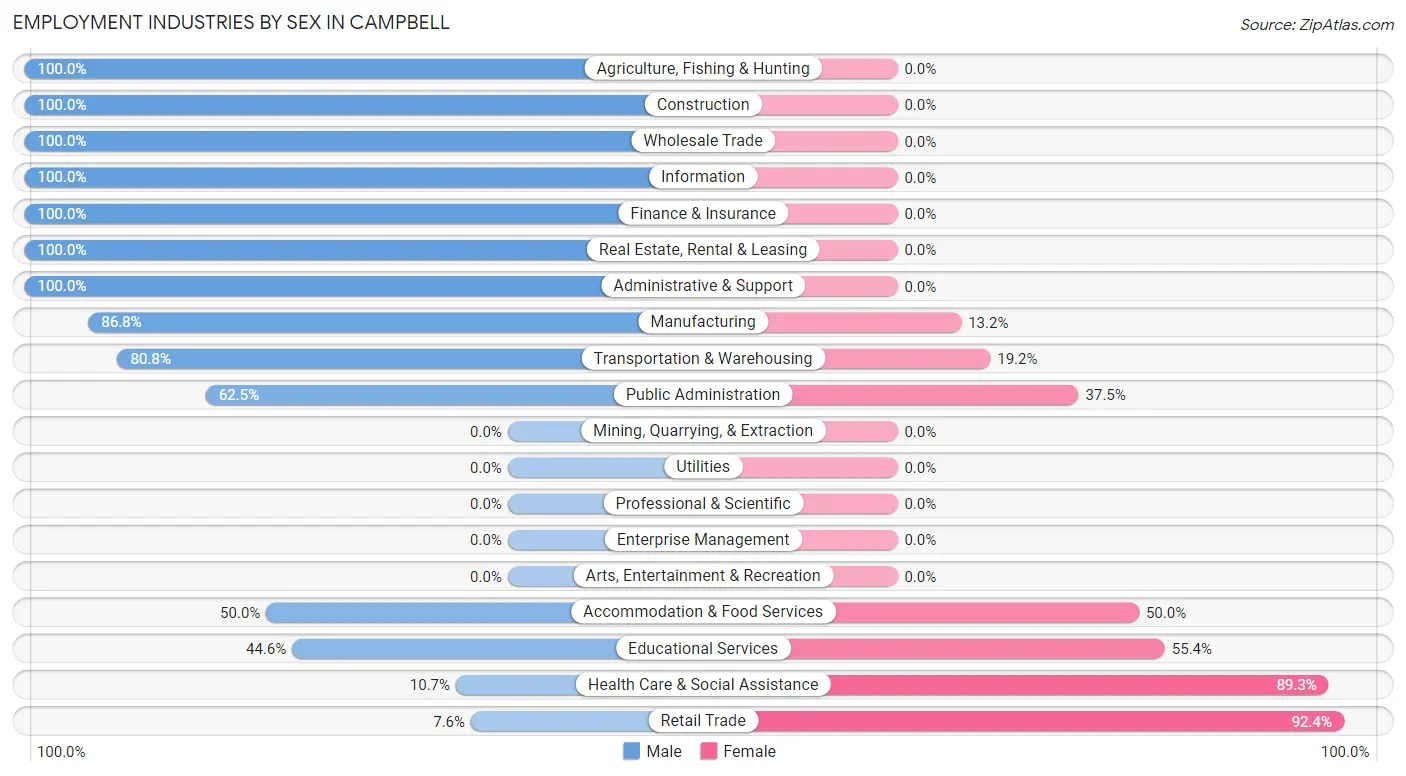
The Campbell industries that see more men than women are Agriculture, Fishing & Hunting (100.0%), Construction (100.0%), and Wholesale Trade (100.0%), whereas the industries that tend to have a higher number of women are Retail Trade (92.4%), Health Care & Social Assistance (89.3%), and Educational Services (55.4%).
| Industry | Male | Female |
| Agriculture, Fishing & Hunting | 17 (100.0%) | 0 (0.0%) |
| Mining, Quarrying, & Extraction | 0 (0.0%) | 0 (0.0%) |
| Construction | 16 (100.0%) | 0 (0.0%) |
| Manufacturing | 46 (86.8%) | 7 (13.2%) |
| Wholesale Trade | 6 (100.0%) | 0 (0.0%) |
| Retail Trade | 9 (7.6%) | 109 (92.4%) |
| Transportation & Warehousing | 42 (80.8%) | 10 (19.2%) |
| Utilities | 0 (0.0%) | 0 (0.0%) |
| Information | 8 (100.0%) | 0 (0.0%) |
| Finance & Insurance | 16 (100.0%) | 0 (0.0%) |
| Real Estate, Rental & Leasing | 4 (100.0%) | 0 (0.0%) |
| Professional & Scientific | 0 (0.0%) | 0 (0.0%) |
| Enterprise Management | 0 (0.0%) | 0 (0.0%) |
| Administrative & Support | 8 (100.0%) | 0 (0.0%) |
| Educational Services | 25 (44.6%) | 31 (55.4%) |
| Health Care & Social Assistance | 13 (10.7%) | 108 (89.3%) |
| Arts, Entertainment & Recreation | 0 (0.0%) | 0 (0.0%) |
| Accommodation & Food Services | 12 (50.0%) | 12 (50.0%) |
| Public Administration | 30 (62.5%) | 18 (37.5%) |
| Total | 270 (47.0%) | 305 (53.0%) |
Education in Campbell
School Enrollment in Campbell
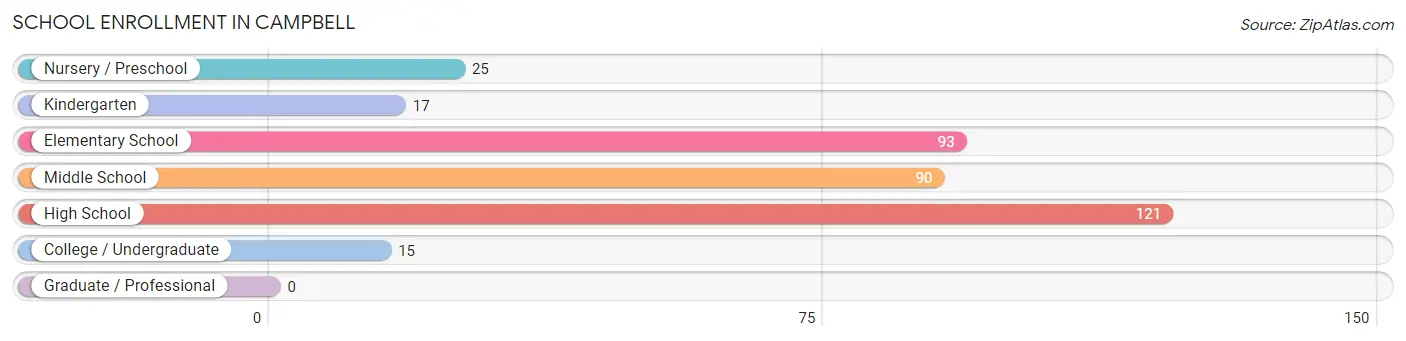
The most common levels of schooling among the 361 students in Campbell are high school (121 | 33.5%), elementary school (93 | 25.8%), and middle school (90 | 24.9%).
| School Level | # Students | % Students |
| Nursery / Preschool | 25 | 6.9% |
| Kindergarten | 17 | 4.7% |
| Elementary School | 93 | 25.8% |
| Middle School | 90 | 24.9% |
| High School | 121 | 33.5% |
| College / Undergraduate | 15 | 4.2% |
| Graduate / Professional | 0 | 0.0% |
| Total | 361 | 100.0% |
School Enrollment by Age by Funding Source in Campbell
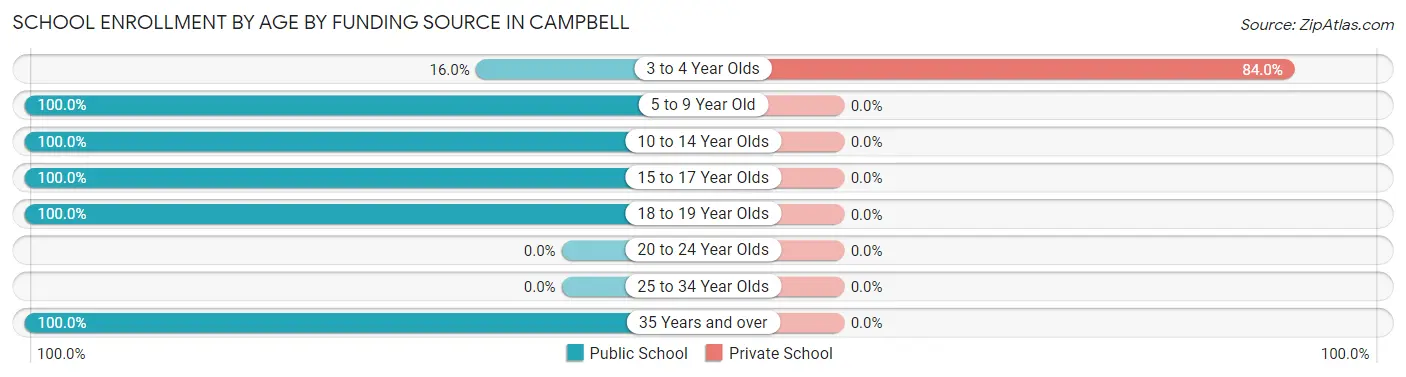
Out of a total of 361 students who are enrolled in schools in Campbell, 21 (5.8%) attend a private institution, while the remaining 340 (94.2%) are enrolled in public schools. The age group of 3 to 4 year olds has the highest likelihood of being enrolled in private schools, with 21 (84.0% in the age bracket) enrolled. Conversely, the age group of 5 to 9 year old has the lowest likelihood of being enrolled in a private school, with 81 (100.0% in the age bracket) attending a public institution.
| Age Bracket | Public School | Private School |
| 3 to 4 Year Olds | 4 (16.0%) | 21 (84.0%) |
| 5 to 9 Year Old | 81 (100.0%) | 0 (0.0%) |
| 10 to 14 Year Olds | 119 (100.0%) | 0 (0.0%) |
| 15 to 17 Year Olds | 92 (100.0%) | 0 (0.0%) |
| 18 to 19 Year Olds | 41 (100.0%) | 0 (0.0%) |
| 20 to 24 Year Olds | 0 (0.0%) | 0 (0.0%) |
| 25 to 34 Year Olds | 0 (0.0%) | 0 (0.0%) |
| 35 Years and over | 3 (100.0%) | 0 (0.0%) |
| Total | 340 (94.2%) | 21 (5.8%) |
Educational Attainment by Field of Study in Campbell
Education (20 | 30.3%), business (16 | 24.2%), social sciences (6 | 9.1%), science & technology (6 | 9.1%), and psychology (5 | 7.6%) are the most common fields of study among 66 individuals in Campbell who have obtained a bachelor's degree or higher.

| Field of Study | # Graduates | % Graduates |
| Computers & Mathematics | 3 | 4.5% |
| Bio, Nature & Agricultural | 0 | 0.0% |
| Physical & Health Sciences | 0 | 0.0% |
| Psychology | 5 | 7.6% |
| Social Sciences | 6 | 9.1% |
| Engineering | 0 | 0.0% |
| Multidisciplinary Studies | 3 | 4.5% |
| Science & Technology | 6 | 9.1% |
| Business | 16 | 24.2% |
| Education | 20 | 30.3% |
| Literature & Languages | 0 | 0.0% |
| Liberal Arts & History | 0 | 0.0% |
| Visual & Performing Arts | 5 | 7.6% |
| Communications | 0 | 0.0% |
| Arts & Humanities | 2 | 3.0% |
| Total | 66 | 100.0% |
Transportation & Commute in Campbell
Vehicle Availability by Sex in Campbell
The most prevalent vehicle ownership categories in Campbell are males with 2 vehicles (95, accounting for 35.8%) and females with 2 vehicles (114, making up 31.1%).
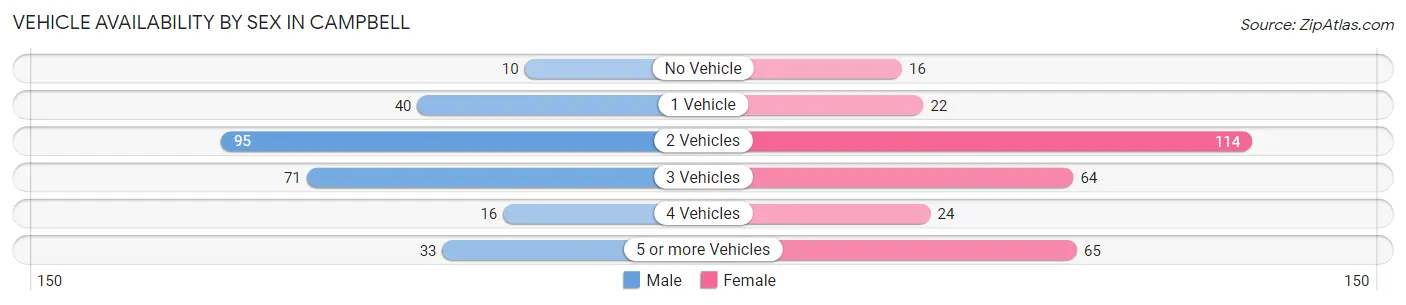
| Vehicles Available | Male | Female |
| No Vehicle | 10 (3.8%) | 16 (5.2%) |
| 1 Vehicle | 40 (15.1%) | 22 (7.2%) |
| 2 Vehicles | 95 (35.8%) | 114 (37.4%) |
| 3 Vehicles | 71 (26.8%) | 64 (21.0%) |
| 4 Vehicles | 16 (6.0%) | 24 (7.9%) |
| 5 or more Vehicles | 33 (12.4%) | 65 (21.3%) |
| Total | 265 (100.0%) | 305 (100.0%) |
Commute Time in Campbell
The most frequently occuring commute durations in Campbell are less than 5 minutes (121 commuters, 21.8%), 20 to 24 minutes (121 commuters, 21.8%), and 30 to 34 minutes (49 commuters, 8.8%).
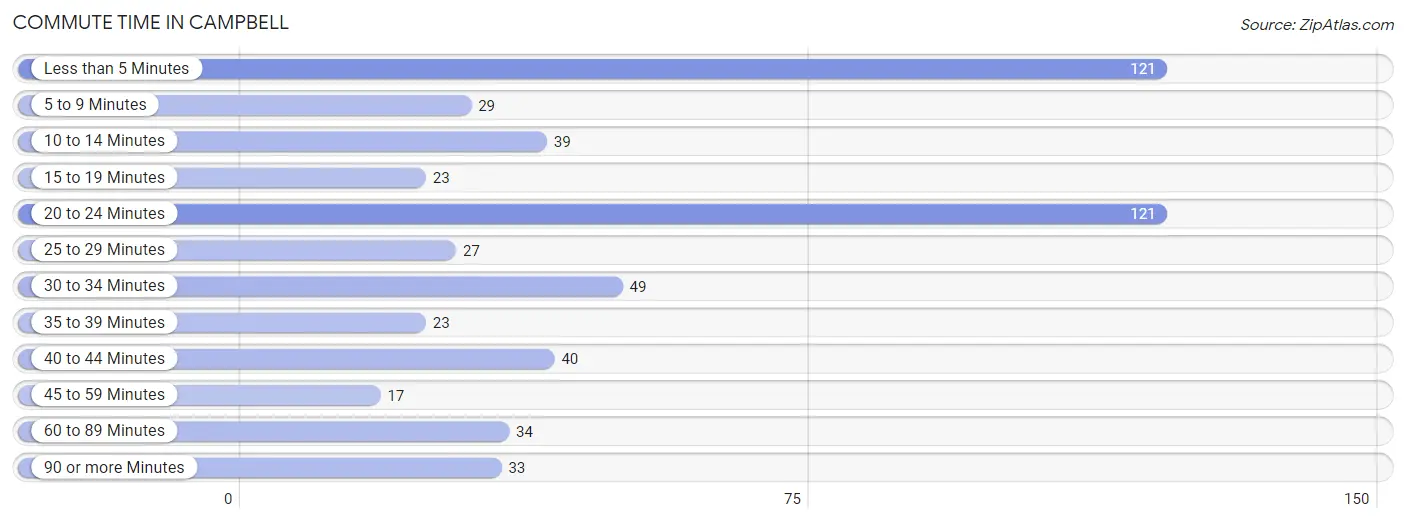
| Commute Time | # Commuters | % Commuters |
| Less than 5 Minutes | 121 | 21.8% |
| 5 to 9 Minutes | 29 | 5.2% |
| 10 to 14 Minutes | 39 | 7.0% |
| 15 to 19 Minutes | 23 | 4.1% |
| 20 to 24 Minutes | 121 | 21.8% |
| 25 to 29 Minutes | 27 | 4.9% |
| 30 to 34 Minutes | 49 | 8.8% |
| 35 to 39 Minutes | 23 | 4.1% |
| 40 to 44 Minutes | 40 | 7.2% |
| 45 to 59 Minutes | 17 | 3.1% |
| 60 to 89 Minutes | 34 | 6.1% |
| 90 or more Minutes | 33 | 5.9% |
Commute Time by Sex in Campbell
The most common commute times in Campbell are 20 to 24 minutes (75 commuters, 28.3%) for males and less than 5 minutes (102 commuters, 35.0%) for females.
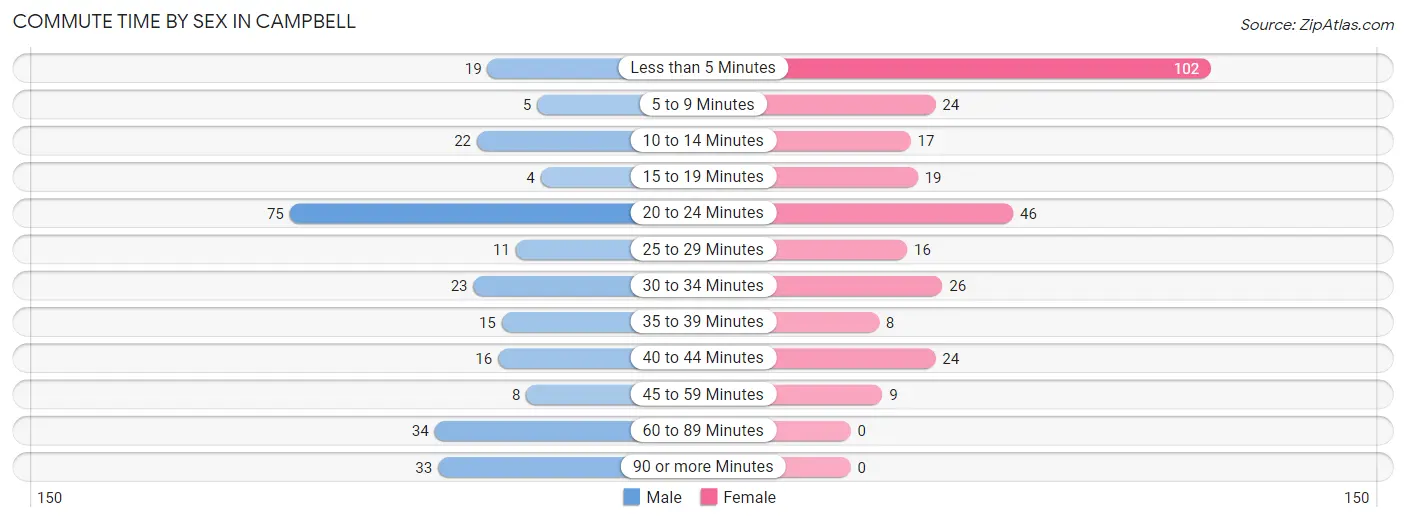
| Commute Time | Male | Female |
| Less than 5 Minutes | 19 (7.2%) | 102 (35.0%) |
| 5 to 9 Minutes | 5 (1.9%) | 24 (8.3%) |
| 10 to 14 Minutes | 22 (8.3%) | 17 (5.8%) |
| 15 to 19 Minutes | 4 (1.5%) | 19 (6.5%) |
| 20 to 24 Minutes | 75 (28.3%) | 46 (15.8%) |
| 25 to 29 Minutes | 11 (4.2%) | 16 (5.5%) |
| 30 to 34 Minutes | 23 (8.7%) | 26 (8.9%) |
| 35 to 39 Minutes | 15 (5.7%) | 8 (2.8%) |
| 40 to 44 Minutes | 16 (6.0%) | 24 (8.3%) |
| 45 to 59 Minutes | 8 (3.0%) | 9 (3.1%) |
| 60 to 89 Minutes | 34 (12.8%) | 0 (0.0%) |
| 90 or more Minutes | 33 (12.4%) | 0 (0.0%) |
Time of Departure to Work by Sex in Campbell
The most frequent times of departure to work in Campbell are 12:00 AM to 4:59 AM (69, 26.0%) for males and 7:30 AM to 7:59 AM (93, 32.0%) for females.
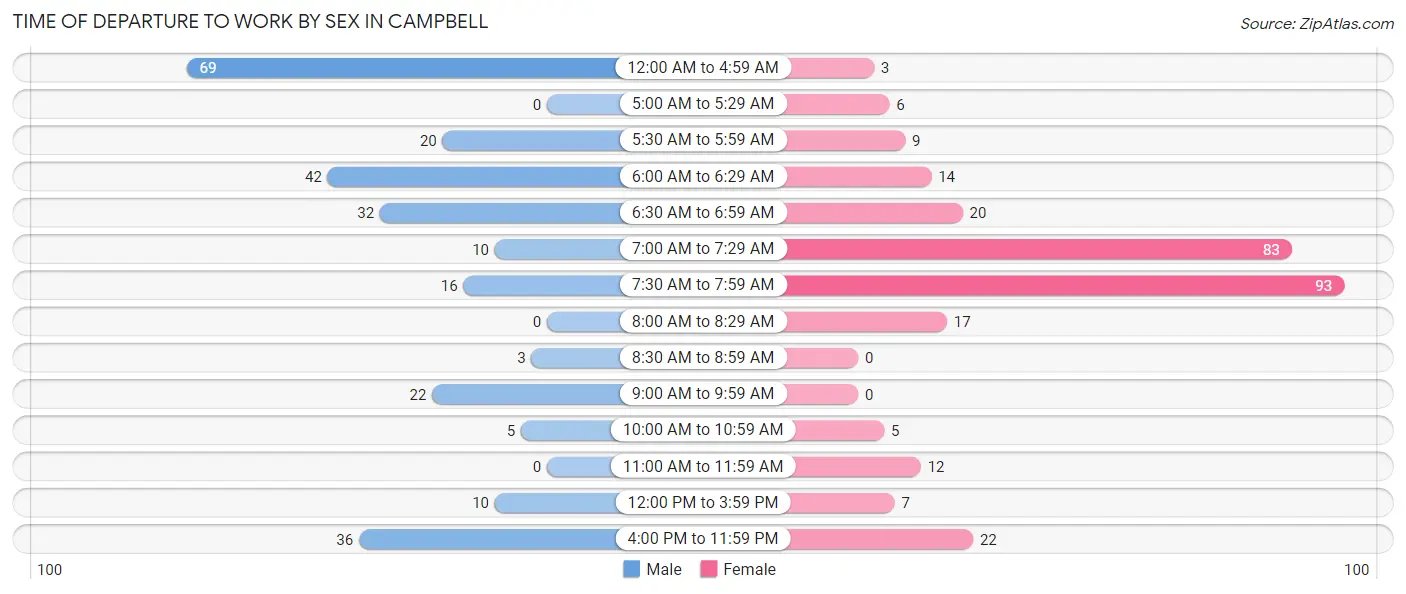
| Time of Departure | Male | Female |
| 12:00 AM to 4:59 AM | 69 (26.0%) | 3 (1.0%) |
| 5:00 AM to 5:29 AM | 0 (0.0%) | 6 (2.1%) |
| 5:30 AM to 5:59 AM | 20 (7.5%) | 9 (3.1%) |
| 6:00 AM to 6:29 AM | 42 (15.9%) | 14 (4.8%) |
| 6:30 AM to 6:59 AM | 32 (12.1%) | 20 (6.9%) |
| 7:00 AM to 7:29 AM | 10 (3.8%) | 83 (28.5%) |
| 7:30 AM to 7:59 AM | 16 (6.0%) | 93 (32.0%) |
| 8:00 AM to 8:29 AM | 0 (0.0%) | 17 (5.8%) |
| 8:30 AM to 8:59 AM | 3 (1.1%) | 0 (0.0%) |
| 9:00 AM to 9:59 AM | 22 (8.3%) | 0 (0.0%) |
| 10:00 AM to 10:59 AM | 5 (1.9%) | 5 (1.7%) |
| 11:00 AM to 11:59 AM | 0 (0.0%) | 12 (4.1%) |
| 12:00 PM to 3:59 PM | 10 (3.8%) | 7 (2.4%) |
| 4:00 PM to 11:59 PM | 36 (13.6%) | 22 (7.6%) |
| Total | 265 (100.0%) | 291 (100.0%) |
Housing Occupancy in Campbell
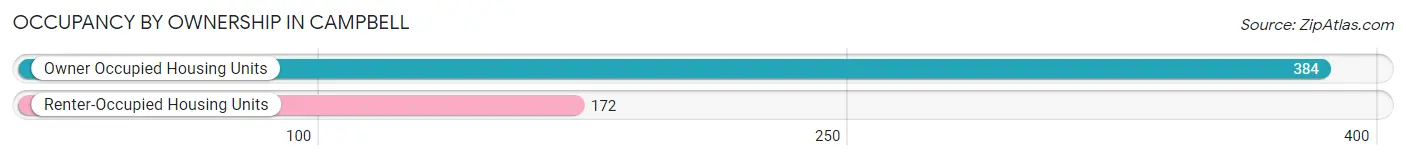
Occupancy by Ownership in Campbell
Of the total 556 dwellings in Campbell, owner-occupied units account for 384 (69.1%), while renter-occupied units make up 172 (30.9%).
| Occupancy | # Housing Units | % Housing Units |
| Owner Occupied Housing Units | 384 | 69.1% |
| Renter-Occupied Housing Units | 172 | 30.9% |
| Total Occupied Housing Units | 556 | 100.0% |
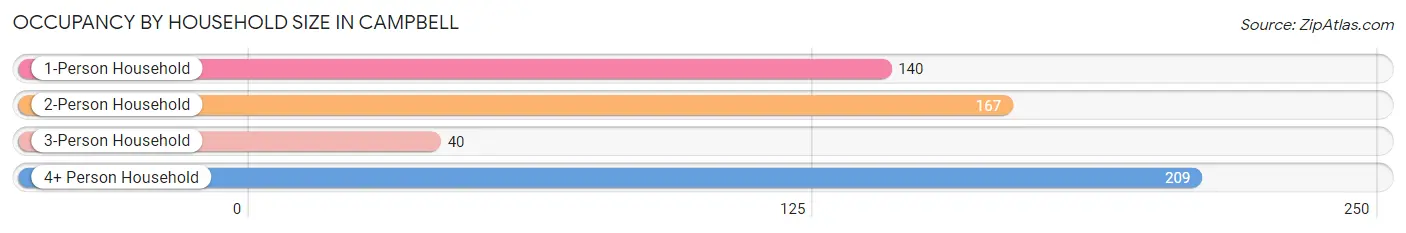
Occupancy by Household Size in Campbell
| Household Size | # Housing Units | % Housing Units |
| 1-Person Household | 140 | 25.2% |
| 2-Person Household | 167 | 30.0% |
| 3-Person Household | 40 | 7.2% |
| 4+ Person Household | 209 | 37.6% |
| Total Housing Units | 556 | 100.0% |
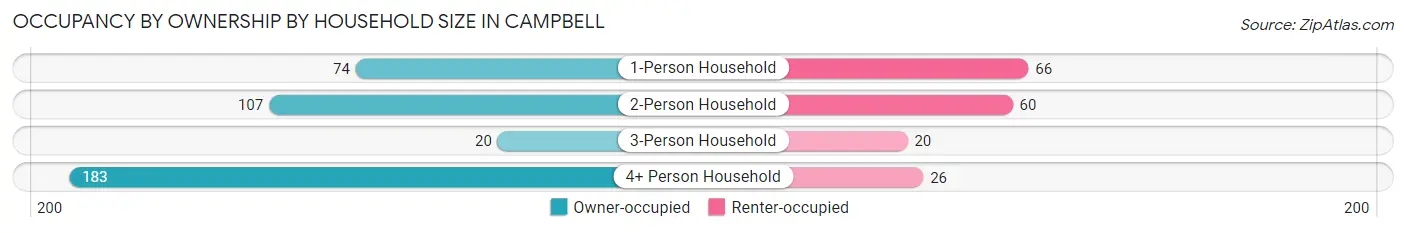
Occupancy by Ownership by Household Size in Campbell
| Household Size | Owner-occupied | Renter-occupied |
| 1-Person Household | 74 (52.9%) | 66 (47.1%) |
| 2-Person Household | 107 (64.1%) | 60 (35.9%) |
| 3-Person Household | 20 (50.0%) | 20 (50.0%) |
| 4+ Person Household | 183 (87.6%) | 26 (12.4%) |
| Total Housing Units | 384 (69.1%) | 172 (30.9%) |
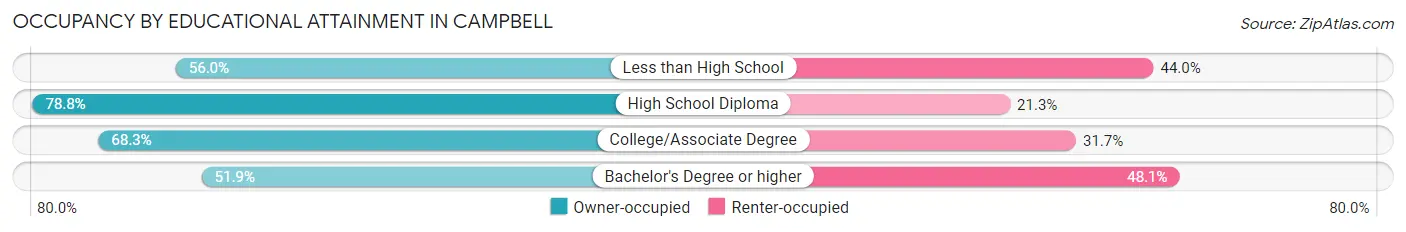
Occupancy by Educational Attainment in Campbell
| Household Size | Owner-occupied | Renter-occupied |
| Less than High School | 56 (56.0%) | 44 (44.0%) |
| High School Diploma | 189 (78.7%) | 51 (21.2%) |
| College/Associate Degree | 112 (68.3%) | 52 (31.7%) |
| Bachelor's Degree or higher | 27 (51.9%) | 25 (48.1%) |
Occupancy by Age of Householder in Campbell
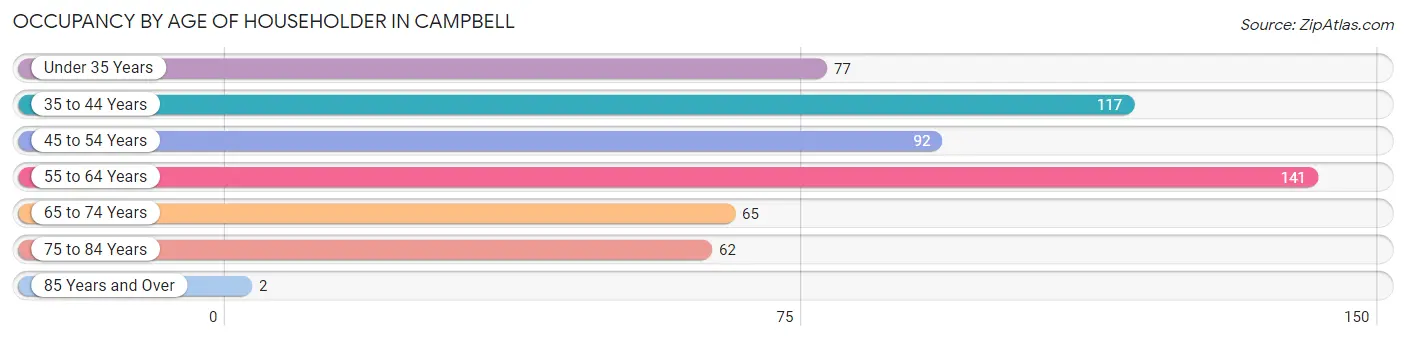
| Age Bracket | # Households | % Households |
| Under 35 Years | 77 | 13.9% |
| 35 to 44 Years | 117 | 21.0% |
| 45 to 54 Years | 92 | 16.6% |
| 55 to 64 Years | 141 | 25.4% |
| 65 to 74 Years | 65 | 11.7% |
| 75 to 84 Years | 62 | 11.2% |
| 85 Years and Over | 2 | 0.4% |
| Total | 556 | 100.0% |
Housing Finances in Campbell
Median Income by Occupancy in Campbell
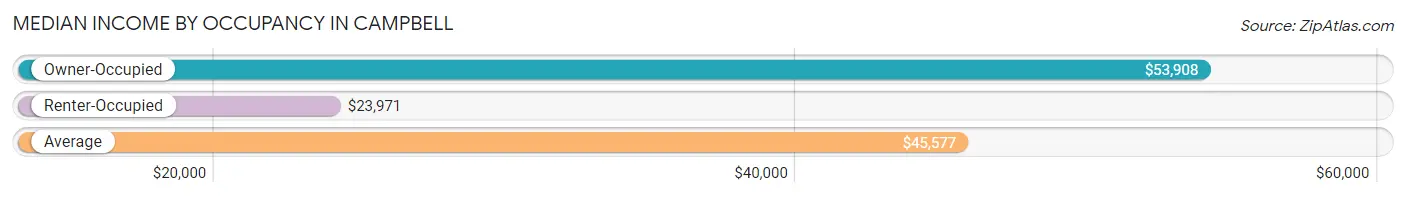
| Occupancy Type | # Households | Median Income |
| Owner-Occupied | 384 (69.1%) | $53,908 |
| Renter-Occupied | 172 (30.9%) | $23,971 |
| Average | 556 (100.0%) | $45,577 |
Occupancy by Householder Income Bracket in Campbell
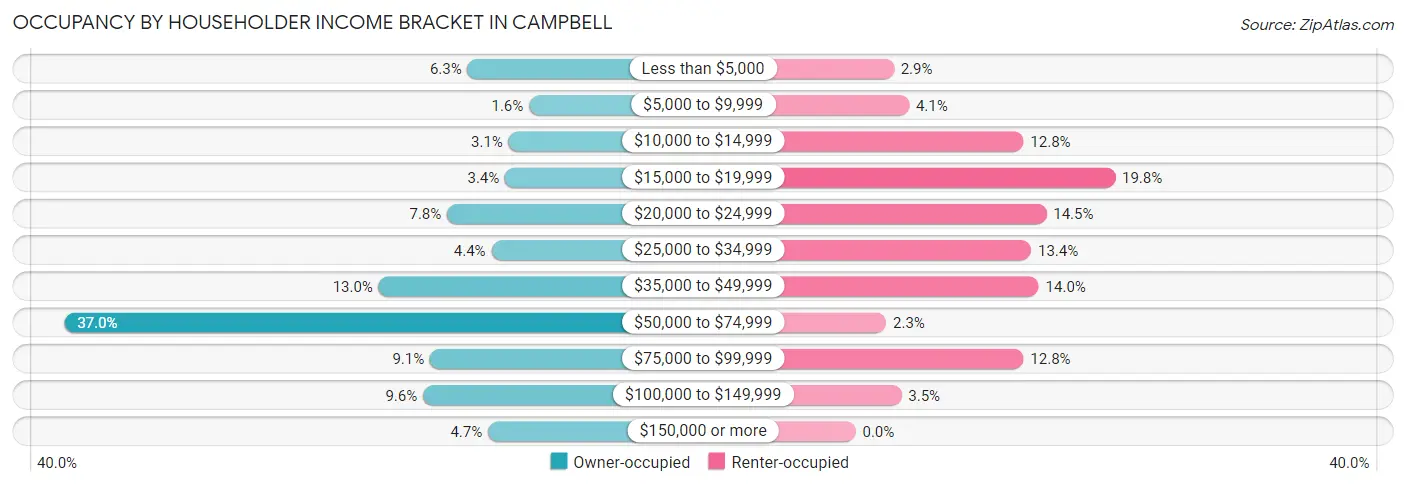
| Income Bracket | Owner-occupied | Renter-occupied |
| Less than $5,000 | 24 (6.2%) | 5 (2.9%) |
| $5,000 to $9,999 | 6 (1.6%) | 7 (4.1%) |
| $10,000 to $14,999 | 12 (3.1%) | 22 (12.8%) |
| $15,000 to $19,999 | 13 (3.4%) | 34 (19.8%) |
| $20,000 to $24,999 | 30 (7.8%) | 25 (14.5%) |
| $25,000 to $34,999 | 17 (4.4%) | 23 (13.4%) |
| $35,000 to $49,999 | 50 (13.0%) | 24 (14.0%) |
| $50,000 to $74,999 | 142 (37.0%) | 4 (2.3%) |
| $75,000 to $99,999 | 35 (9.1%) | 22 (12.8%) |
| $100,000 to $149,999 | 37 (9.6%) | 6 (3.5%) |
| $150,000 or more | 18 (4.7%) | 0 (0.0%) |
| Total | 384 (100.0%) | 172 (100.0%) |
Monthly Housing Cost Tiers in Campbell
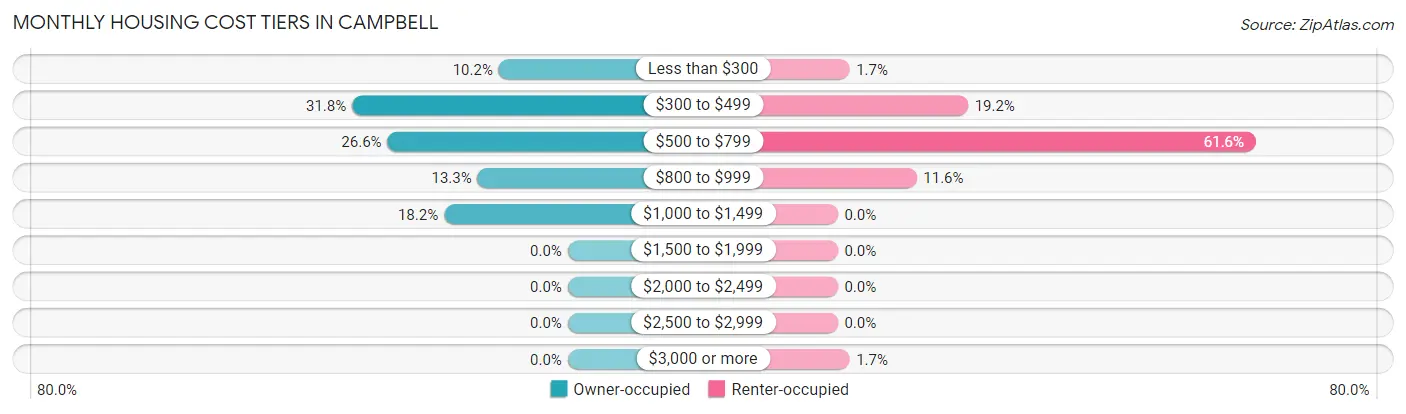
| Monthly Cost | Owner-occupied | Renter-occupied |
| Less than $300 | 39 (10.2%) | 3 (1.7%) |
| $300 to $499 | 122 (31.8%) | 33 (19.2%) |
| $500 to $799 | 102 (26.6%) | 106 (61.6%) |
| $800 to $999 | 51 (13.3%) | 20 (11.6%) |
| $1,000 to $1,499 | 70 (18.2%) | 0 (0.0%) |
| $1,500 to $1,999 | 0 (0.0%) | 0 (0.0%) |
| $2,000 to $2,499 | 0 (0.0%) | 0 (0.0%) |
| $2,500 to $2,999 | 0 (0.0%) | 0 (0.0%) |
| $3,000 or more | 0 (0.0%) | 3 (1.7%) |
| Total | 384 (100.0%) | 172 (100.0%) |
Physical Housing Characteristics in Campbell
Housing Structures in Campbell
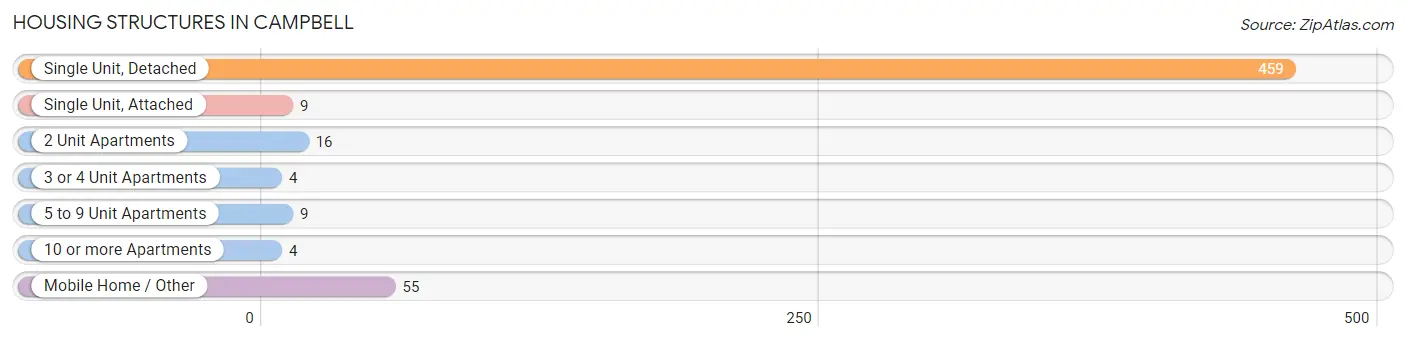
| Structure Type | # Housing Units | % Housing Units |
| Single Unit, Detached | 459 | 82.6% |
| Single Unit, Attached | 9 | 1.6% |
| 2 Unit Apartments | 16 | 2.9% |
| 3 or 4 Unit Apartments | 4 | 0.7% |
| 5 to 9 Unit Apartments | 9 | 1.6% |
| 10 or more Apartments | 4 | 0.7% |
| Mobile Home / Other | 55 | 9.9% |
| Total | 556 | 100.0% |
Housing Structures by Occupancy in Campbell
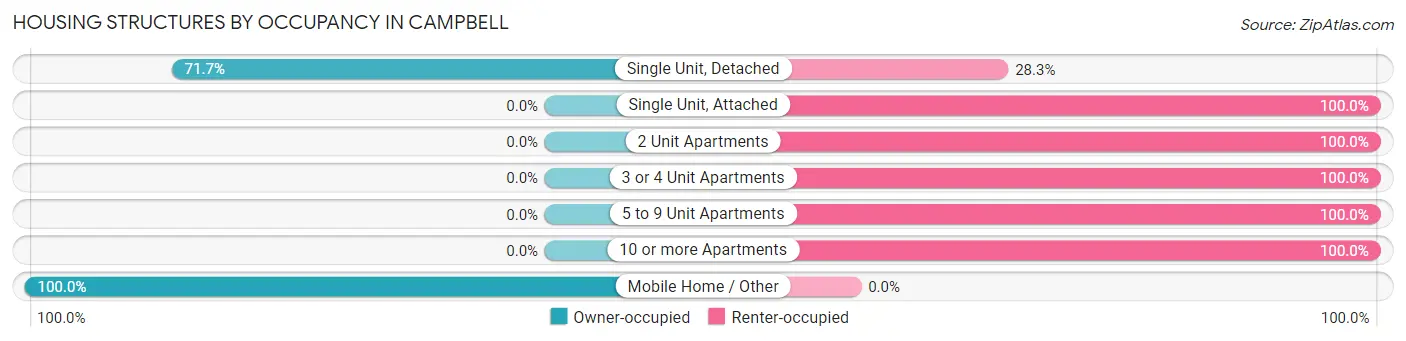
| Structure Type | Owner-occupied | Renter-occupied |
| Single Unit, Detached | 329 (71.7%) | 130 (28.3%) |
| Single Unit, Attached | 0 (0.0%) | 9 (100.0%) |
| 2 Unit Apartments | 0 (0.0%) | 16 (100.0%) |
| 3 or 4 Unit Apartments | 0 (0.0%) | 4 (100.0%) |
| 5 to 9 Unit Apartments | 0 (0.0%) | 9 (100.0%) |
| 10 or more Apartments | 0 (0.0%) | 4 (100.0%) |
| Mobile Home / Other | 55 (100.0%) | 0 (0.0%) |
| Total | 384 (69.1%) | 172 (30.9%) |
Housing Structures by Number of Rooms in Campbell
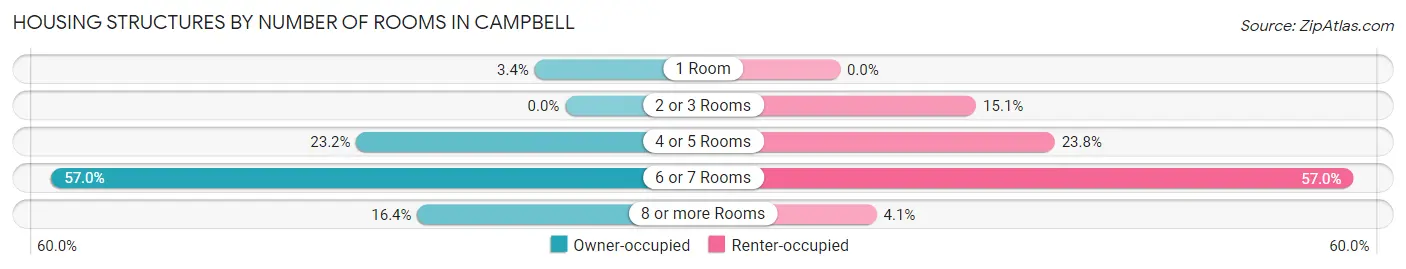
| Number of Rooms | Owner-occupied | Renter-occupied |
| 1 Room | 13 (3.4%) | 0 (0.0%) |
| 2 or 3 Rooms | 0 (0.0%) | 26 (15.1%) |
| 4 or 5 Rooms | 89 (23.2%) | 41 (23.8%) |
| 6 or 7 Rooms | 219 (57.0%) | 98 (57.0%) |
| 8 or more Rooms | 63 (16.4%) | 7 (4.1%) |
| Total | 384 (100.0%) | 172 (100.0%) |
Housing Structure by Heating Type in Campbell
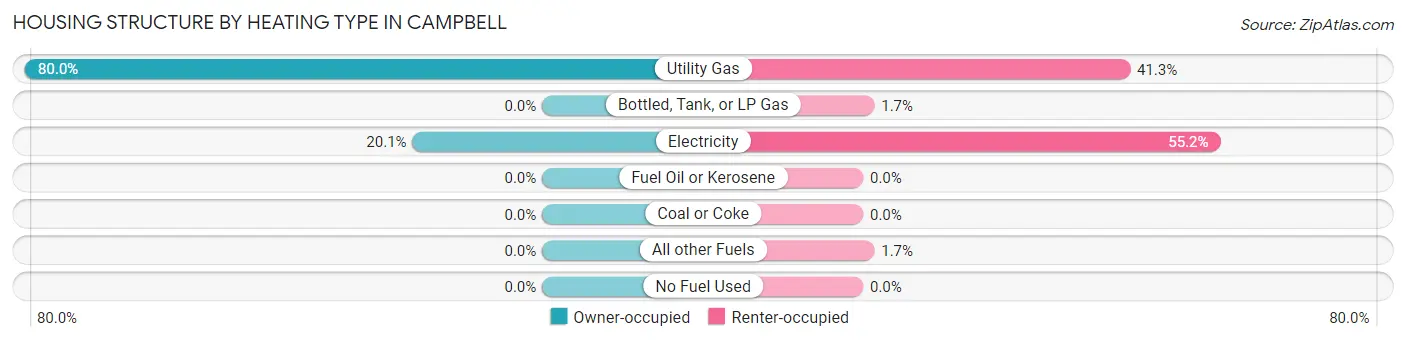
| Heating Type | Owner-occupied | Renter-occupied |
| Utility Gas | 307 (79.9%) | 71 (41.3%) |
| Bottled, Tank, or LP Gas | 0 (0.0%) | 3 (1.7%) |
| Electricity | 77 (20.1%) | 95 (55.2%) |
| Fuel Oil or Kerosene | 0 (0.0%) | 0 (0.0%) |
| Coal or Coke | 0 (0.0%) | 0 (0.0%) |
| All other Fuels | 0 (0.0%) | 3 (1.7%) |
| No Fuel Used | 0 (0.0%) | 0 (0.0%) |
| Total | 384 (100.0%) | 172 (100.0%) |
Household Vehicle Usage in Campbell
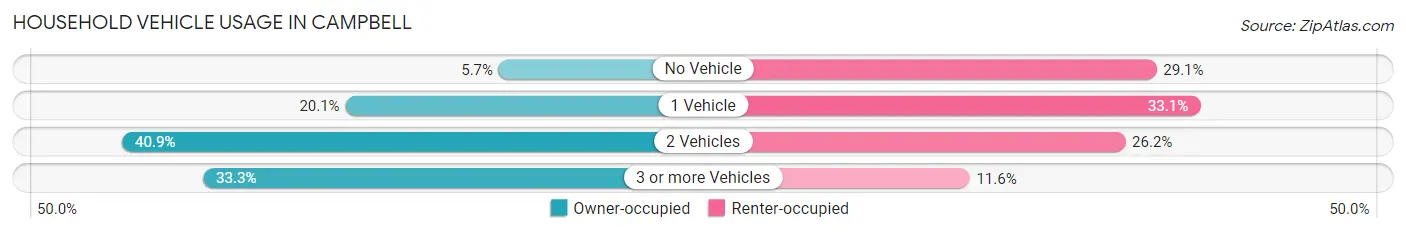
| Vehicles per Household | Owner-occupied | Renter-occupied |
| No Vehicle | 22 (5.7%) | 50 (29.1%) |
| 1 Vehicle | 77 (20.1%) | 57 (33.1%) |
| 2 Vehicles | 157 (40.9%) | 45 (26.2%) |
| 3 or more Vehicles | 128 (33.3%) | 20 (11.6%) |
| Total | 384 (100.0%) | 172 (100.0%) |
Real Estate & Mortgages in Campbell
Real Estate and Mortgage Overview in Campbell
| Characteristic | Without Mortgage | With Mortgage |
| Housing Units | 185 | 199 |
| Median Property Value | $33,200 | $73,100 |
| Median Household Income | $52,518 | $14 |
| Monthly Housing Costs | $365 | $0 |
| Real Estate Taxes | $286 | $5 |
Property Value by Mortgage Status in Campbell
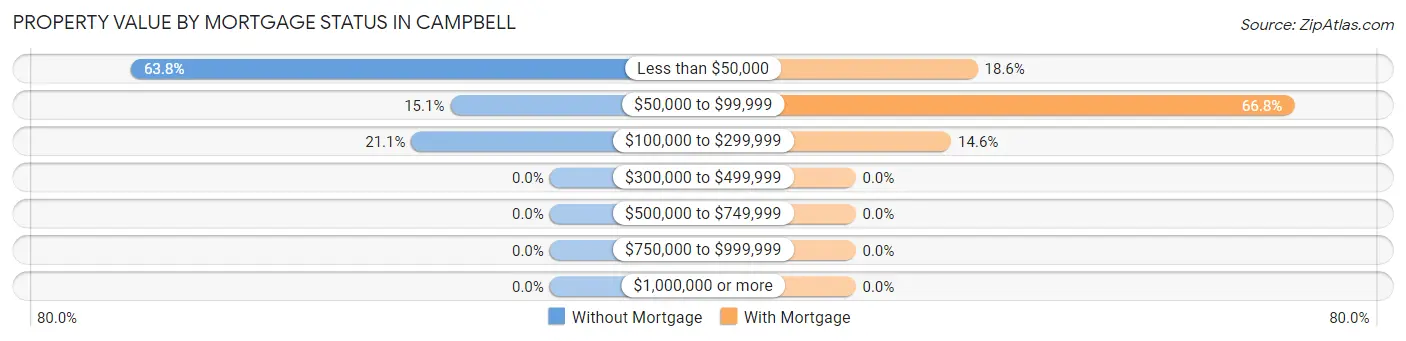
| Property Value | Without Mortgage | With Mortgage |
| Less than $50,000 | 118 (63.8%) | 37 (18.6%) |
| $50,000 to $99,999 | 28 (15.1%) | 133 (66.8%) |
| $100,000 to $299,999 | 39 (21.1%) | 29 (14.6%) |
| $300,000 to $499,999 | 0 (0.0%) | 0 (0.0%) |
| $500,000 to $749,999 | 0 (0.0%) | 0 (0.0%) |
| $750,000 to $999,999 | 0 (0.0%) | 0 (0.0%) |
| $1,000,000 or more | 0 (0.0%) | 0 (0.0%) |
| Total | 185 (100.0%) | 199 (100.0%) |
Household Income by Mortgage Status in Campbell
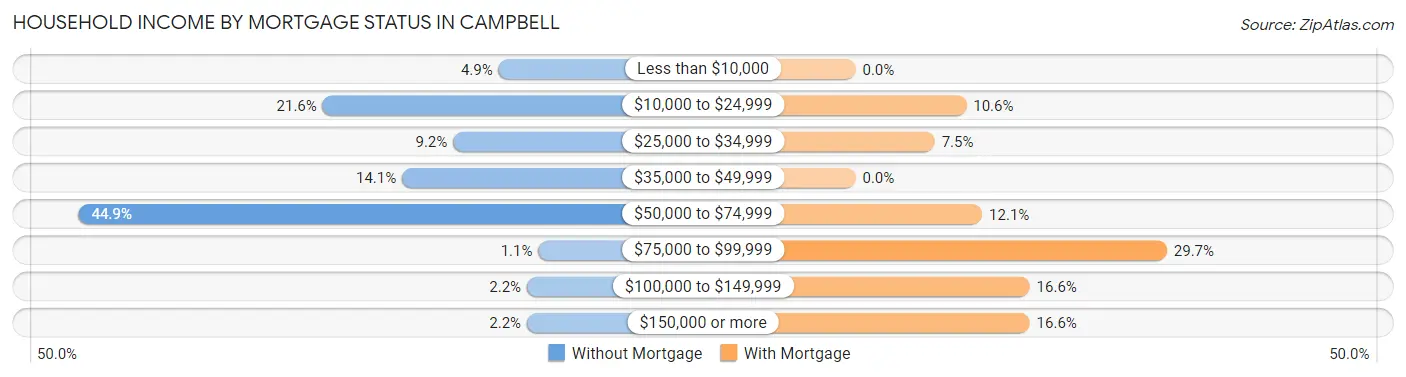
| Household Income | Without Mortgage | With Mortgage |
| Less than $10,000 | 9 (4.9%) | 0 (0.0%) |
| $10,000 to $24,999 | 40 (21.6%) | 21 (10.5%) |
| $25,000 to $34,999 | 17 (9.2%) | 15 (7.5%) |
| $35,000 to $49,999 | 26 (14.1%) | 0 (0.0%) |
| $50,000 to $74,999 | 83 (44.9%) | 24 (12.1%) |
| $75,000 to $99,999 | 2 (1.1%) | 59 (29.6%) |
| $100,000 to $149,999 | 4 (2.2%) | 33 (16.6%) |
| $150,000 or more | 4 (2.2%) | 33 (16.6%) |
| Total | 185 (100.0%) | 199 (100.0%) |
Property Value to Household Income Ratio in Campbell
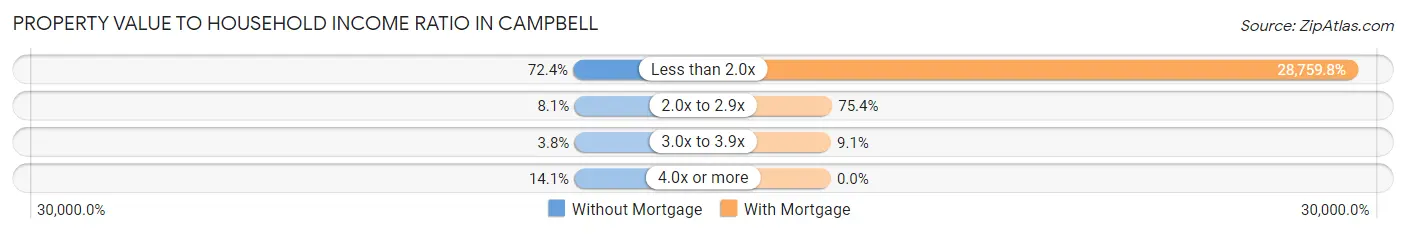
| Value-to-Income Ratio | Without Mortgage | With Mortgage |
| Less than 2.0x | 134 (72.4%) | 57,232 (28,759.8%) |
| 2.0x to 2.9x | 15 (8.1%) | 150 (75.4%) |
| 3.0x to 3.9x | 7 (3.8%) | 18 (9.0%) |
| 4.0x or more | 26 (14.1%) | 0 (0.0%) |
| Total | 185 (100.0%) | 199 (100.0%) |
Real Estate Taxes by Mortgage Status in Campbell
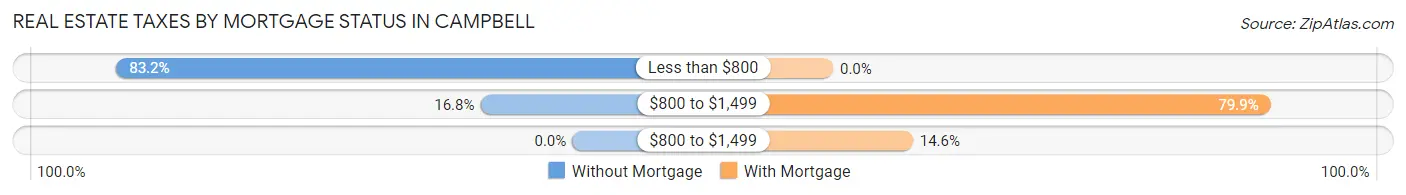
| Property Taxes | Without Mortgage | With Mortgage |
| Less than $800 | 154 (83.2%) | 0 (0.0%) |
| $800 to $1,499 | 31 (16.8%) | 159 (79.9%) |
| $800 to $1,499 | 0 (0.0%) | 29 (14.6%) |
| Total | 185 (100.0%) | 199 (100.0%) |
Health & Disability in Campbell
Health Insurance Coverage by Age in Campbell
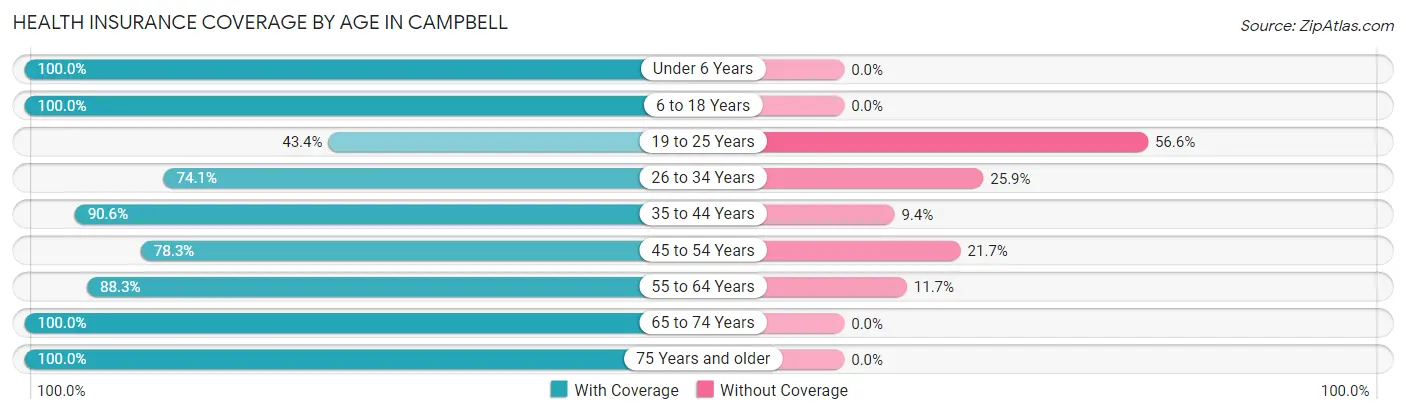
| Age Bracket | With Coverage | Without Coverage |
| Under 6 Years | 181 (100.0%) | 0 (0.0%) |
| 6 to 18 Years | 321 (100.0%) | 0 (0.0%) |
| 19 to 25 Years | 72 (43.4%) | 94 (56.6%) |
| 26 to 34 Years | 80 (74.1%) | 28 (25.9%) |
| 35 to 44 Years | 155 (90.6%) | 16 (9.4%) |
| 45 to 54 Years | 166 (78.3%) | 46 (21.7%) |
| 55 to 64 Years | 212 (88.3%) | 28 (11.7%) |
| 65 to 74 Years | 90 (100.0%) | 0 (0.0%) |
| 75 Years and older | 85 (100.0%) | 0 (0.0%) |
| Total | 1,362 (86.5%) | 212 (13.5%) |
Health Insurance Coverage by Citizenship Status in Campbell
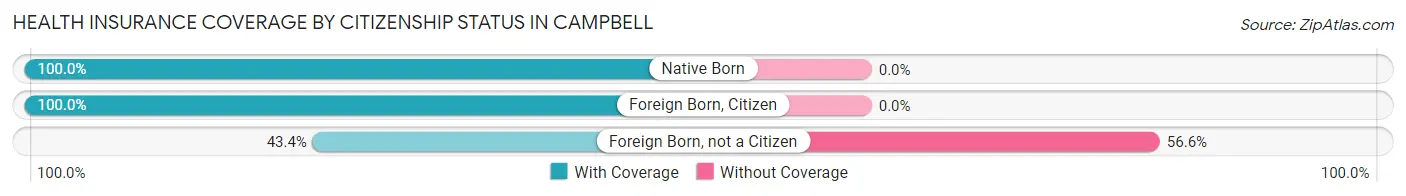
| Citizenship Status | With Coverage | Without Coverage |
| Native Born | 181 (100.0%) | 0 (0.0%) |
| Foreign Born, Citizen | 321 (100.0%) | 0 (0.0%) |
| Foreign Born, not a Citizen | 72 (43.4%) | 94 (56.6%) |
Health Insurance Coverage by Household Income in Campbell
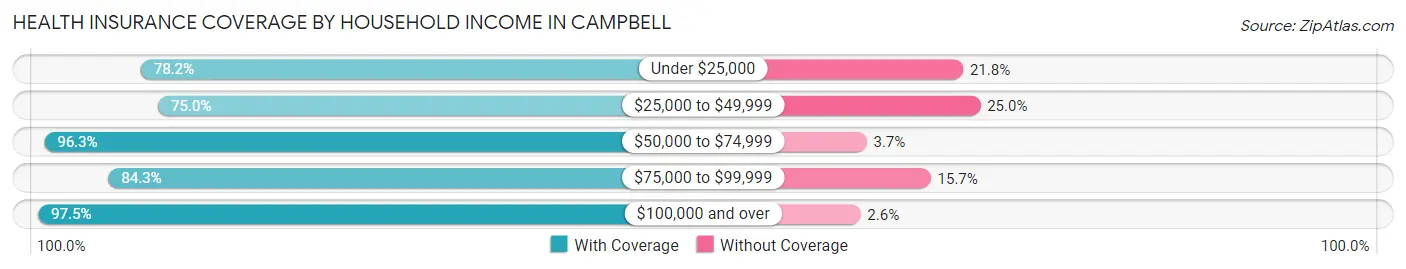
| Household Income | With Coverage | Without Coverage |
| Under $25,000 | 345 (78.2%) | 96 (21.8%) |
| $25,000 to $49,999 | 168 (75.0%) | 56 (25.0%) |
| $50,000 to $74,999 | 416 (96.3%) | 16 (3.7%) |
| $75,000 to $99,999 | 204 (84.3%) | 38 (15.7%) |
| $100,000 and over | 229 (97.5%) | 6 (2.5%) |
Public vs Private Health Insurance Coverage by Age in Campbell
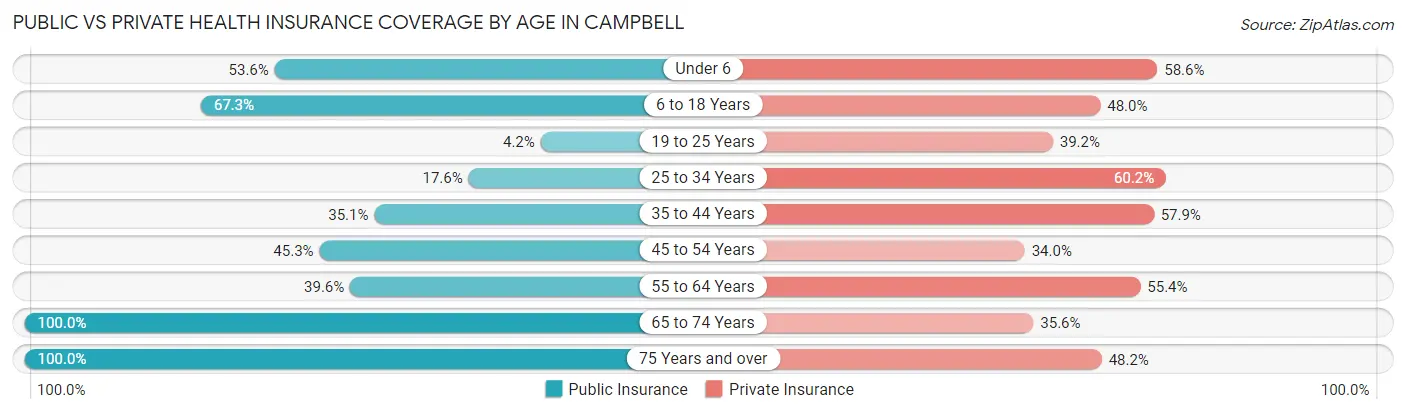
| Age Bracket | Public Insurance | Private Insurance |
| Under 6 | 97 (53.6%) | 106 (58.6%) |
| 6 to 18 Years | 216 (67.3%) | 154 (48.0%) |
| 19 to 25 Years | 7 (4.2%) | 65 (39.2%) |
| 25 to 34 Years | 19 (17.6%) | 65 (60.2%) |
| 35 to 44 Years | 60 (35.1%) | 99 (57.9%) |
| 45 to 54 Years | 96 (45.3%) | 72 (34.0%) |
| 55 to 64 Years | 95 (39.6%) | 133 (55.4%) |
| 65 to 74 Years | 90 (100.0%) | 32 (35.6%) |
| 75 Years and over | 85 (100.0%) | 41 (48.2%) |
| Total | 765 (48.6%) | 767 (48.7%) |
Disability Status by Sex by Age in Campbell
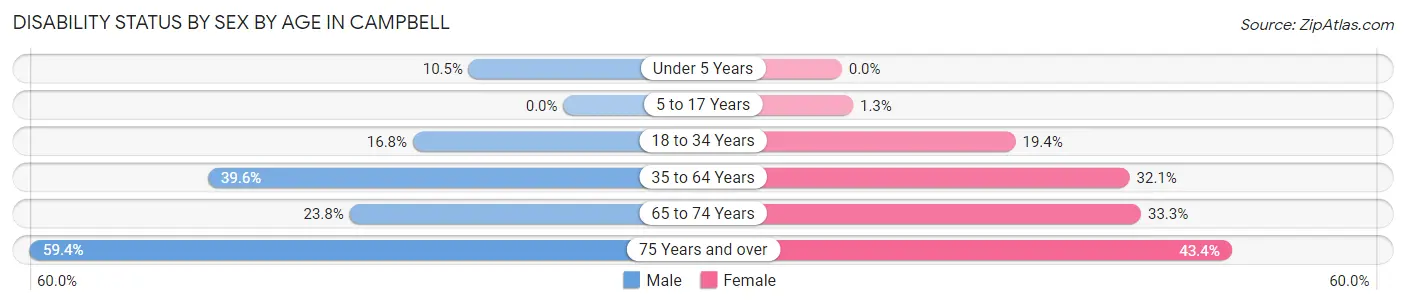
| Age Bracket | Male | Female |
| Under 5 Years | 14 (10.5%) | 0 (0.0%) |
| 5 to 17 Years | 0 (0.0%) | 2 (1.3%) |
| 18 to 34 Years | 30 (16.8%) | 24 (19.4%) |
| 35 to 64 Years | 112 (39.6%) | 109 (32.1%) |
| 65 to 74 Years | 5 (23.8%) | 23 (33.3%) |
| 75 Years and over | 19 (59.4%) | 23 (43.4%) |
Disability Class by Sex by Age in Campbell
Disability Class: Hearing Difficulty
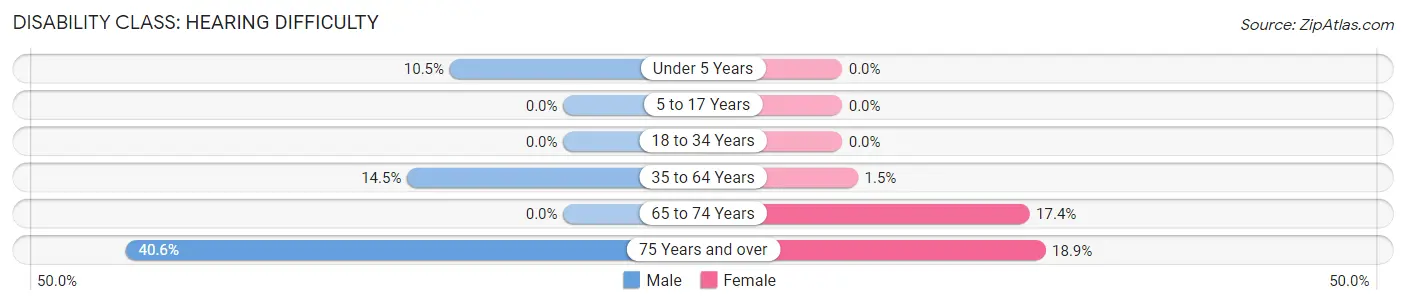
| Age Bracket | Male | Female |
| Under 5 Years | 14 (10.5%) | 0 (0.0%) |
| 5 to 17 Years | 0 (0.0%) | 0 (0.0%) |
| 18 to 34 Years | 0 (0.0%) | 0 (0.0%) |
| 35 to 64 Years | 41 (14.5%) | 5 (1.5%) |
| 65 to 74 Years | 0 (0.0%) | 12 (17.4%) |
| 75 Years and over | 13 (40.6%) | 10 (18.9%) |
Disability Class: Vision Difficulty
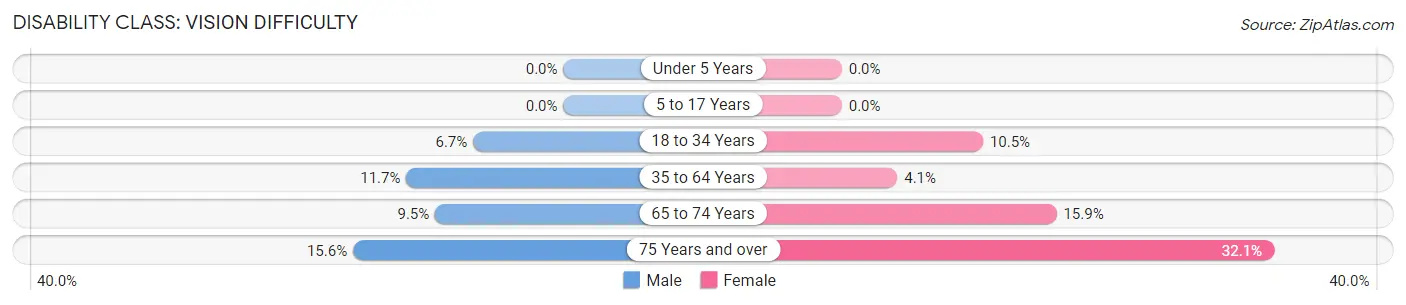
| Age Bracket | Male | Female |
| Under 5 Years | 0 (0.0%) | 0 (0.0%) |
| 5 to 17 Years | 0 (0.0%) | 0 (0.0%) |
| 18 to 34 Years | 12 (6.7%) | 13 (10.5%) |
| 35 to 64 Years | 33 (11.7%) | 14 (4.1%) |
| 65 to 74 Years | 2 (9.5%) | 11 (15.9%) |
| 75 Years and over | 5 (15.6%) | 17 (32.1%) |
Disability Class: Cognitive Difficulty
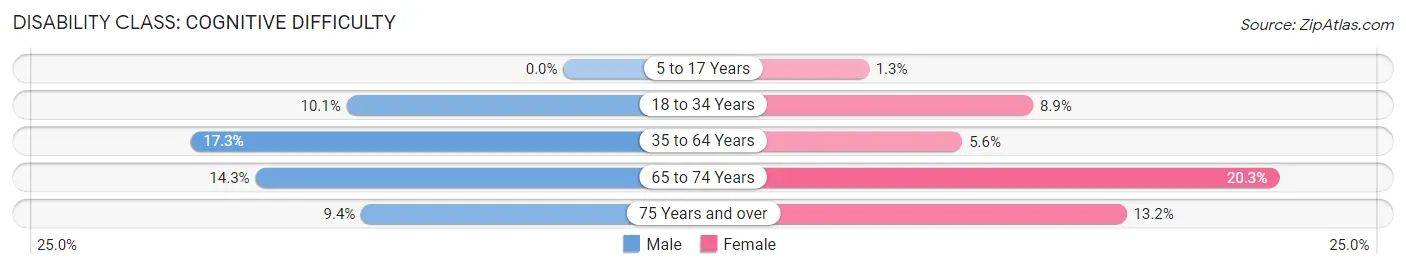
| Age Bracket | Male | Female |
| 5 to 17 Years | 0 (0.0%) | 2 (1.3%) |
| 18 to 34 Years | 18 (10.1%) | 11 (8.9%) |
| 35 to 64 Years | 49 (17.3%) | 19 (5.6%) |
| 65 to 74 Years | 3 (14.3%) | 14 (20.3%) |
| 75 Years and over | 3 (9.4%) | 7 (13.2%) |
Disability Class: Ambulatory Difficulty
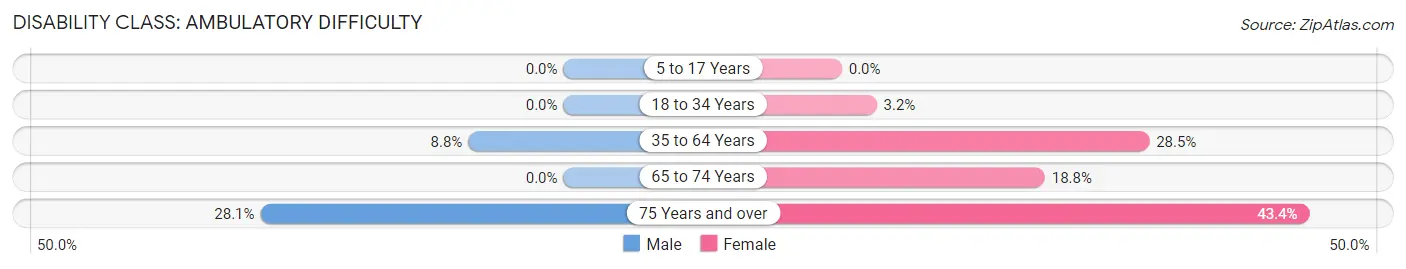
| Age Bracket | Male | Female |
| 5 to 17 Years | 0 (0.0%) | 0 (0.0%) |
| 18 to 34 Years | 0 (0.0%) | 4 (3.2%) |
| 35 to 64 Years | 25 (8.8%) | 97 (28.5%) |
| 65 to 74 Years | 0 (0.0%) | 13 (18.8%) |
| 75 Years and over | 9 (28.1%) | 23 (43.4%) |
Disability Class: Self-Care Difficulty
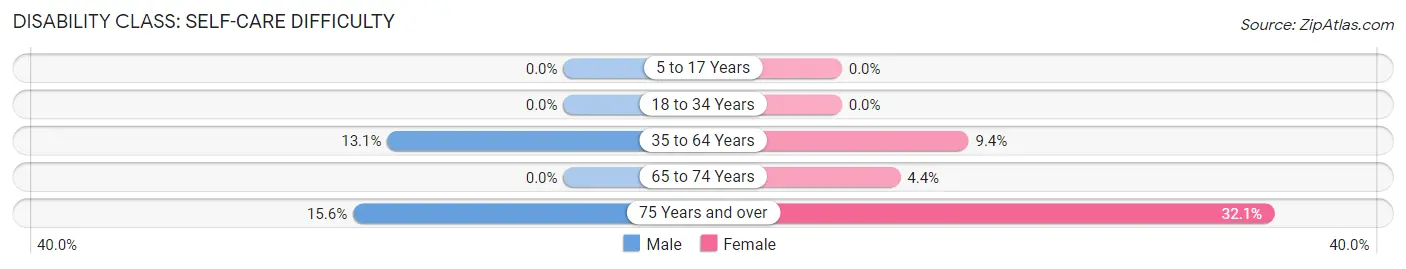
| Age Bracket | Male | Female |
| 5 to 17 Years | 0 (0.0%) | 0 (0.0%) |
| 18 to 34 Years | 0 (0.0%) | 0 (0.0%) |
| 35 to 64 Years | 37 (13.1%) | 32 (9.4%) |
| 65 to 74 Years | 0 (0.0%) | 3 (4.3%) |
| 75 Years and over | 5 (15.6%) | 17 (32.1%) |
Technology Access in Campbell
Computing Device Access in Campbell
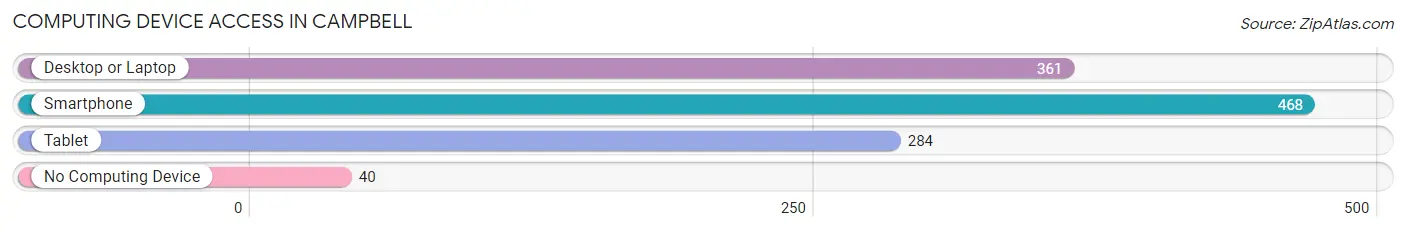
| Device Type | # Households | % Households |
| Desktop or Laptop | 361 | 64.9% |
| Smartphone | 468 | 84.2% |
| Tablet | 284 | 51.1% |
| No Computing Device | 40 | 7.2% |
| Total | 556 | 100.0% |
Internet Access in Campbell
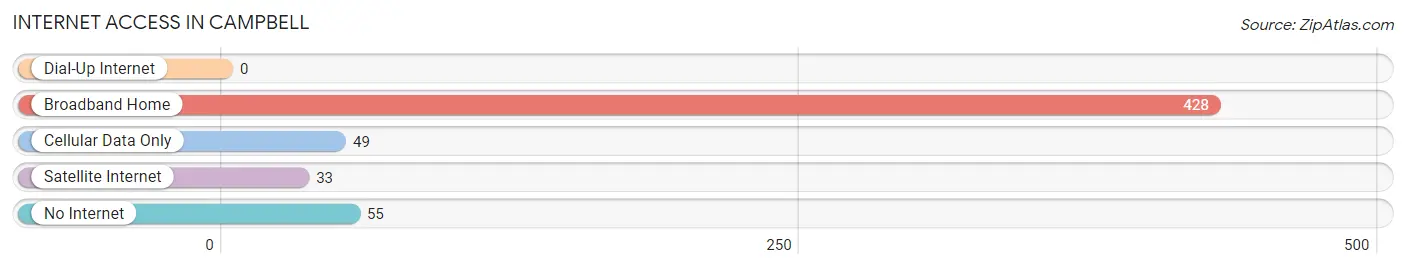
| Internet Type | # Households | % Households |
| Dial-Up Internet | 0 | 0.0% |
| Broadband Home | 428 | 77.0% |
| Cellular Data Only | 49 | 8.8% |
| Satellite Internet | 33 | 5.9% |
| No Internet | 55 | 9.9% |
| Total | 556 | 100.0% |
Campbell Summary
Campbell, Missouri is a small town located in Dunklin County in the southeastern corner of the state. It is situated on the banks of the St. Francis River, and is surrounded by the Mark Twain National Forest. The town was founded in 1882 and has a population of approximately 1,000 people.
History
Campbell was founded in 1882 by a group of settlers from Kentucky and Tennessee. The town was named after a local landowner, William Campbell, who donated the land for the town. The first post office was established in 1883, and the town was incorporated in 1887.
The town grew slowly but steadily over the years, and by the early 1900s, it had become a thriving agricultural community. Cotton was the main crop grown in the area, and the town was home to several cotton gins and other businesses related to the cotton industry.
In the 1920s, the town began to experience a decline in population as many of the younger residents moved away to find work in larger cities. This trend continued until the 1950s, when the town began to experience a resurgence in population growth. This was due in part to the construction of a new highway, which connected Campbell to the larger cities of St. Louis and Memphis.
Geography
Campbell is located in the southeastern corner of Missouri, in Dunklin County. It is situated on the banks of the St. Francis River, and is surrounded by the Mark Twain National Forest. The town is located approximately 30 miles from the Arkansas border, and is approximately 100 miles from St. Louis.
The town is situated on a flat plain, with an elevation of approximately 300 feet above sea level. The climate in the area is humid subtropical, with hot, humid summers and mild winters.
Economy
The economy of Campbell is largely based on agriculture. Cotton is the main crop grown in the area, and the town is home to several cotton gins and other businesses related to the cotton industry. Other crops grown in the area include corn, soybeans, and wheat.
The town is also home to several small businesses, including a grocery store, a hardware store, and a few restaurants. There is also a small manufacturing plant in the town, which produces plastic products.
Demographics
As of the 2010 census, the population of Campbell was 1,000 people. The racial makeup of the town was 97.2% White, 0.7% African American, 0.3% Native American, 0.2% Asian, and 1.6% from other races. The median household income in the town was $30,000, and the median age was 40 years.
Conclusion
Campbell, Missouri is a small town located in Dunklin County in the southeastern corner of the state. It was founded in 1882 and has a population of approximately 1,000 people. The economy of the town is largely based on agriculture, with cotton being the main crop grown in the area. The town is also home to several small businesses, including a grocery store, a hardware store, and a few restaurants. The racial makeup of the town is predominantly White, with a small percentage of African American, Native American, and Asian residents.
Common Questions
What is Per Capita Income in Campbell?
Per Capita income in Campbell is $17,278.
What is the Median Family Income in Campbell?
Median Family Income in Campbell is $53,370.
What is the Median Household income in Campbell?
Median Household Income in Campbell is $45,577.
What is Income or Wage Gap in Campbell?
Income or Wage Gap in Campbell is 40.2%.
Women in Campbell earn 59.8 cents for every dollar earned by a man.
What is Family Income Deficit in Campbell?
Family Income Deficit in Campbell is $9,792.
Families that are below poverty line in Campbell earn $9,792 less on average than the poverty threshold level.
What is Inequality or Gini Index in Campbell?
Inequality or Gini Index in Campbell is 0.40.
What is the Total Population of Campbell?
Total Population of Campbell is 1,639.
What is the Total Male Population of Campbell?
Total Male Population of Campbell is 845.
What is the Total Female Population of Campbell?
Total Female Population of Campbell is 794.
What is the Ratio of Males per 100 Females in Campbell?
There are 106.42 Males per 100 Females in Campbell.
What is the Ratio of Females per 100 Males in Campbell?
There are 93.96 Females per 100 Males in Campbell.
What is the Median Population Age in Campbell?
Median Population Age in Campbell is 37.0 Years.
What is the Average Family Size in Campbell
Average Family Size in Campbell is 3.5 People.
What is the Average Household Size in Campbell
Average Household Size in Campbell is 2.8 People.
How Large is the Labor Force in Campbell?
There are 625 People in the Labor Forcein in Campbell.
What is the Percentage of People in the Labor Force in Campbell?
50.4% of People are in the Labor Force in Campbell.
What is the Unemployment Rate in Campbell?
Unemployment Rate in Campbell is 8.0%.