Richland, MO Map & Demographics
Richland Map
Richland Overview
$31,824
PER CAPITA INCOME
$44,071
AVG FAMILY INCOME
$42,561
AVG HOUSEHOLD INCOME
41.1%
WAGE / INCOME GAP [ % ]
58.9¢/ $1
WAGE / INCOME GAP [ $ ]
$12,655
FAMILY INCOME DEFICIT
0.67
INEQUALITY / GINI INDEX
2,307
TOTAL POPULATION
1,214
MALE POPULATION
1,093
FEMALE POPULATION
111.07
MALES / 100 FEMALES
90.03
FEMALES / 100 MALES
32.6
MEDIAN AGE
3.6
AVG FAMILY SIZE
2.8
AVG HOUSEHOLD SIZE
921
LABOR FORCE [ PEOPLE ]
57.0%
PERCENT IN LABOR FORCE
6.1%
UNEMPLOYMENT RATE
Richland Zip Codes
Richland Area Codes
Income in Richland
Income Overview in Richland
Per Capita Income in Richland is $31,824, while median incomes of families and households are $44,071 and $42,561 respectively.
| Characteristic | Number | Measure |
| Per Capita Income | 2,307 | $31,824 |
| Median Family Income | 469 | $44,071 |
| Mean Family Income | 469 | $55,151 |
| Median Household Income | 824 | $42,561 |
| Mean Household Income | 824 | $81,732 |
| Income Deficit | 469 | $12,655 |
| Wage / Income Gap (%) | 2,307 | 41.10% |
| Wage / Income Gap ($) | 2,307 | 58.90¢ per $1 |
| Gini / Inequality Index | 2,307 | 0.67 |
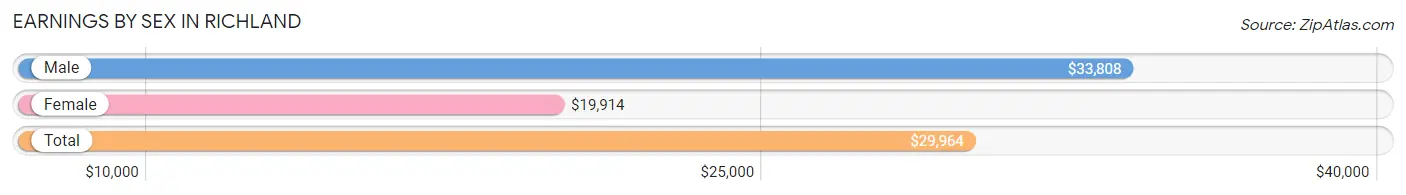
Earnings by Sex in Richland
Average Earnings in Richland are $29,964, $33,808 for men and $19,914 for women, a difference of 41.1%.
| Sex | Number | Average Earnings |
| Male | 551 (58.8%) | $33,808 |
| Female | 386 (41.2%) | $19,914 |
| Total | 937 (100.0%) | $29,964 |
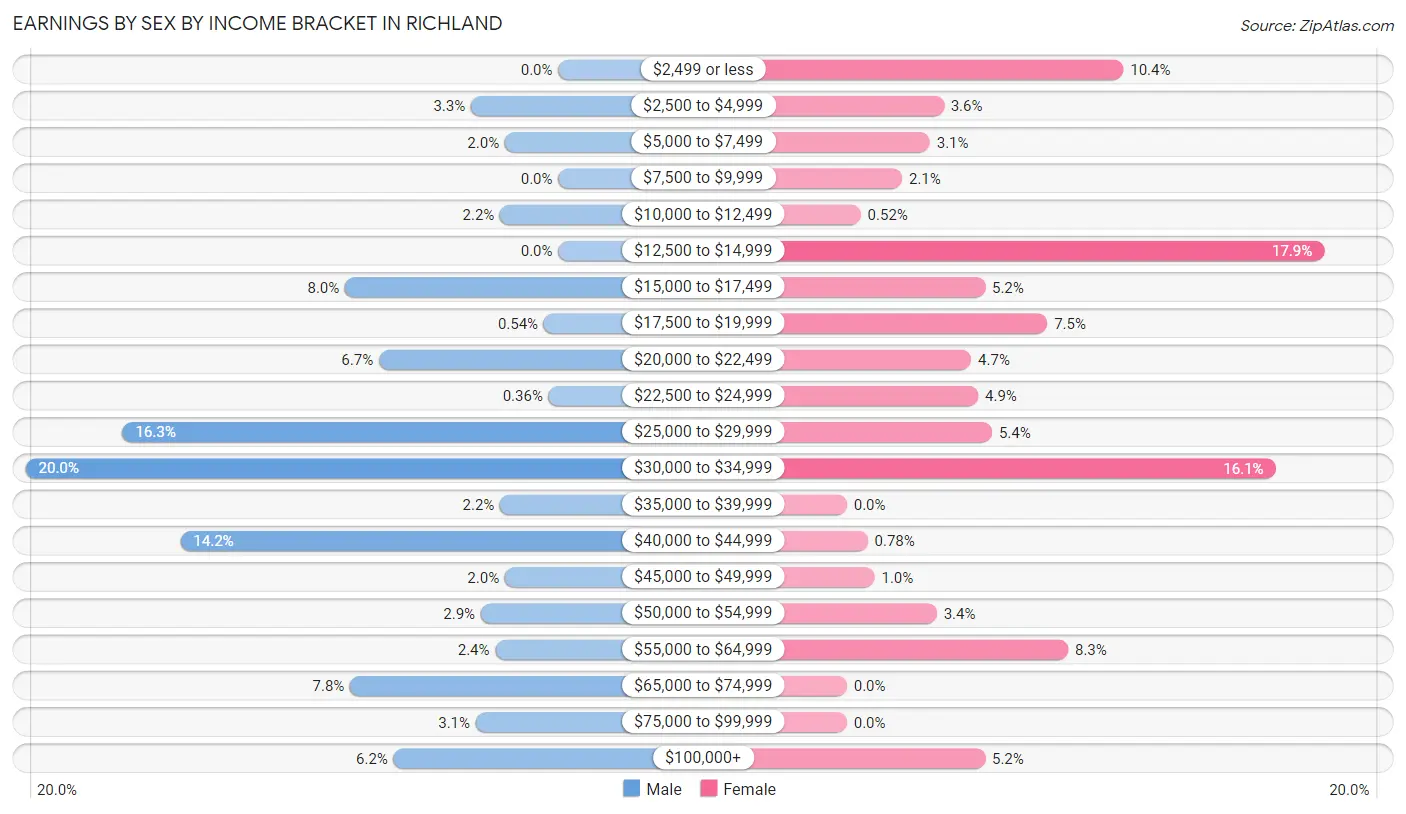
Earnings by Sex by Income Bracket in Richland
The most common earnings brackets in Richland are $30,000 to $34,999 for men (110 | 20.0%) and $12,500 to $14,999 for women (69 | 17.9%).
| Income | Male | Female |
| $2,499 or less | 0 (0.0%) | 40 (10.4%) |
| $2,500 to $4,999 | 18 (3.3%) | 14 (3.6%) |
| $5,000 to $7,499 | 11 (2.0%) | 12 (3.1%) |
| $7,500 to $9,999 | 0 (0.0%) | 8 (2.1%) |
| $10,000 to $12,499 | 12 (2.2%) | 2 (0.5%) |
| $12,500 to $14,999 | 0 (0.0%) | 69 (17.9%) |
| $15,000 to $17,499 | 44 (8.0%) | 20 (5.2%) |
| $17,500 to $19,999 | 3 (0.5%) | 29 (7.5%) |
| $20,000 to $22,499 | 37 (6.7%) | 18 (4.7%) |
| $22,500 to $24,999 | 2 (0.4%) | 19 (4.9%) |
| $25,000 to $29,999 | 90 (16.3%) | 21 (5.4%) |
| $30,000 to $34,999 | 110 (20.0%) | 62 (16.1%) |
| $35,000 to $39,999 | 12 (2.2%) | 0 (0.0%) |
| $40,000 to $44,999 | 78 (14.2%) | 3 (0.8%) |
| $45,000 to $49,999 | 11 (2.0%) | 4 (1.0%) |
| $50,000 to $54,999 | 16 (2.9%) | 13 (3.4%) |
| $55,000 to $64,999 | 13 (2.4%) | 32 (8.3%) |
| $65,000 to $74,999 | 43 (7.8%) | 0 (0.0%) |
| $75,000 to $99,999 | 17 (3.1%) | 0 (0.0%) |
| $100,000+ | 34 (6.2%) | 20 (5.2%) |
| Total | 551 (100.0%) | 386 (100.0%) |
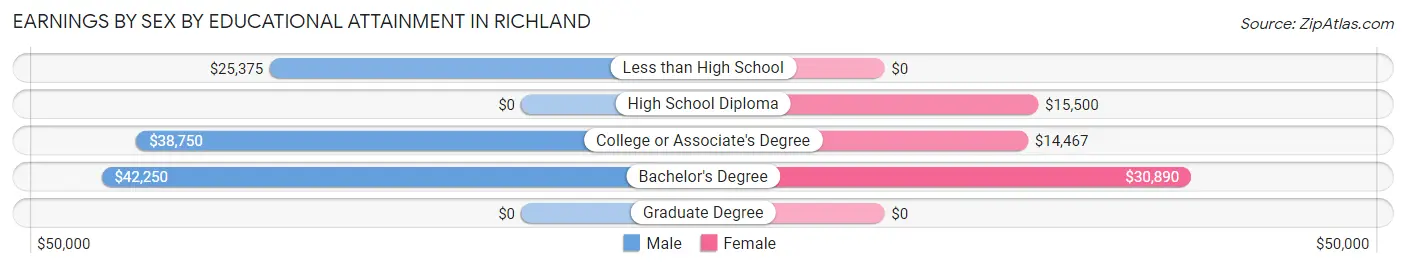
Earnings by Sex by Educational Attainment in Richland
Average earnings in Richland are $34,583 for men and $21,528 for women, a difference of 37.8%. Men with an educational attainment of bachelor's degree enjoy the highest average annual earnings of $42,250, while those with less than high school education earn the least with $25,375. Women with an educational attainment of bachelor's degree earn the most with the average annual earnings of $30,890, while those with college or associate's degree education have the smallest earnings of $14,467.
| Educational Attainment | Male Income | Female Income |
| Less than High School | $25,375 | $0 |
| High School Diploma | - | - |
| College or Associate's Degree | $38,750 | $14,467 |
| Bachelor's Degree | $42,250 | $30,890 |
| Graduate Degree | - | - |
| Total | $34,583 | $21,528 |
Family Income in Richland
Family Income Brackets in Richland
According to the Richland family income data, there are 148 families falling into the $35,000 to $49,999 income range, which is the most common income bracket and makes up 31.6% of all families.
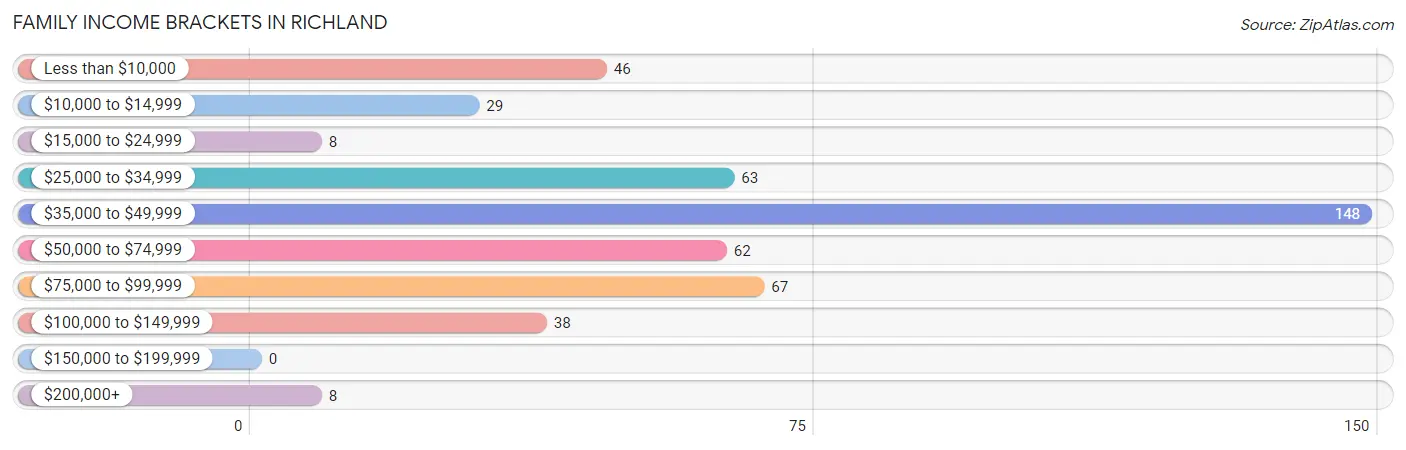
| Income Bracket | # Families | % Families |
| Less than $10,000 | 46 | 9.8% |
| $10,000 to $14,999 | 29 | 6.2% |
| $15,000 to $24,999 | 8 | 1.7% |
| $25,000 to $34,999 | 63 | 13.4% |
| $35,000 to $49,999 | 148 | 31.6% |
| $50,000 to $74,999 | 62 | 13.2% |
| $75,000 to $99,999 | 67 | 14.3% |
| $100,000 to $149,999 | 38 | 8.1% |
| $150,000 to $199,999 | 0 | 0.0% |
| $200,000+ | 8 | 1.7% |
Family Income by Famaliy Size in Richland
5-person families (107 | 22.8%) account for the highest median family income in Richland with $68,359 per family, while 3-person families (40 | 8.5%) have the highest median income of $21,875 per family member.
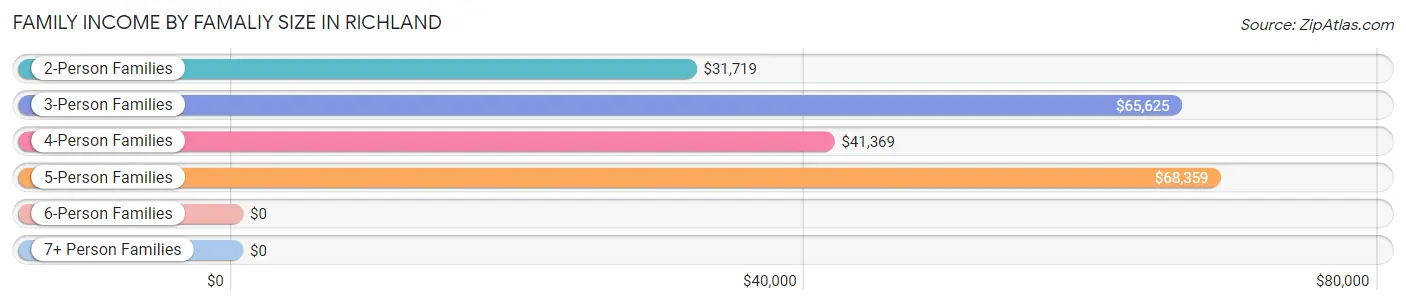
| Income Bracket | # Families | Median Income |
| 2-Person Families | 249 (53.1%) | $31,719 |
| 3-Person Families | 40 (8.5%) | $65,625 |
| 4-Person Families | 64 (13.7%) | $41,369 |
| 5-Person Families | 107 (22.8%) | $68,359 |
| 6-Person Families | 2 (0.4%) | $0 |
| 7+ Person Families | 7 (1.5%) | $0 |
| Total | 469 (100.0%) | $44,071 |
Family Income by Number of Earners in Richland
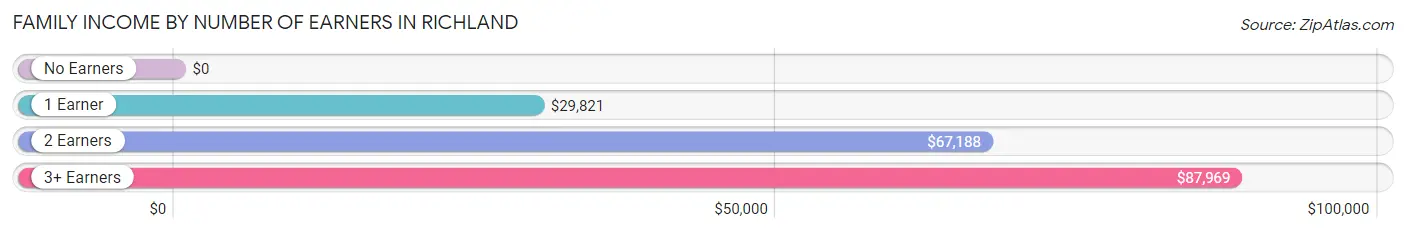
| Number of Earners | # Families | Median Income |
| No Earners | 127 (27.1%) | $0 |
| 1 Earner | 98 (20.9%) | $29,821 |
| 2 Earners | 227 (48.4%) | $67,188 |
| 3+ Earners | 17 (3.6%) | $87,969 |
| Total | 469 (100.0%) | $44,071 |
Household Income in Richland
Household Income Brackets in Richland
With 238 households falling in the category, the $35,000 to $49,999 income range is the most frequent in Richland, accounting for 28.9% of all households.
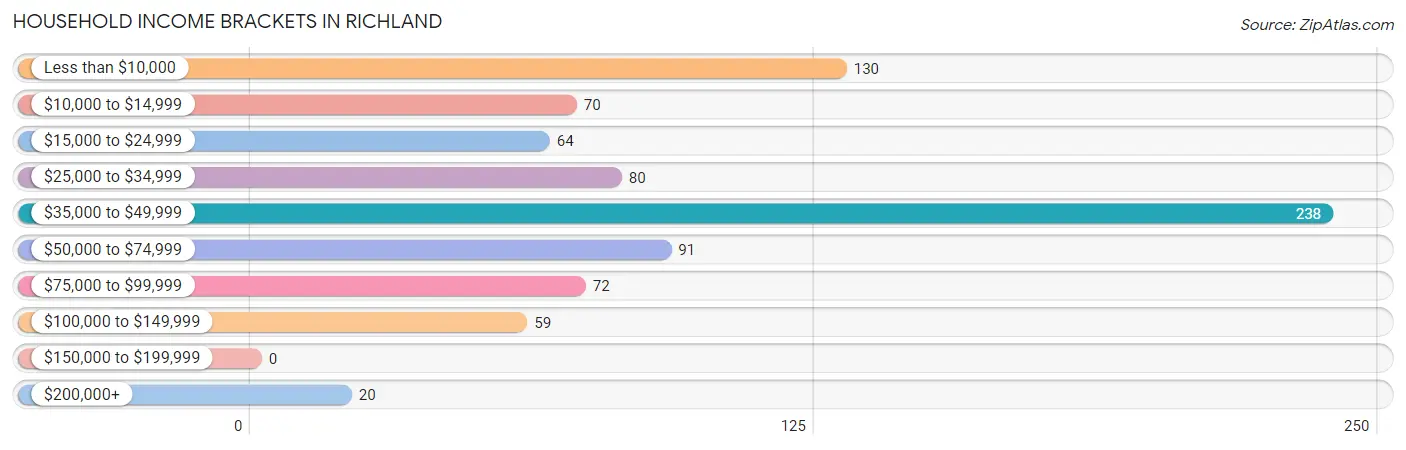
| Income Bracket | # Households | % Households |
| Less than $10,000 | 130 | 15.8% |
| $10,000 to $14,999 | 70 | 8.5% |
| $15,000 to $24,999 | 64 | 7.8% |
| $25,000 to $34,999 | 80 | 9.7% |
| $35,000 to $49,999 | 238 | 28.9% |
| $50,000 to $74,999 | 91 | 11.0% |
| $75,000 to $99,999 | 72 | 8.7% |
| $100,000 to $149,999 | 59 | 7.2% |
| $150,000 to $199,999 | 0 | 0.0% |
| $200,000+ | 20 | 2.4% |
Household Income by Householder Age in Richland
The median household income in Richland is $42,561, with the highest median household income of $45,295 found in the 25 to 44 years age bracket for the primary householder. A total of 317 households (38.5%) fall into this category. Meanwhile, the 45 to 64 years age bracket for the primary householder has the lowest median household income of $29,777, with 239 households (29.0%) in this group.
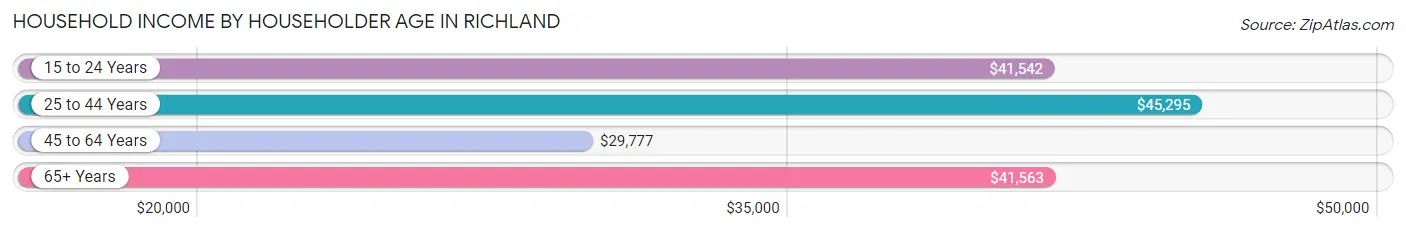
| Income Bracket | # Households | Median Income |
| 15 to 24 Years | 43 (5.2%) | $41,542 |
| 25 to 44 Years | 317 (38.5%) | $45,295 |
| 45 to 64 Years | 239 (29.0%) | $29,777 |
| 65+ Years | 225 (27.3%) | $41,563 |
| Total | 824 (100.0%) | $42,561 |
Poverty in Richland
Income Below Poverty by Sex and Age in Richland
With 18.4% poverty level for males and 24.1% for females among the residents of Richland, 75 year old and over males and 16 and 17 year old females are the most vulnerable to poverty, with 53 males (66.2%) and 6 females (100.0%) in their respective age groups living below the poverty level.
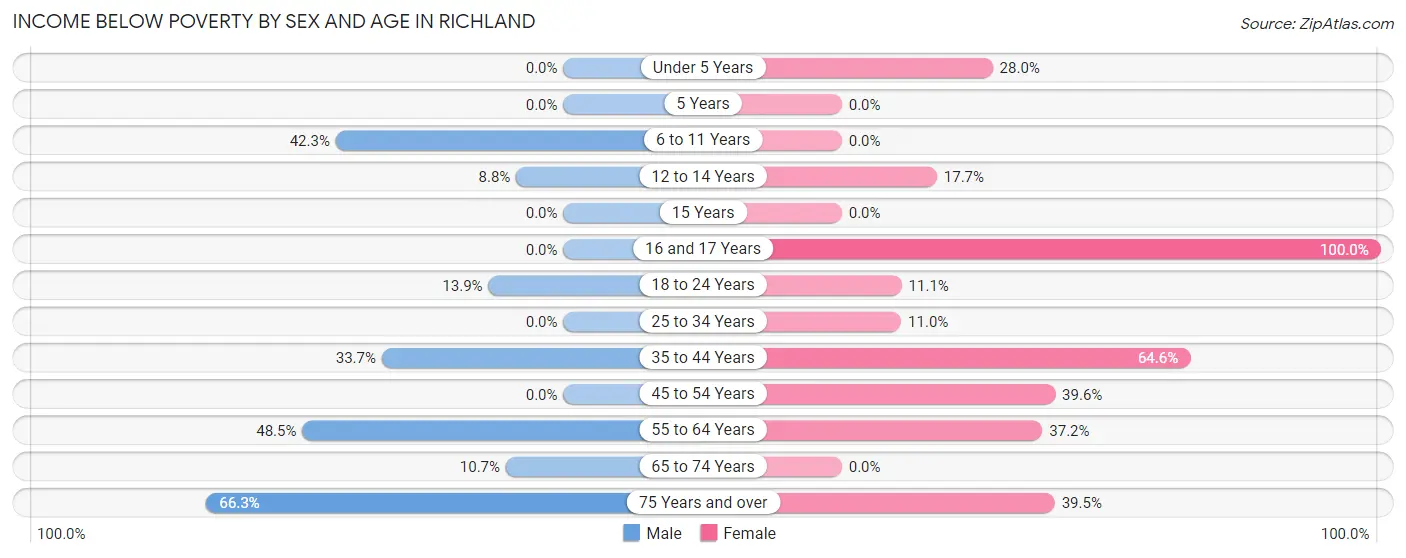
| Age Bracket | Male | Female |
| Under 5 Years | 0 (0.0%) | 28 (28.0%) |
| 5 Years | 0 (0.0%) | 0 (0.0%) |
| 6 to 11 Years | 30 (42.2%) | 0 (0.0%) |
| 12 to 14 Years | 7 (8.7%) | 6 (17.6%) |
| 15 Years | 0 (0.0%) | 0 (0.0%) |
| 16 and 17 Years | 0 (0.0%) | 6 (100.0%) |
| 18 to 24 Years | 16 (13.9%) | 3 (11.1%) |
| 25 to 34 Years | 0 (0.0%) | 27 (11.0%) |
| 35 to 44 Years | 61 (33.7%) | 42 (64.6%) |
| 45 to 54 Years | 0 (0.0%) | 59 (39.6%) |
| 55 to 64 Years | 47 (48.4%) | 51 (37.2%) |
| 65 to 74 Years | 8 (10.7%) | 0 (0.0%) |
| 75 Years and over | 53 (66.2%) | 17 (39.5%) |
| Total | 222 (18.4%) | 239 (24.1%) |
Income Above Poverty by Sex and Age in Richland
According to the poverty statistics in Richland, males aged under 5 years and females aged 6 to 11 years are the age groups that are most secure financially, with 100.0% of males and 100.0% of females in these age groups living above the poverty line.
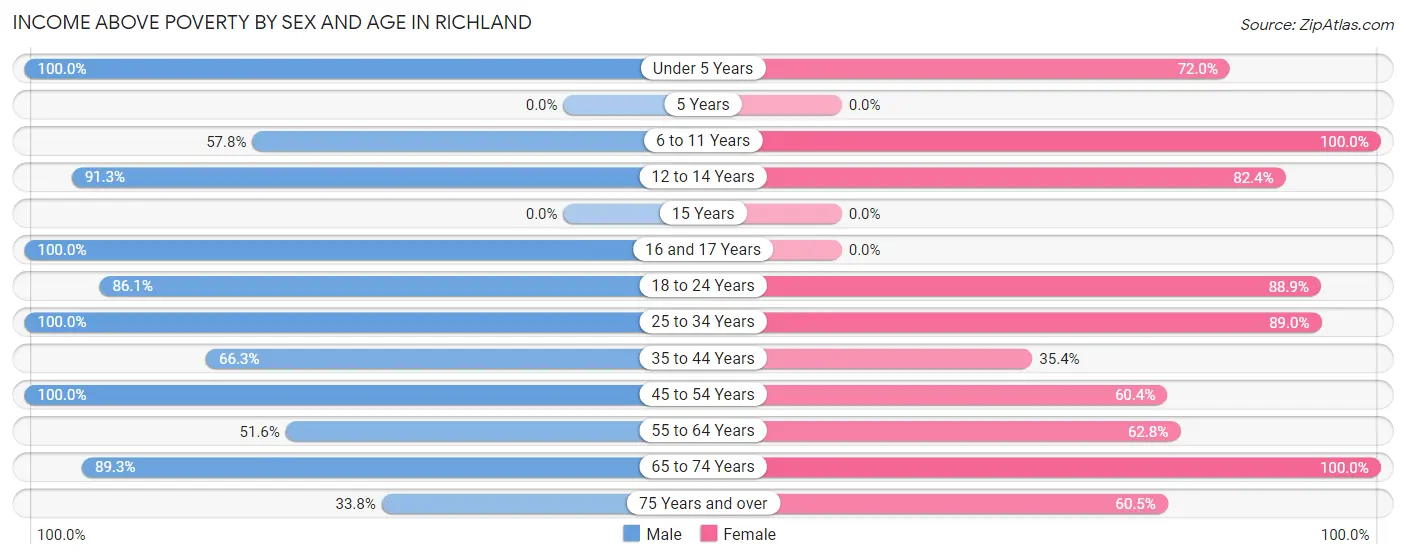
| Age Bracket | Male | Female |
| Under 5 Years | 204 (100.0%) | 72 (72.0%) |
| 5 Years | 0 (0.0%) | 0 (0.0%) |
| 6 to 11 Years | 41 (57.8%) | 131 (100.0%) |
| 12 to 14 Years | 73 (91.2%) | 28 (82.4%) |
| 15 Years | 0 (0.0%) | 0 (0.0%) |
| 16 and 17 Years | 2 (100.0%) | 0 (0.0%) |
| 18 to 24 Years | 99 (86.1%) | 24 (88.9%) |
| 25 to 34 Years | 155 (100.0%) | 218 (89.0%) |
| 35 to 44 Years | 120 (66.3%) | 23 (35.4%) |
| 45 to 54 Years | 145 (100.0%) | 90 (60.4%) |
| 55 to 64 Years | 50 (51.5%) | 86 (62.8%) |
| 65 to 74 Years | 67 (89.3%) | 54 (100.0%) |
| 75 Years and over | 27 (33.8%) | 26 (60.5%) |
| Total | 983 (81.6%) | 752 (75.9%) |
Income Below Poverty Among Married-Couple Families in Richland
The poverty statistics for married-couple families in Richland show that 9.1% or 31 of the total 340 families live below the poverty line. Families with 1 or 2 children have the highest poverty rate of 12.3%, comprising of 9 families. On the other hand, families with 3 or 4 children have the lowest poverty rate of 6.0%, which includes 7 families.
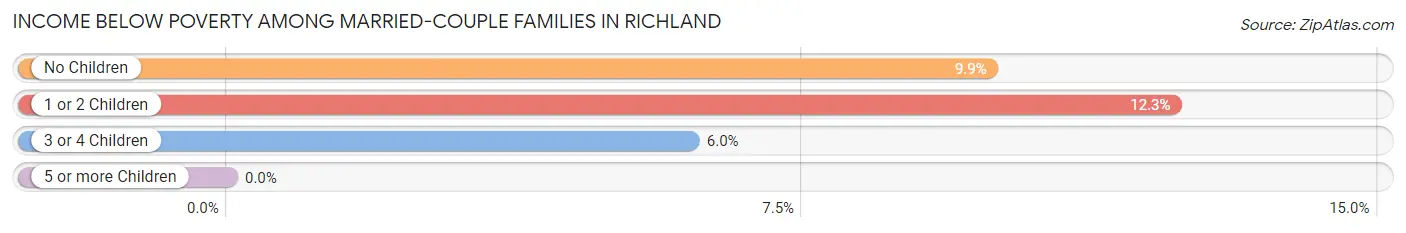
| Children | Above Poverty | Below Poverty |
| No Children | 136 (90.1%) | 15 (9.9%) |
| 1 or 2 Children | 64 (87.7%) | 9 (12.3%) |
| 3 or 4 Children | 109 (94.0%) | 7 (6.0%) |
| 5 or more Children | 0 (0.0%) | 0 (0.0%) |
| Total | 309 (90.9%) | 31 (9.1%) |
Income Below Poverty Among Single-Parent Households in Richland
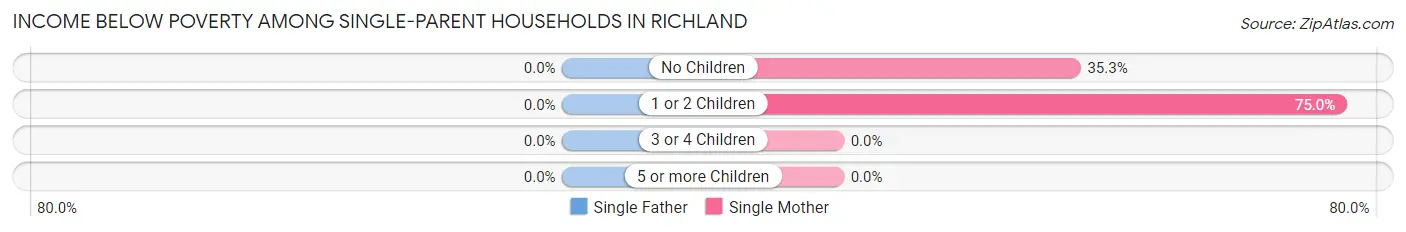
| Children | Single Father | Single Mother |
| No Children | 0 (0.0%) | 12 (35.3%) |
| 1 or 2 Children | 0 (0.0%) | 39 (75.0%) |
| 3 or 4 Children | 0 (0.0%) | 0 (0.0%) |
| 5 or more Children | 0 (0.0%) | 0 (0.0%) |
| Total | 0 (0.0%) | 51 (59.3%) |
Income Below Poverty Among Married-Couple vs Single-Parent Households in Richland
The poverty data for Richland shows that 31 of the married-couple family households (9.1%) and 51 of the single-parent households (39.5%) are living below the poverty level. Within the married-couple family households, those with 1 or 2 children have the highest poverty rate, with 9 households (12.3%) falling below the poverty line. Among the single-parent households, those with 1 or 2 children have the highest poverty rate, with 39 household (47.6%) living below poverty.
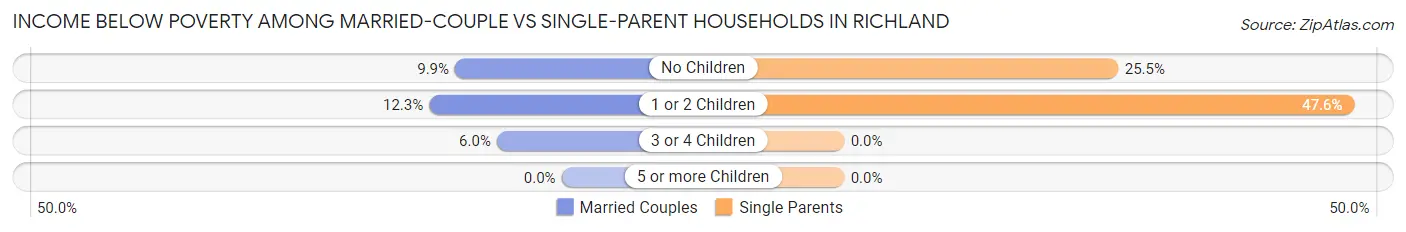
| Children | Married-Couple Families | Single-Parent Households |
| No Children | 15 (9.9%) | 12 (25.5%) |
| 1 or 2 Children | 9 (12.3%) | 39 (47.6%) |
| 3 or 4 Children | 7 (6.0%) | 0 (0.0%) |
| 5 or more Children | 0 (0.0%) | 0 (0.0%) |
| Total | 31 (9.1%) | 51 (39.5%) |
Race in Richland
The most populous races in Richland are White / Caucasian (2,132 | 92.4%), Hispanic or Latino (200 | 8.7%), and Two or more Races (150 | 6.5%).
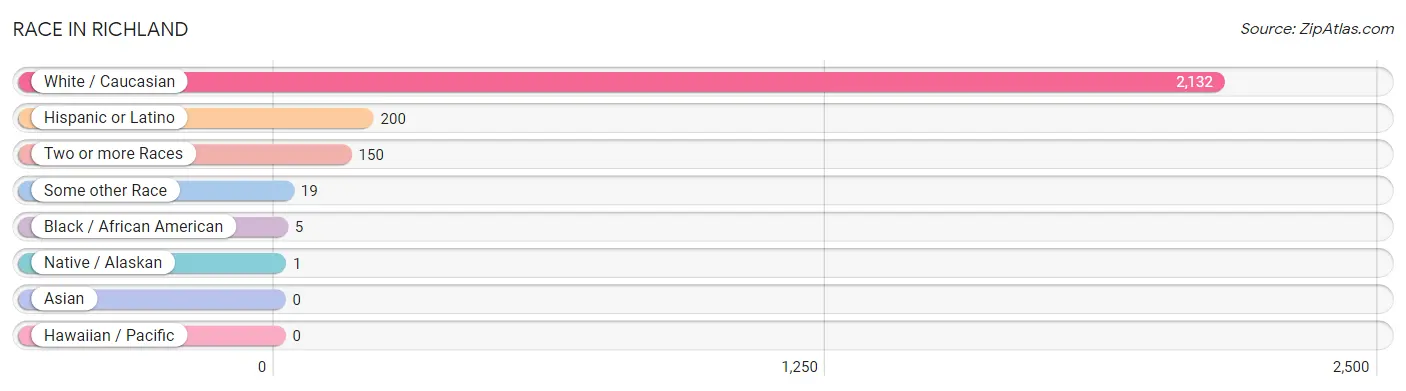
| Race | # Population | % Population |
| Asian | 0 | 0.0% |
| Black / African American | 5 | 0.2% |
| Hawaiian / Pacific | 0 | 0.0% |
| Hispanic or Latino | 200 | 8.7% |
| Native / Alaskan | 1 | 0.0% |
| White / Caucasian | 2,132 | 92.4% |
| Two or more Races | 150 | 6.5% |
| Some other Race | 19 | 0.8% |
| Total | 2,307 | 100.0% |
Ancestry in Richland
The most populous ancestries reported in Richland are German (489 | 21.2%), Irish (242 | 10.5%), English (229 | 9.9%), Mexican (154 | 6.7%), and Polish (130 | 5.6%), together accounting for 53.9% of all Richland residents.
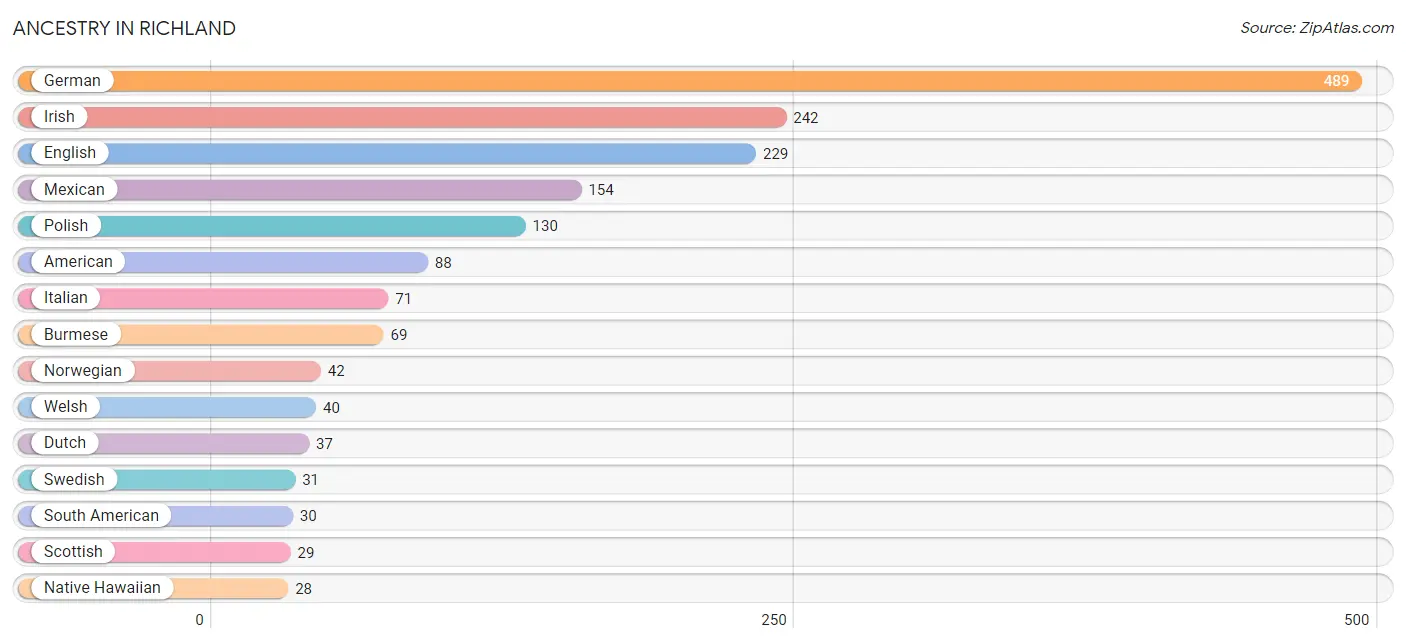
| Ancestry | # Population | % Population |
| American | 88 | 3.8% |
| Burmese | 69 | 3.0% |
| Cherokee | 19 | 0.8% |
| Czech | 21 | 0.9% |
| Dutch | 37 | 1.6% |
| Ecuadorian | 25 | 1.1% |
| English | 229 | 9.9% |
| European | 13 | 0.6% |
| French | 19 | 0.8% |
| German | 489 | 21.2% |
| Irish | 242 | 10.5% |
| Italian | 71 | 3.1% |
| Korean | 25 | 1.1% |
| Mexican | 154 | 6.7% |
| Native Hawaiian | 28 | 1.2% |
| Norwegian | 42 | 1.8% |
| Peruvian | 5 | 0.2% |
| Polish | 130 | 5.6% |
| Portuguese | 3 | 0.1% |
| Puerto Rican | 7 | 0.3% |
| Russian | 14 | 0.6% |
| Scotch-Irish | 11 | 0.5% |
| Scottish | 29 | 1.3% |
| Sioux | 6 | 0.3% |
| South American | 30 | 1.3% |
| Spaniard | 9 | 0.4% |
| Swedish | 31 | 1.3% |
| Welsh | 40 | 1.7% | View All 28 Rows |
Immigrants in Richland
The most numerous immigrant groups reported in Richland came from Central America (16 | 0.7%), Latin America (16 | 0.7%), and Mexico (16 | 0.7%), together accounting for 2.1% of all Richland residents.
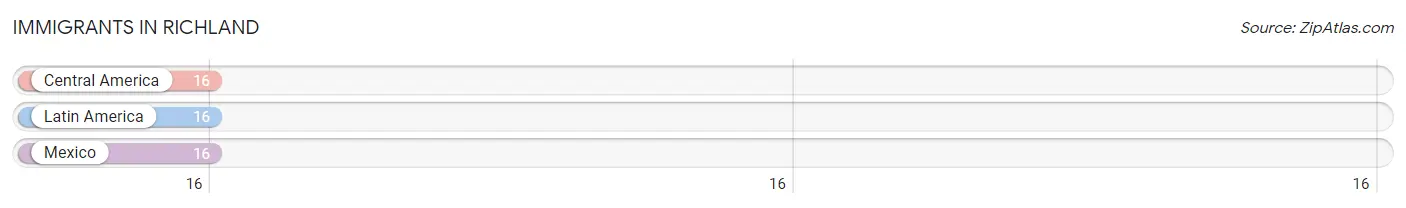
| Immigration Origin | # Population | % Population |
| Central America | 16 | 0.7% |
| Latin America | 16 | 0.7% |
| Mexico | 16 | 0.7% | View All 3 Rows |
Sex and Age in Richland
Sex and Age in Richland
The most populous age groups in Richland are Under 5 Years (204 | 16.8%) for men and 25 to 29 Years (137 | 12.5%) for women.
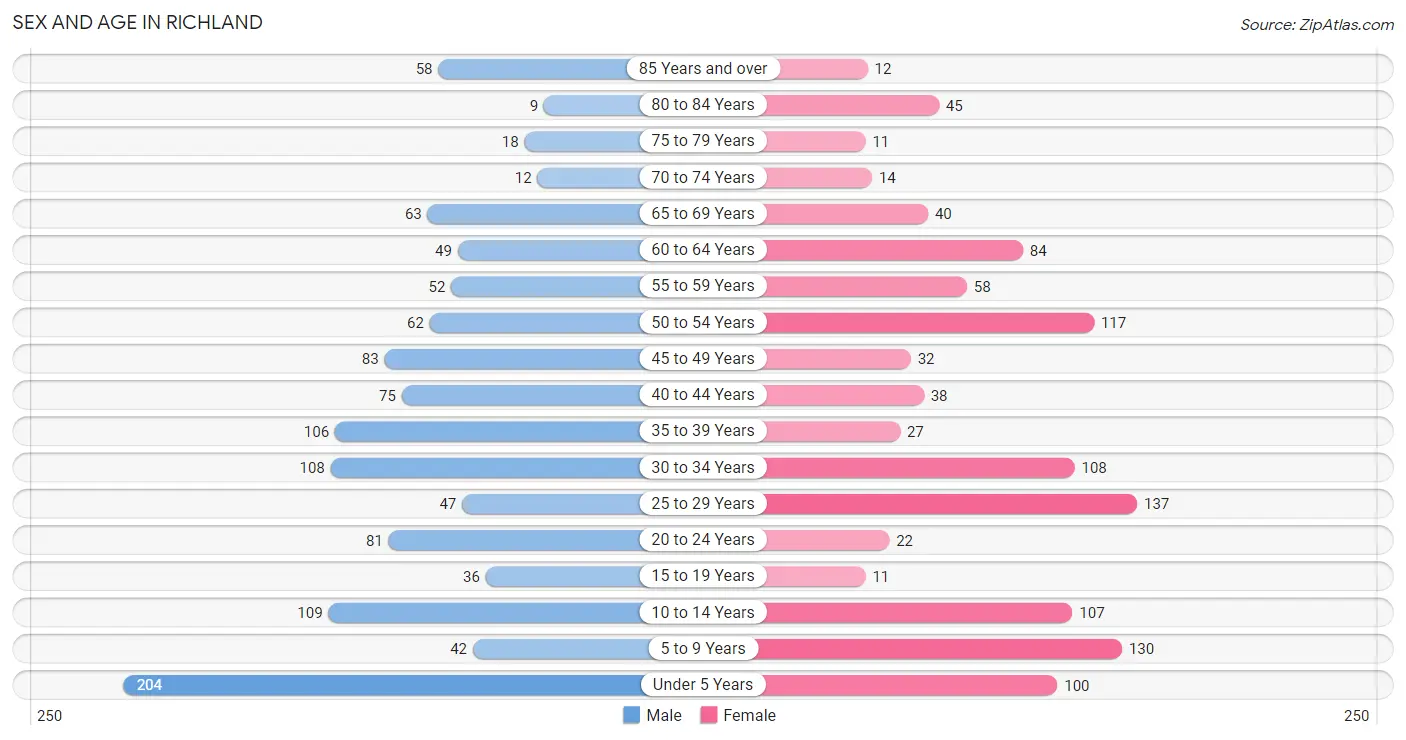
| Age Bracket | Male | Female |
| Under 5 Years | 204 (16.8%) | 100 (9.1%) |
| 5 to 9 Years | 42 (3.5%) | 130 (11.9%) |
| 10 to 14 Years | 109 (9.0%) | 107 (9.8%) |
| 15 to 19 Years | 36 (3.0%) | 11 (1.0%) |
| 20 to 24 Years | 81 (6.7%) | 22 (2.0%) |
| 25 to 29 Years | 47 (3.9%) | 137 (12.5%) |
| 30 to 34 Years | 108 (8.9%) | 108 (9.9%) |
| 35 to 39 Years | 106 (8.7%) | 27 (2.5%) |
| 40 to 44 Years | 75 (6.2%) | 38 (3.5%) |
| 45 to 49 Years | 83 (6.8%) | 32 (2.9%) |
| 50 to 54 Years | 62 (5.1%) | 117 (10.7%) |
| 55 to 59 Years | 52 (4.3%) | 58 (5.3%) |
| 60 to 64 Years | 49 (4.0%) | 84 (7.7%) |
| 65 to 69 Years | 63 (5.2%) | 40 (3.7%) |
| 70 to 74 Years | 12 (1.0%) | 14 (1.3%) |
| 75 to 79 Years | 18 (1.5%) | 11 (1.0%) |
| 80 to 84 Years | 9 (0.7%) | 45 (4.1%) |
| 85 Years and over | 58 (4.8%) | 12 (1.1%) |
| Total | 1,214 (100.0%) | 1,093 (100.0%) |
Families and Households in Richland
Median Family Size in Richland
The median family size in Richland is 3.58 persons per family, with married-couple families (340 | 72.5%) accounting for the largest median family size of 4.02 persons per family. On the other hand, single male/father families (43 | 9.2%) represent the smallest median family size with 2.14 persons per family.
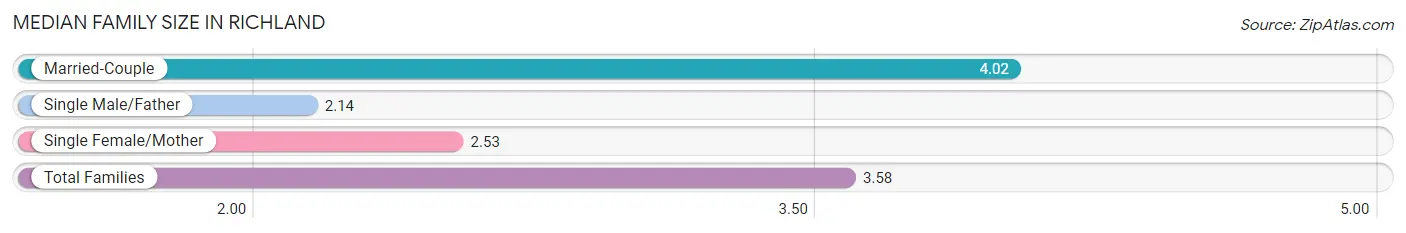
| Family Type | # Families | Family Size |
| Married-Couple | 340 (72.5%) | 4.02 |
| Single Male/Father | 43 (9.2%) | 2.14 |
| Single Female/Mother | 86 (18.3%) | 2.53 |
| Total Families | 469 (100.0%) | 3.58 |
Median Household Size in Richland
The median household size in Richland is 2.75 persons per household, with single male/father households (43 | 5.2%) accounting for the largest median household size of 4.3 persons per household. non-family households (355 | 43.1%) represent the smallest median household size with 1.26 persons per household.
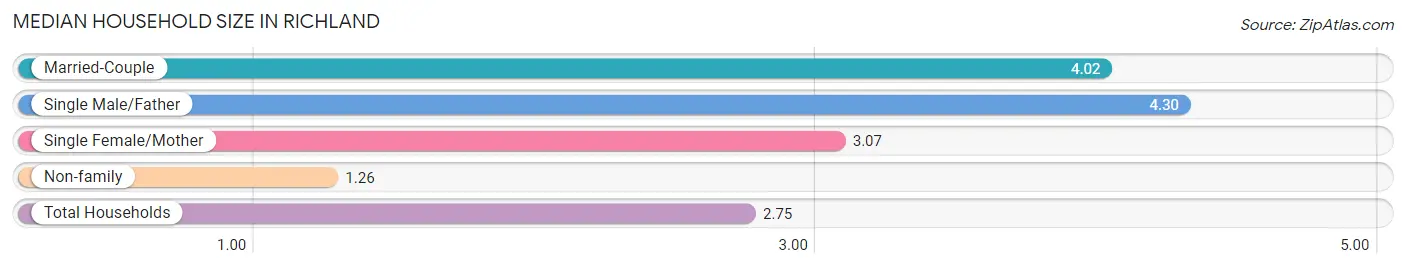
| Household Type | # Households | Household Size |
| Married-Couple | 340 (41.3%) | 4.02 |
| Single Male/Father | 43 (5.2%) | 4.30 |
| Single Female/Mother | 86 (10.4%) | 3.07 |
| Non-family | 355 (43.1%) | 1.26 |
| Total Households | 824 (100.0%) | 2.75 |
Household Size by Marriage Status in Richland
Out of a total of 824 households in Richland, 469 (56.9%) are family households, while 355 (43.1%) are nonfamily households. The most numerous type of family households are 2-person households, comprising 208, and the most common type of nonfamily households are 1-person households, comprising 301.
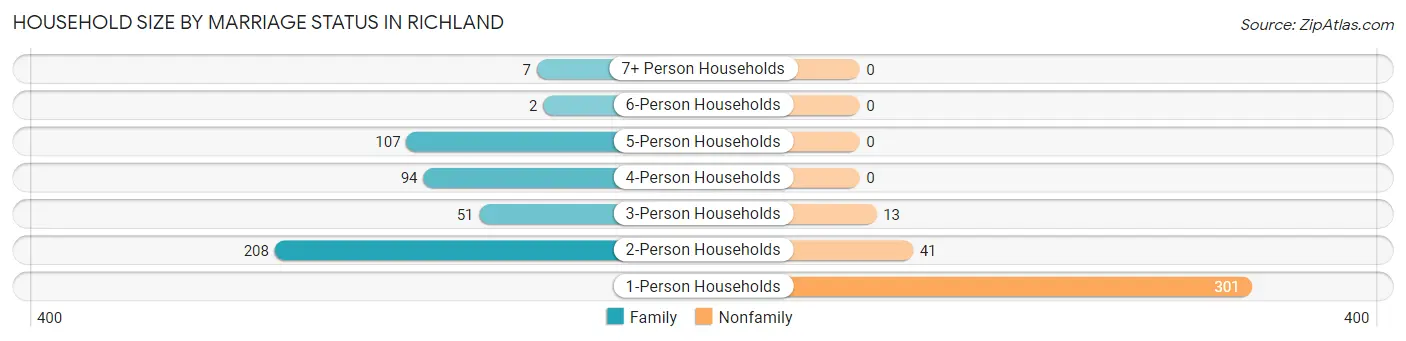
| Household Size | Family Households | Nonfamily Households |
| 1-Person Households | - | 301 (36.5%) |
| 2-Person Households | 208 (25.2%) | 41 (5.0%) |
| 3-Person Households | 51 (6.2%) | 13 (1.6%) |
| 4-Person Households | 94 (11.4%) | 0 (0.0%) |
| 5-Person Households | 107 (13.0%) | 0 (0.0%) |
| 6-Person Households | 2 (0.2%) | 0 (0.0%) |
| 7+ Person Households | 7 (0.9%) | 0 (0.0%) |
| Total | 469 (56.9%) | 355 (43.1%) |
Female Fertility in Richland
Fertility by Age in Richland
Average fertility rate in Richland is 234.0 births per 1,000 women. Women in the age bracket of 20 to 34 years have the highest fertility rate with 341.0 births per 1,000 women. Women in the age bracket of 20 to 34 years acount for 100.0% of all women with births.
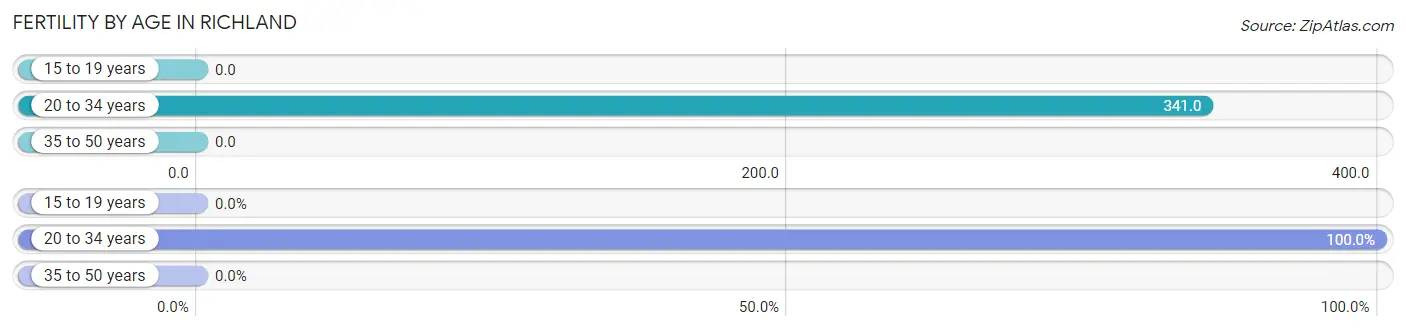
| Age Bracket | Women with Births | Births / 1,000 Women |
| 15 to 19 years | 0 (0.0%) | 0.0 |
| 20 to 34 years | 91 (100.0%) | 341.0 |
| 35 to 50 years | 0 (0.0%) | 0.0 |
| Total | 91 (100.0%) | 234.0 |
Fertility by Age by Marriage Status in Richland
76.9% of women with births (91) in Richland are married. The highest percentage of unmarried women with births falls into 20 to 34 years age bracket with 23.1% of them unmarried at the time of birth, while the lowest percentage of unmarried women with births belong to 20 to 34 years age bracket with 23.1% of them unmarried.
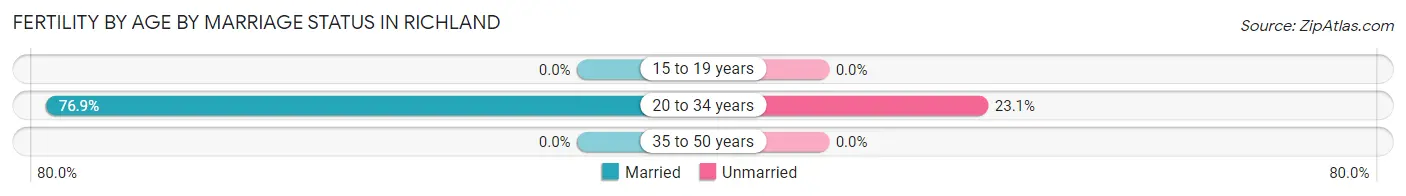
| Age Bracket | Married | Unmarried |
| 15 to 19 years | 0 (0.0%) | 0 (0.0%) |
| 20 to 34 years | 70 (76.9%) | 21 (23.1%) |
| 35 to 50 years | 0 (0.0%) | 0 (0.0%) |
| Total | 70 (76.9%) | 21 (23.1%) |
Fertility by Education in Richland
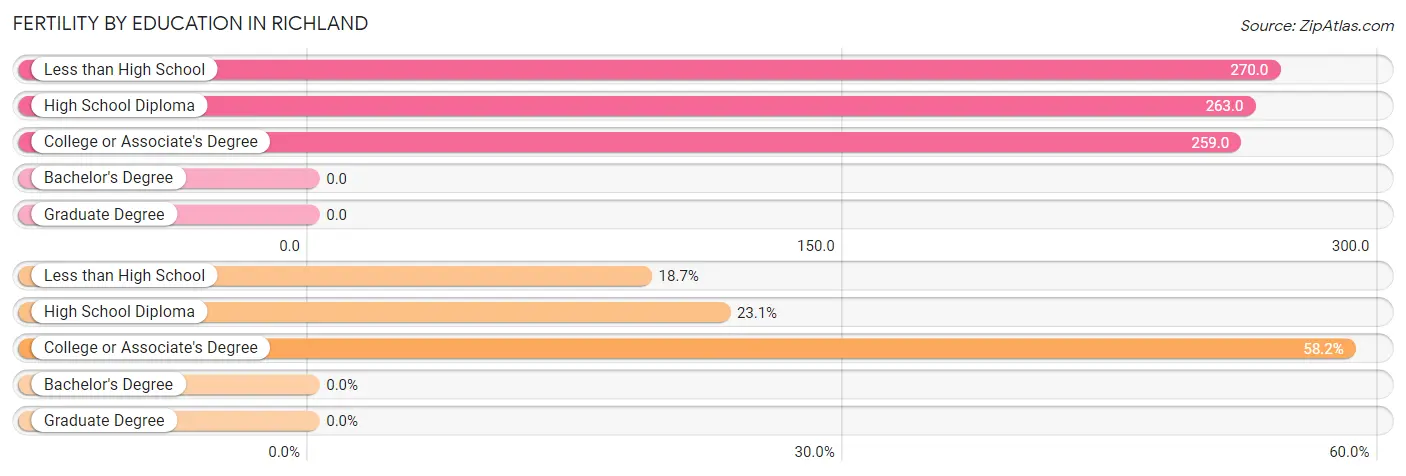
| Educational Attainment | Women with Births | Births / 1,000 Women |
| Less than High School | 17 (18.7%) | 270.0 |
| High School Diploma | 21 (23.1%) | 263.0 |
| College or Associate's Degree | 53 (58.2%) | 259.0 |
| Bachelor's Degree | 0 (0.0%) | 0.0 |
| Graduate Degree | 0 (0.0%) | 0.0 |
| Total | 91 (100.0%) | 234.0 |
Fertility by Education by Marriage Status in Richland
23.1% of women with births in Richland are unmarried. Women with the educational attainment of less than high school are most likely to be married with 100.0% of them married at childbirth, while women with the educational attainment of high school diploma are least likely to be married with 100.0% of them unmarried at childbirth.
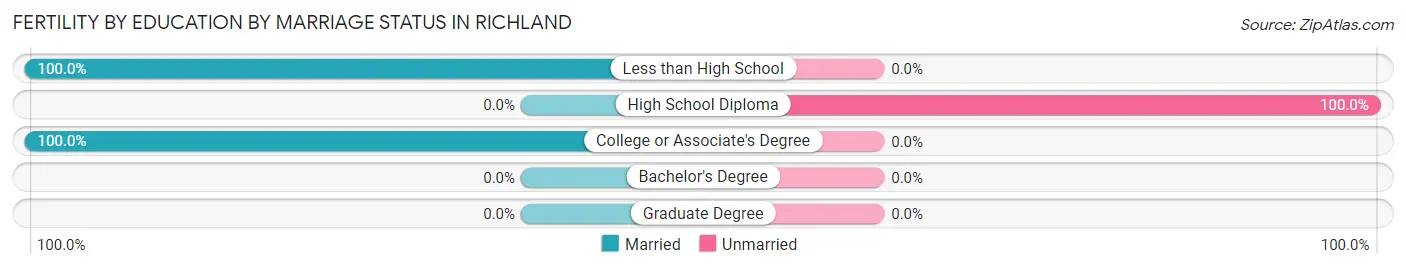
| Educational Attainment | Married | Unmarried |
| Less than High School | 17 (100.0%) | 0 (0.0%) |
| High School Diploma | 0 (0.0%) | 21 (100.0%) |
| College or Associate's Degree | 53 (100.0%) | 0 (0.0%) |
| Bachelor's Degree | 0 (0.0%) | 0 (0.0%) |
| Graduate Degree | 0 (0.0%) | 0 (0.0%) |
| Total | 70 (76.9%) | 21 (23.1%) |
Employment Characteristics in Richland
Employment by Class of Employer in Richland
Among the 841 employed individuals in Richland, private company employees (680 | 80.9%), federal government employees (65 | 7.7%), and local government employees (40 | 4.8%) make up the most common classes of employment.
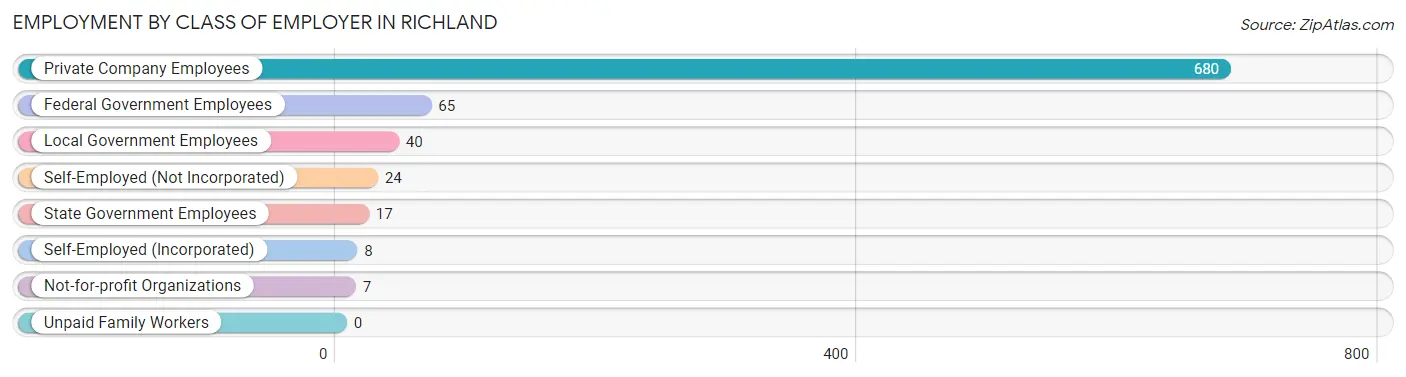
| Employer Class | # Employees | % Employees |
| Private Company Employees | 680 | 80.9% |
| Self-Employed (Incorporated) | 8 | 0.9% |
| Self-Employed (Not Incorporated) | 24 | 2.9% |
| Not-for-profit Organizations | 7 | 0.8% |
| Local Government Employees | 40 | 4.8% |
| State Government Employees | 17 | 2.0% |
| Federal Government Employees | 65 | 7.7% |
| Unpaid Family Workers | 0 | 0.0% |
| Total | 841 | 100.0% |
Employment Status by Age in Richland
According to the labor force statistics for Richland, out of the total population over 16 years of age (1,615), 57.0% or 921 individuals are in the labor force, with 6.1% or 56 of them unemployed. The age group with the highest labor force participation rate is 20 to 24 years, with 99.0% or 102 individuals in the labor force. Within the labor force, the 25 to 29 years age range has the highest percentage of unemployed individuals, with 23.1% or 42 of them being unemployed.
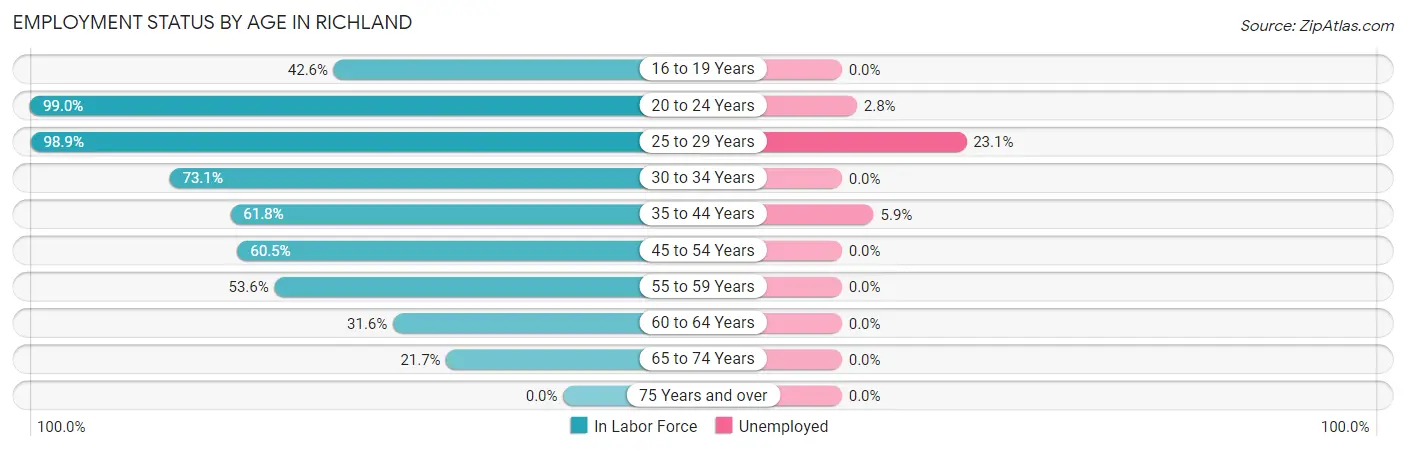
| Age Bracket | In Labor Force | Unemployed |
| 16 to 19 Years | 20 (42.6%) | 0 (0.0%) |
| 20 to 24 Years | 102 (99.0%) | 3 (2.8%) |
| 25 to 29 Years | 182 (98.9%) | 42 (23.1%) |
| 30 to 34 Years | 158 (73.1%) | 0 (0.0%) |
| 35 to 44 Years | 152 (61.8%) | 9 (5.9%) |
| 45 to 54 Years | 178 (60.5%) | 0 (0.0%) |
| 55 to 59 Years | 59 (53.6%) | 0 (0.0%) |
| 60 to 64 Years | 42 (31.6%) | 0 (0.0%) |
| 65 to 74 Years | 28 (21.7%) | 0 (0.0%) |
| 75 Years and over | 0 (0.0%) | 0 (0.0%) |
| Total | 921 (57.0%) | 56 (6.1%) |
Employment Status by Educational Attainment in Richland
According to labor force statistics for Richland, 65.2% of individuals (771) out of the total population between 25 and 64 years of age (1,183) are in the labor force, with 6.6% or 51 of them being unemployed. The group with the highest labor force participation rate are those with the educational attainment of college / associate degree, with 77.6% or 315 individuals in the labor force. Within the labor force, individuals with less than high school education have the highest percentage of unemployment, with 17.9% or 17 of them being unemployed.
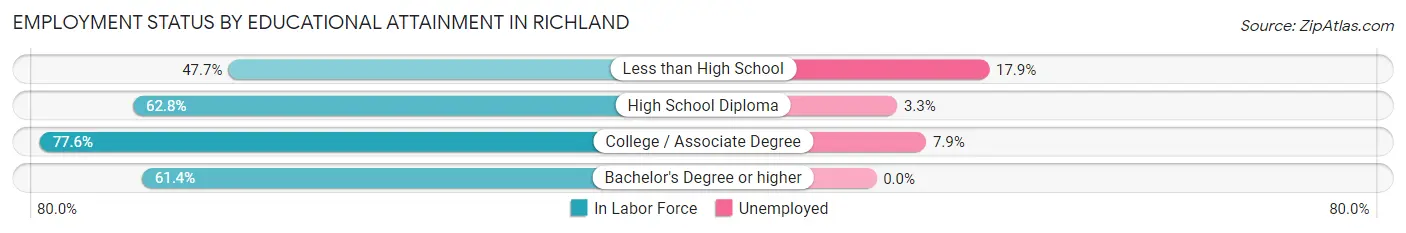
| Educational Attainment | In Labor Force | Unemployed |
| Less than High School | 95 (47.7%) | 36 (17.9%) |
| High School Diploma | 272 (62.8%) | 14 (3.3%) |
| College / Associate Degree | 315 (77.6%) | 32 (7.9%) |
| Bachelor's Degree or higher | 89 (61.4%) | 0 (0.0%) |
| Total | 771 (65.2%) | 78 (6.6%) |
Employment Occupations by Sex in Richland
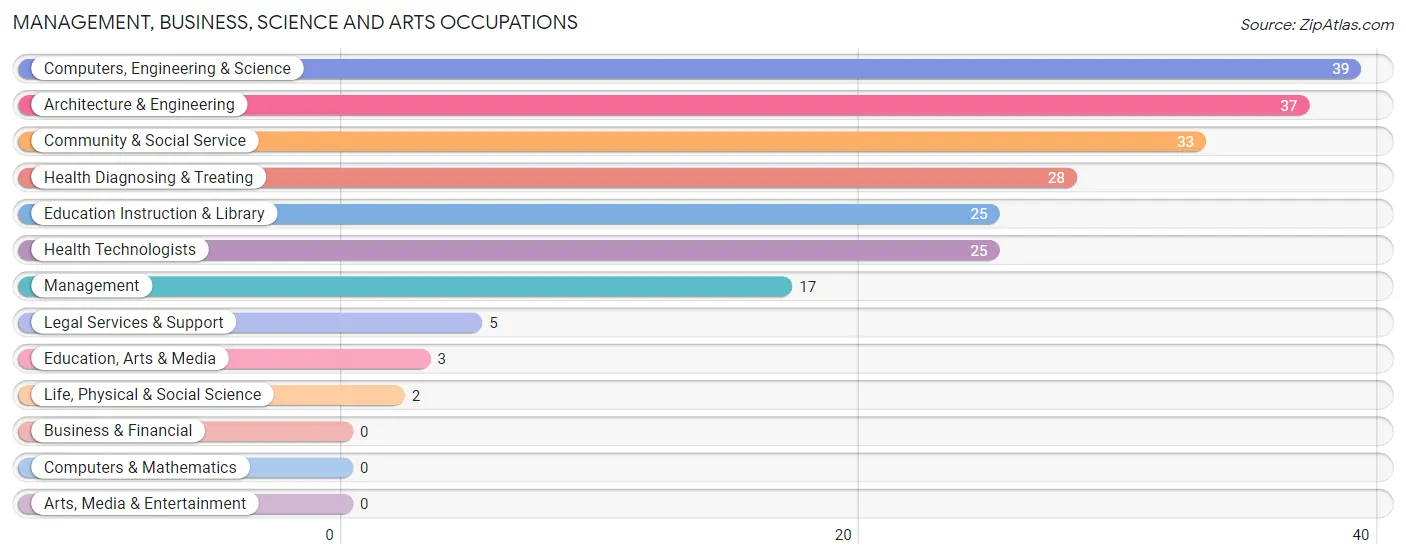
Management, Business, Science and Arts Occupations
The most common Management, Business, Science and Arts occupations in Richland are Computers, Engineering & Science (39 | 4.8%), Architecture & Engineering (37 | 4.5%), Community & Social Service (33 | 4.0%), Health Diagnosing & Treating (28 | 3.4%), and Education Instruction & Library (25 | 3.0%).
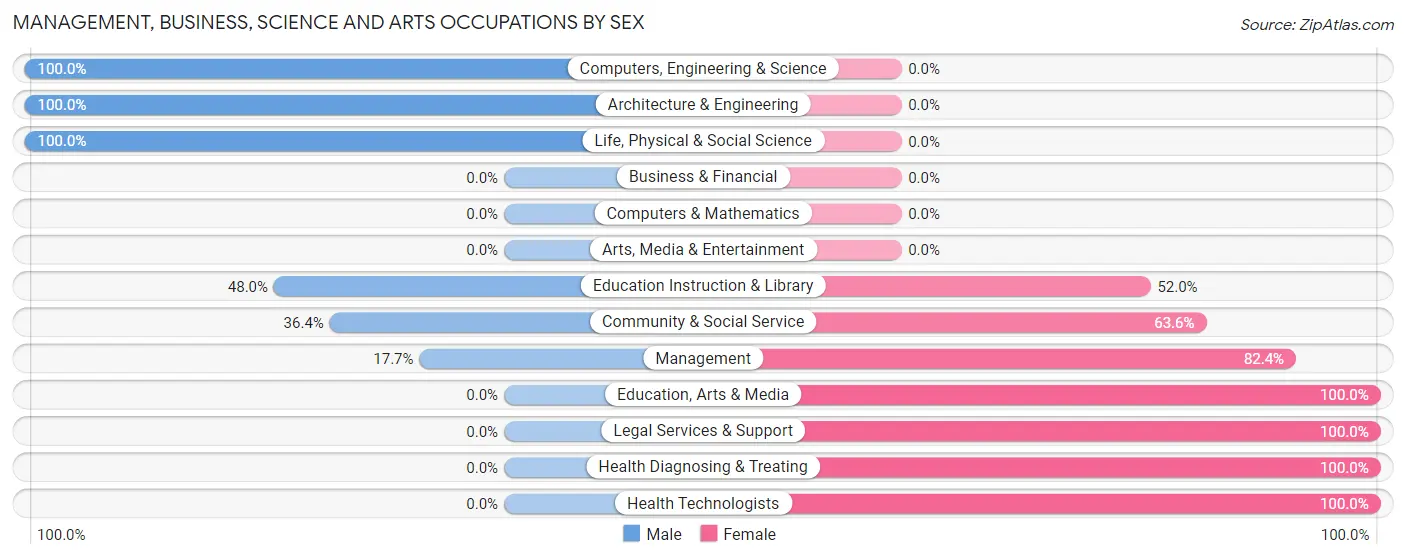
Management, Business, Science and Arts Occupations by Sex
Within the Management, Business, Science and Arts occupations in Richland, the most male-oriented occupations are Computers, Engineering & Science (100.0%), Architecture & Engineering (100.0%), and Life, Physical & Social Science (100.0%), while the most female-oriented occupations are Education, Arts & Media (100.0%), Legal Services & Support (100.0%), and Health Diagnosing & Treating (100.0%).
| Occupation | Male | Female |
| Management | 3 (17.6%) | 14 (82.4%) |
| Business & Financial | 0 (0.0%) | 0 (0.0%) |
| Computers, Engineering & Science | 39 (100.0%) | 0 (0.0%) |
| Computers & Mathematics | 0 (0.0%) | 0 (0.0%) |
| Architecture & Engineering | 37 (100.0%) | 0 (0.0%) |
| Life, Physical & Social Science | 2 (100.0%) | 0 (0.0%) |
| Community & Social Service | 12 (36.4%) | 21 (63.6%) |
| Education, Arts & Media | 0 (0.0%) | 3 (100.0%) |
| Legal Services & Support | 0 (0.0%) | 5 (100.0%) |
| Education Instruction & Library | 12 (48.0%) | 13 (52.0%) |
| Arts, Media & Entertainment | 0 (0.0%) | 0 (0.0%) |
| Health Diagnosing & Treating | 0 (0.0%) | 28 (100.0%) |
| Health Technologists | 0 (0.0%) | 25 (100.0%) |
| Total (Category) | 54 (46.2%) | 63 (53.8%) |
| Total (Overall) | 503 (61.3%) | 317 (38.7%) |
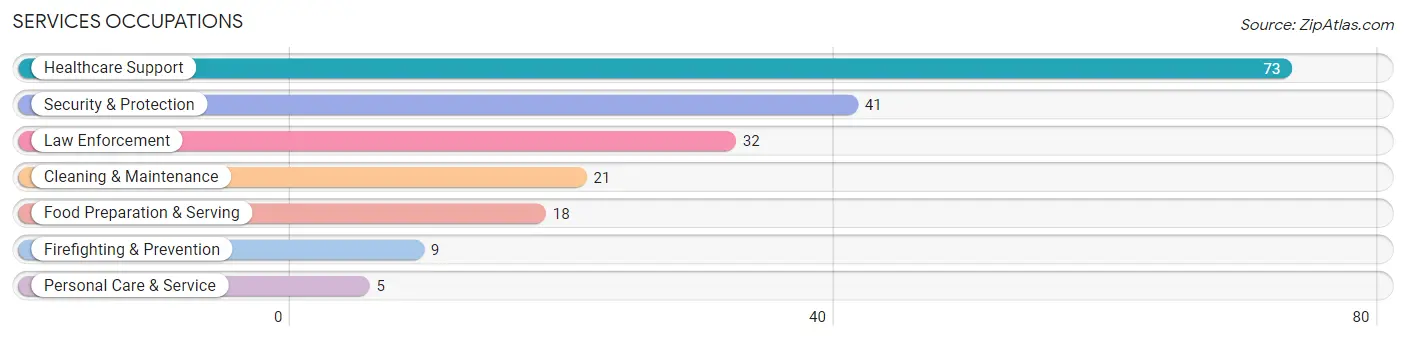
Services Occupations
The most common Services occupations in Richland are Healthcare Support (73 | 8.9%), Security & Protection (41 | 5.0%), Law Enforcement (32 | 3.9%), Cleaning & Maintenance (21 | 2.6%), and Food Preparation & Serving (18 | 2.2%).
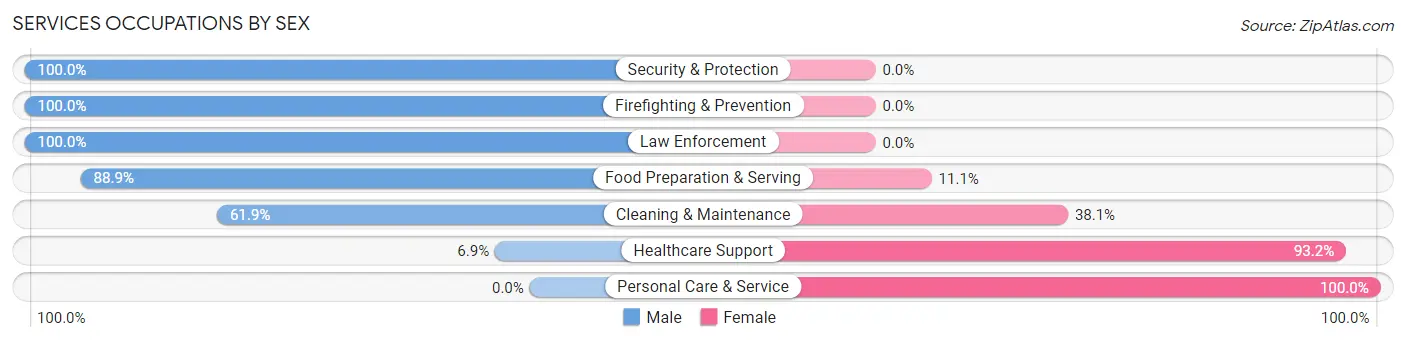
Services Occupations by Sex
Within the Services occupations in Richland, the most male-oriented occupations are Security & Protection (100.0%), Firefighting & Prevention (100.0%), and Law Enforcement (100.0%), while the most female-oriented occupations are Personal Care & Service (100.0%), Healthcare Support (93.1%), and Cleaning & Maintenance (38.1%).
| Occupation | Male | Female |
| Healthcare Support | 5 (6.9%) | 68 (93.1%) |
| Security & Protection | 41 (100.0%) | 0 (0.0%) |
| Firefighting & Prevention | 9 (100.0%) | 0 (0.0%) |
| Law Enforcement | 32 (100.0%) | 0 (0.0%) |
| Food Preparation & Serving | 16 (88.9%) | 2 (11.1%) |
| Cleaning & Maintenance | 13 (61.9%) | 8 (38.1%) |
| Personal Care & Service | 0 (0.0%) | 5 (100.0%) |
| Total (Category) | 75 (47.5%) | 83 (52.5%) |
| Total (Overall) | 503 (61.3%) | 317 (38.7%) |
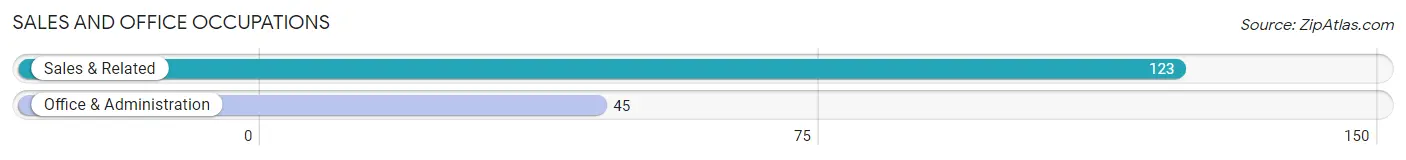
Sales and Office Occupations
The most common Sales and Office occupations in Richland are Sales & Related (123 | 15.0%), and Office & Administration (45 | 5.5%).
Sales and Office Occupations by Sex
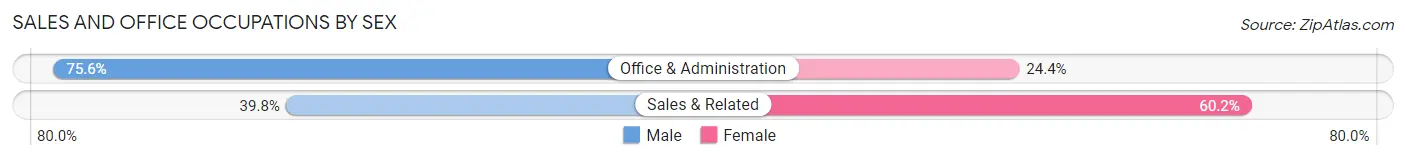
| Occupation | Male | Female |
| Sales & Related | 49 (39.8%) | 74 (60.2%) |
| Office & Administration | 34 (75.6%) | 11 (24.4%) |
| Total (Category) | 83 (49.4%) | 85 (50.6%) |
| Total (Overall) | 503 (61.3%) | 317 (38.7%) |
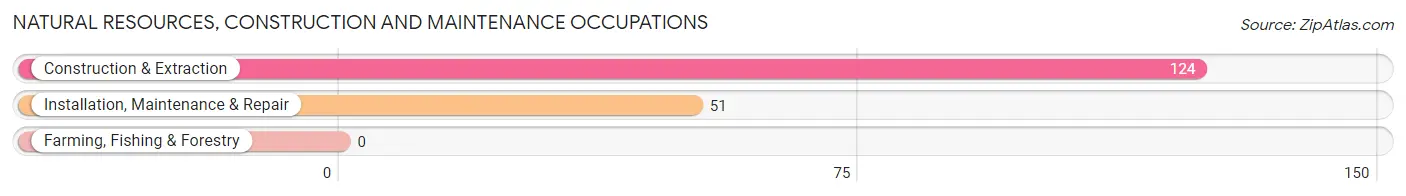
Natural Resources, Construction and Maintenance Occupations
The most common Natural Resources, Construction and Maintenance occupations in Richland are Construction & Extraction (124 | 15.1%), and Installation, Maintenance & Repair (51 | 6.2%).
Natural Resources, Construction and Maintenance Occupations by Sex
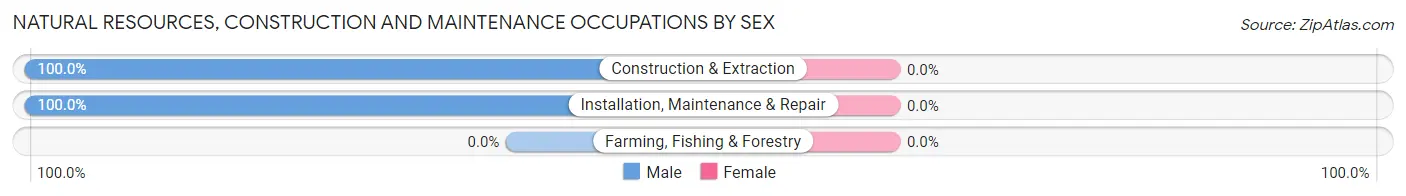
| Occupation | Male | Female |
| Farming, Fishing & Forestry | 0 (0.0%) | 0 (0.0%) |
| Construction & Extraction | 124 (100.0%) | 0 (0.0%) |
| Installation, Maintenance & Repair | 51 (100.0%) | 0 (0.0%) |
| Total (Category) | 175 (100.0%) | 0 (0.0%) |
| Total (Overall) | 503 (61.3%) | 317 (38.7%) |
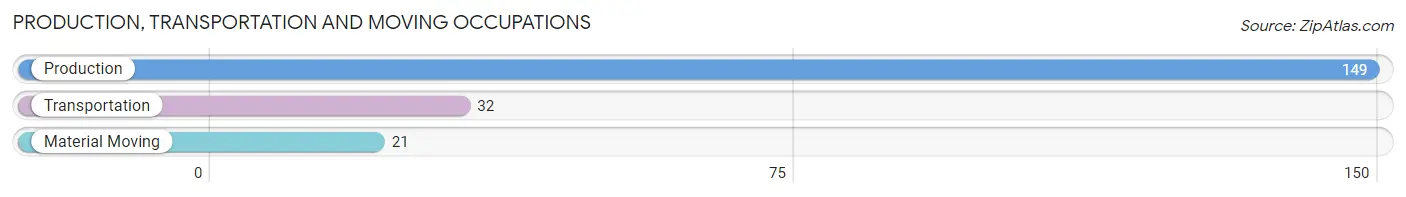
Production, Transportation and Moving Occupations
The most common Production, Transportation and Moving occupations in Richland are Production (149 | 18.2%), Transportation (32 | 3.9%), and Material Moving (21 | 2.6%).
Production, Transportation and Moving Occupations by Sex
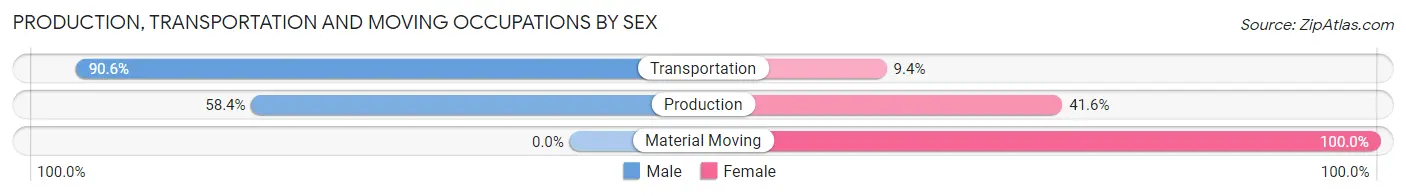
| Occupation | Male | Female |
| Production | 87 (58.4%) | 62 (41.6%) |
| Transportation | 29 (90.6%) | 3 (9.4%) |
| Material Moving | 0 (0.0%) | 21 (100.0%) |
| Total (Category) | 116 (57.4%) | 86 (42.6%) |
| Total (Overall) | 503 (61.3%) | 317 (38.7%) |
Employment Industries by Sex in Richland
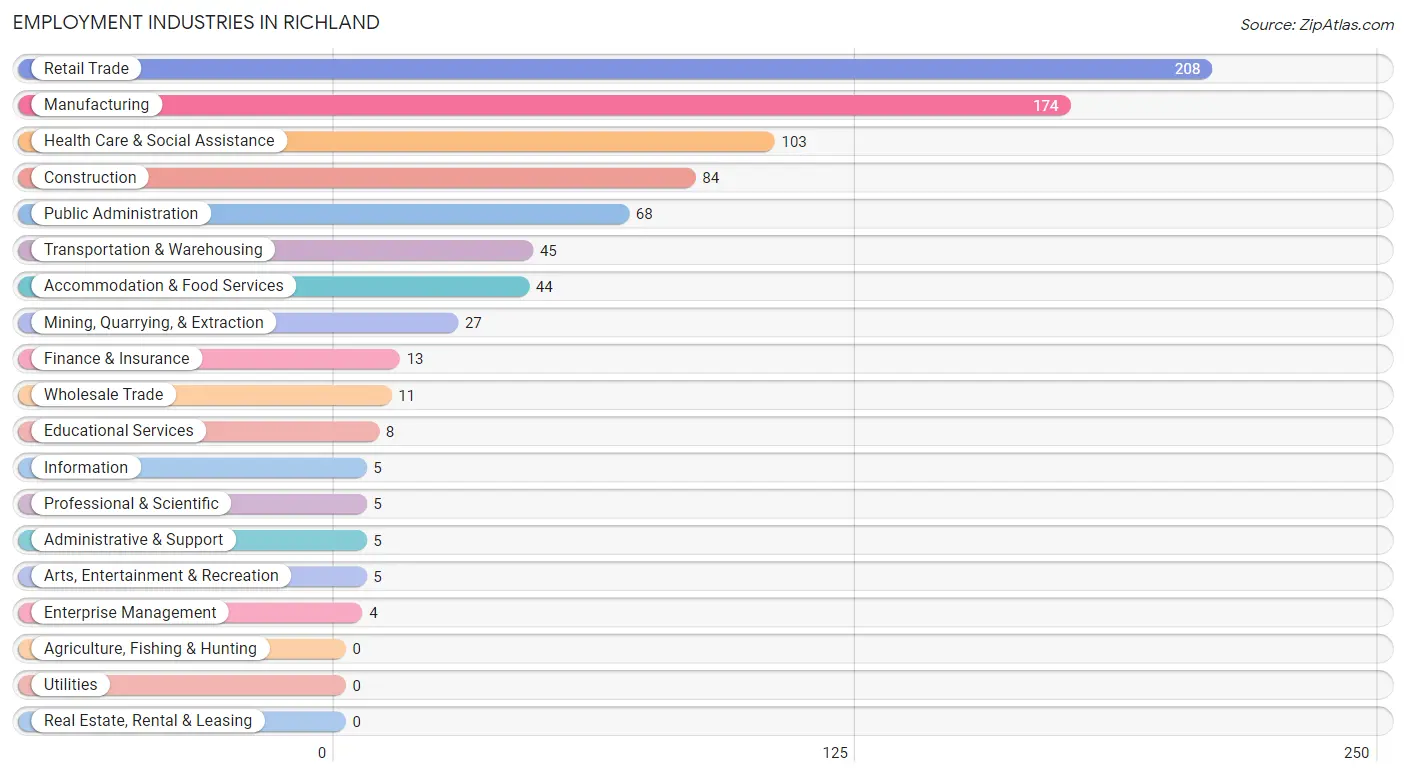
Employment Industries in Richland
The major employment industries in Richland include Retail Trade (208 | 25.4%), Manufacturing (174 | 21.2%), Health Care & Social Assistance (103 | 12.6%), Construction (84 | 10.2%), and Public Administration (68 | 8.3%).
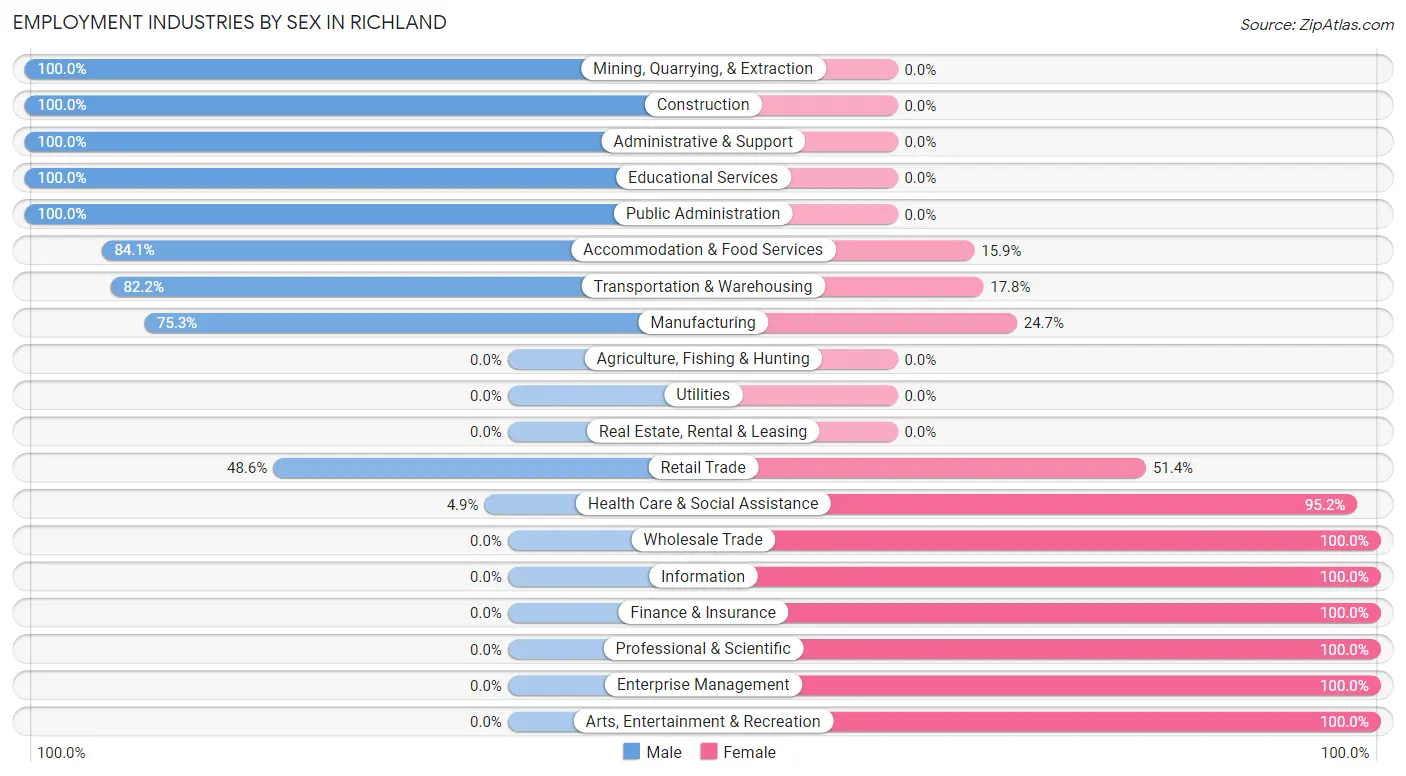
Employment Industries by Sex in Richland
The Richland industries that see more men than women are Mining, Quarrying, & Extraction (100.0%), Construction (100.0%), and Administrative & Support (100.0%), whereas the industries that tend to have a higher number of women are Wholesale Trade (100.0%), Information (100.0%), and Finance & Insurance (100.0%).
| Industry | Male | Female |
| Agriculture, Fishing & Hunting | 0 (0.0%) | 0 (0.0%) |
| Mining, Quarrying, & Extraction | 27 (100.0%) | 0 (0.0%) |
| Construction | 84 (100.0%) | 0 (0.0%) |
| Manufacturing | 131 (75.3%) | 43 (24.7%) |
| Wholesale Trade | 0 (0.0%) | 11 (100.0%) |
| Retail Trade | 101 (48.6%) | 107 (51.4%) |
| Transportation & Warehousing | 37 (82.2%) | 8 (17.8%) |
| Utilities | 0 (0.0%) | 0 (0.0%) |
| Information | 0 (0.0%) | 5 (100.0%) |
| Finance & Insurance | 0 (0.0%) | 13 (100.0%) |
| Real Estate, Rental & Leasing | 0 (0.0%) | 0 (0.0%) |
| Professional & Scientific | 0 (0.0%) | 5 (100.0%) |
| Enterprise Management | 0 (0.0%) | 4 (100.0%) |
| Administrative & Support | 5 (100.0%) | 0 (0.0%) |
| Educational Services | 8 (100.0%) | 0 (0.0%) |
| Health Care & Social Assistance | 5 (4.9%) | 98 (95.2%) |
| Arts, Entertainment & Recreation | 0 (0.0%) | 5 (100.0%) |
| Accommodation & Food Services | 37 (84.1%) | 7 (15.9%) |
| Public Administration | 68 (100.0%) | 0 (0.0%) |
| Total | 503 (61.3%) | 317 (38.7%) |
Education in Richland
School Enrollment in Richland
The most common levels of schooling among the 612 students in Richland are middle school (204 | 33.3%), college / undergraduate (177 | 28.9%), and elementary school (98 | 16.0%).
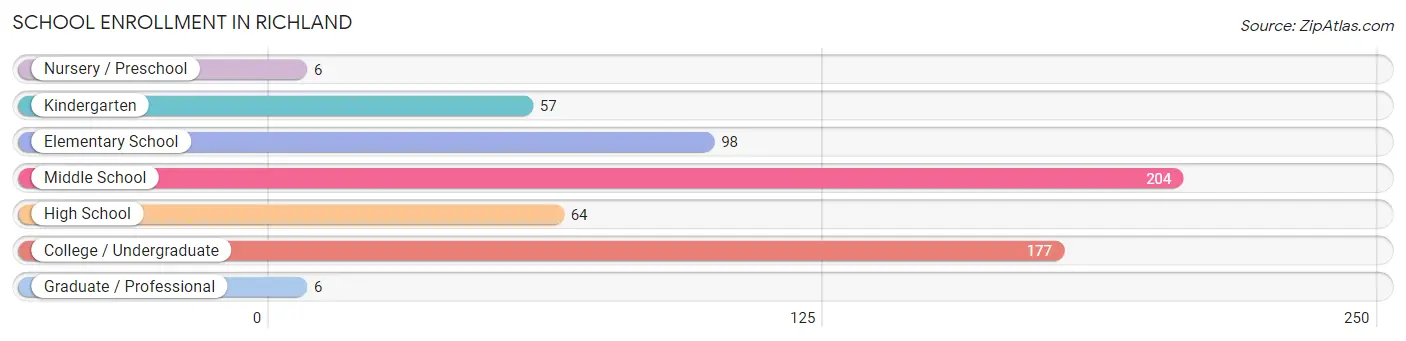
| School Level | # Students | % Students |
| Nursery / Preschool | 6 | 1.0% |
| Kindergarten | 57 | 9.3% |
| Elementary School | 98 | 16.0% |
| Middle School | 204 | 33.3% |
| High School | 64 | 10.5% |
| College / Undergraduate | 177 | 28.9% |
| Graduate / Professional | 6 | 1.0% |
| Total | 612 | 100.0% |
School Enrollment by Age by Funding Source in Richland
Out of a total of 612 students who are enrolled in schools in Richland, 161 (26.3%) attend a private institution, while the remaining 451 (73.7%) are enrolled in public schools. The age group of 18 to 19 year olds has the highest likelihood of being enrolled in private schools, with 37 (94.9% in the age bracket) enrolled. Conversely, the age group of 3 to 4 year olds has the lowest likelihood of being enrolled in a private school, with 6 (100.0% in the age bracket) attending a public institution.
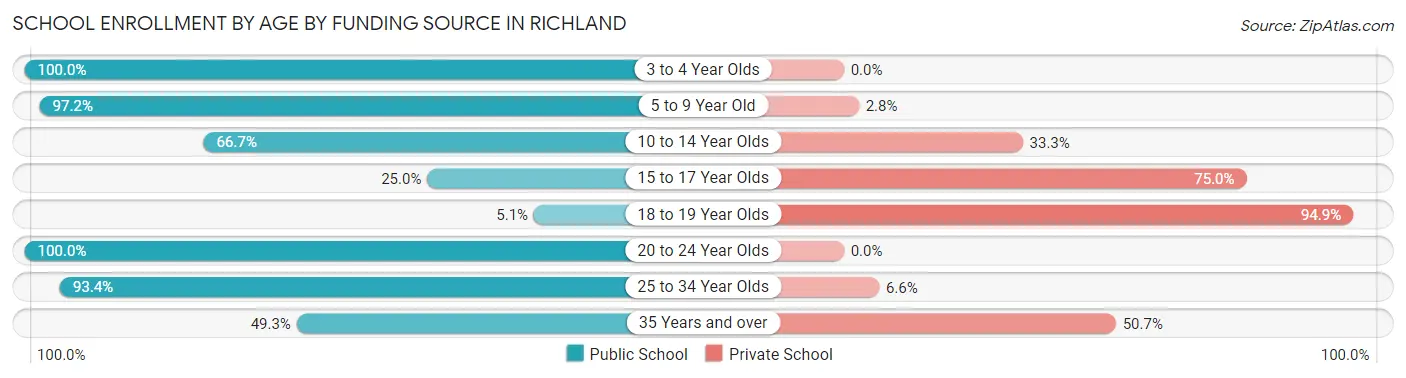
| Age Bracket | Public School | Private School |
| 3 to 4 Year Olds | 6 (100.0%) | 0 (0.0%) |
| 5 to 9 Year Old | 139 (97.2%) | 4 (2.8%) |
| 10 to 14 Year Olds | 144 (66.7%) | 72 (33.3%) |
| 15 to 17 Year Olds | 2 (25.0%) | 6 (75.0%) |
| 18 to 19 Year Olds | 2 (5.1%) | 37 (94.9%) |
| 20 to 24 Year Olds | 51 (100.0%) | 0 (0.0%) |
| 25 to 34 Year Olds | 71 (93.4%) | 5 (6.6%) |
| 35 Years and over | 36 (49.3%) | 37 (50.7%) |
| Total | 451 (73.7%) | 161 (26.3%) |
Educational Attainment by Field of Study in Richland
Literature & languages (53 | 23.8%), science & technology (30 | 13.5%), business (29 | 13.0%), liberal arts & history (28 | 12.6%), and education (21 | 9.4%) are the most common fields of study among 223 individuals in Richland who have obtained a bachelor's degree or higher.
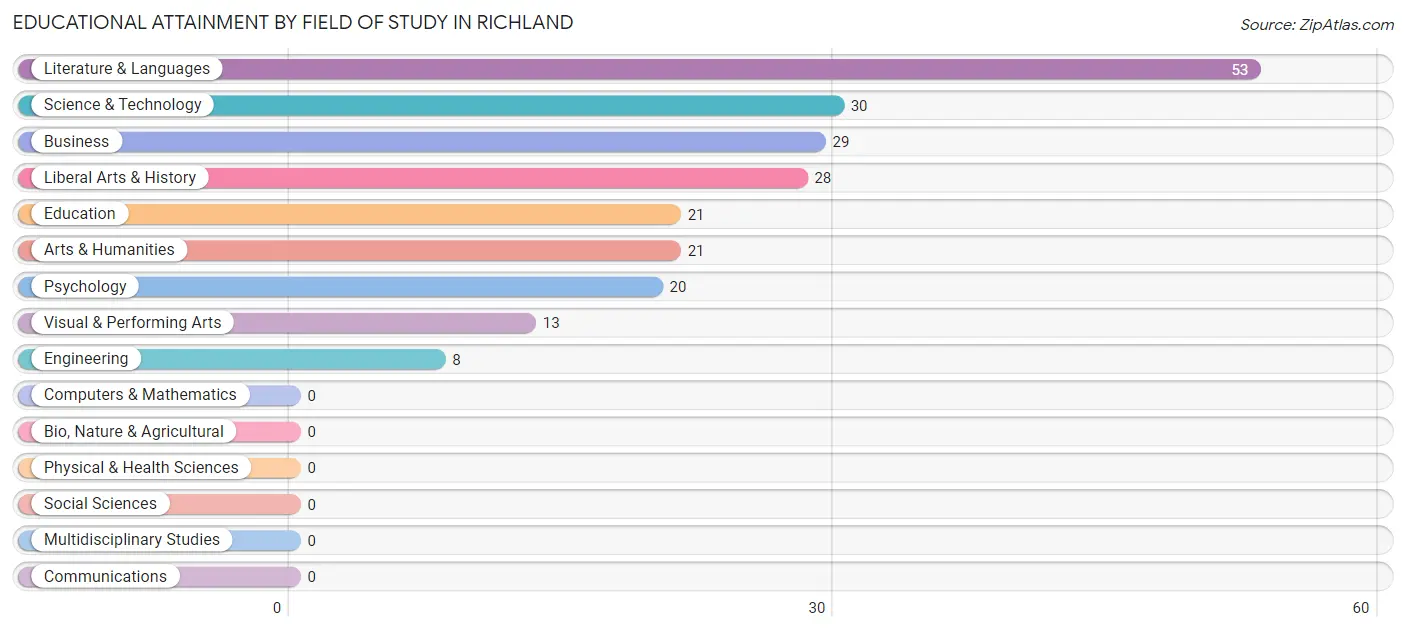
| Field of Study | # Graduates | % Graduates |
| Computers & Mathematics | 0 | 0.0% |
| Bio, Nature & Agricultural | 0 | 0.0% |
| Physical & Health Sciences | 0 | 0.0% |
| Psychology | 20 | 9.0% |
| Social Sciences | 0 | 0.0% |
| Engineering | 8 | 3.6% |
| Multidisciplinary Studies | 0 | 0.0% |
| Science & Technology | 30 | 13.5% |
| Business | 29 | 13.0% |
| Education | 21 | 9.4% |
| Literature & Languages | 53 | 23.8% |
| Liberal Arts & History | 28 | 12.6% |
| Visual & Performing Arts | 13 | 5.8% |
| Communications | 0 | 0.0% |
| Arts & Humanities | 21 | 9.4% |
| Total | 223 | 100.0% |
Transportation & Commute in Richland
Vehicle Availability by Sex in Richland
The most prevalent vehicle ownership categories in Richland are males with 2 vehicles (252, accounting for 47.5%) and females with 2 vehicles (86, making up 81.0%).
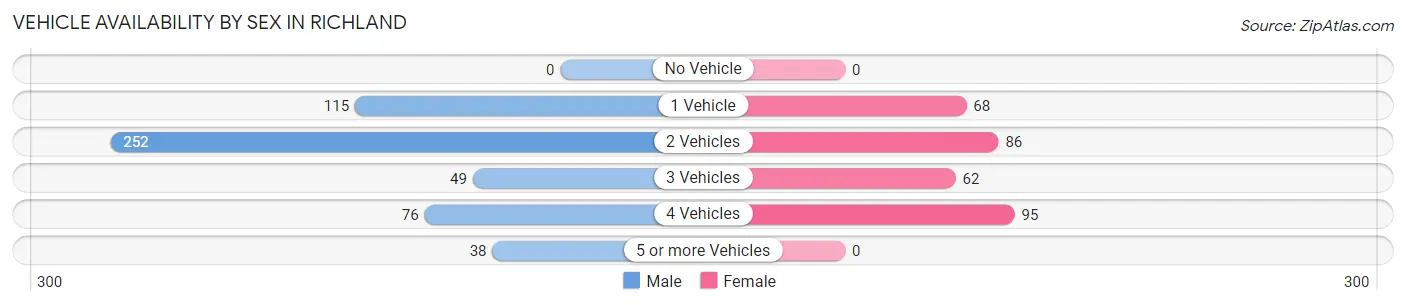
| Vehicles Available | Male | Female |
| No Vehicle | 0 (0.0%) | 0 (0.0%) |
| 1 Vehicle | 115 (21.7%) | 68 (21.9%) |
| 2 Vehicles | 252 (47.5%) | 86 (27.7%) |
| 3 Vehicles | 49 (9.2%) | 62 (19.9%) |
| 4 Vehicles | 76 (14.3%) | 95 (30.5%) |
| 5 or more Vehicles | 38 (7.2%) | 0 (0.0%) |
| Total | 530 (100.0%) | 311 (100.0%) |
Commute Time in Richland
The most frequently occuring commute durations in Richland are 30 to 34 minutes (177 commuters, 21.6%), 45 to 59 minutes (110 commuters, 13.4%), and 20 to 24 minutes (105 commuters, 12.8%).
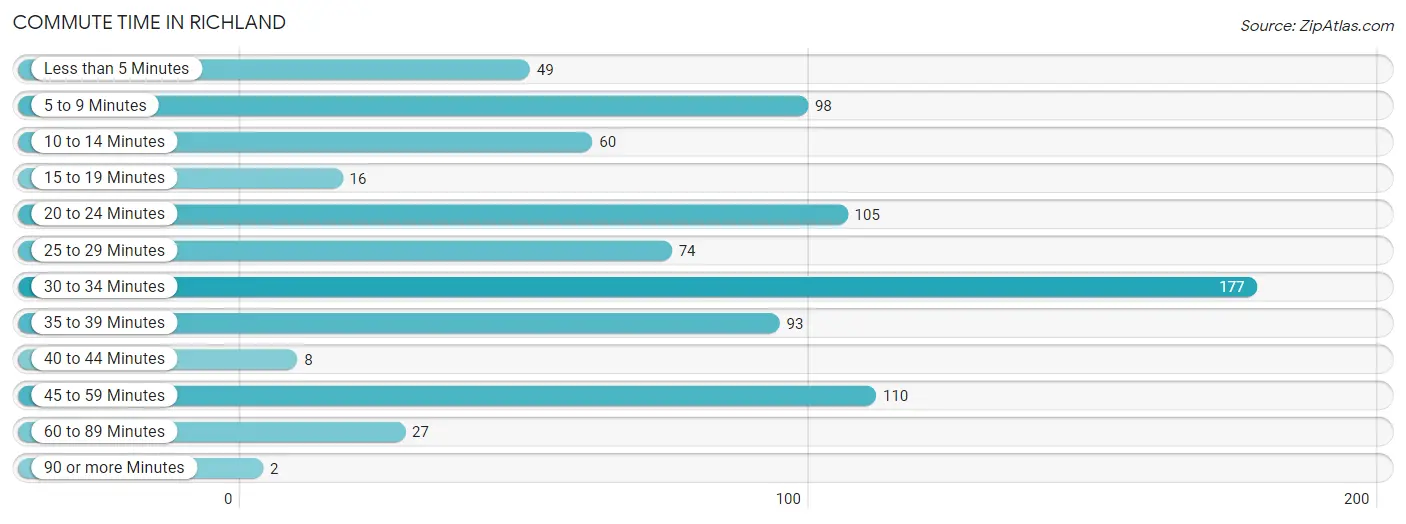
| Commute Time | # Commuters | % Commuters |
| Less than 5 Minutes | 49 | 6.0% |
| 5 to 9 Minutes | 98 | 12.0% |
| 10 to 14 Minutes | 60 | 7.3% |
| 15 to 19 Minutes | 16 | 1.9% |
| 20 to 24 Minutes | 105 | 12.8% |
| 25 to 29 Minutes | 74 | 9.0% |
| 30 to 34 Minutes | 177 | 21.6% |
| 35 to 39 Minutes | 93 | 11.4% |
| 40 to 44 Minutes | 8 | 1.0% |
| 45 to 59 Minutes | 110 | 13.4% |
| 60 to 89 Minutes | 27 | 3.3% |
| 90 or more Minutes | 2 | 0.2% |
Commute Time by Sex in Richland
The most common commute times in Richland are 30 to 34 minutes (170 commuters, 32.6%) for males and 45 to 59 minutes (89 commuters, 29.9%) for females.
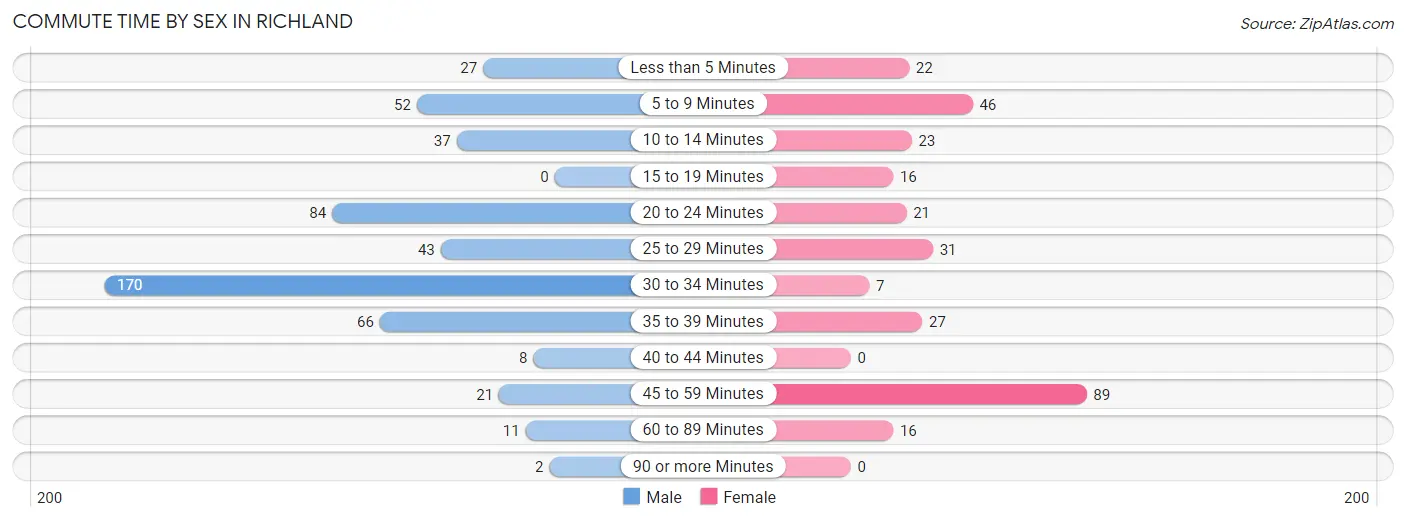
| Commute Time | Male | Female |
| Less than 5 Minutes | 27 (5.2%) | 22 (7.4%) |
| 5 to 9 Minutes | 52 (10.0%) | 46 (15.4%) |
| 10 to 14 Minutes | 37 (7.1%) | 23 (7.7%) |
| 15 to 19 Minutes | 0 (0.0%) | 16 (5.4%) |
| 20 to 24 Minutes | 84 (16.1%) | 21 (7.0%) |
| 25 to 29 Minutes | 43 (8.3%) | 31 (10.4%) |
| 30 to 34 Minutes | 170 (32.6%) | 7 (2.4%) |
| 35 to 39 Minutes | 66 (12.7%) | 27 (9.1%) |
| 40 to 44 Minutes | 8 (1.5%) | 0 (0.0%) |
| 45 to 59 Minutes | 21 (4.0%) | 89 (29.9%) |
| 60 to 89 Minutes | 11 (2.1%) | 16 (5.4%) |
| 90 or more Minutes | 2 (0.4%) | 0 (0.0%) |
Time of Departure to Work by Sex in Richland
The most frequent times of departure to work in Richland are 6:30 AM to 6:59 AM (101, 19.4%) for males and 6:30 AM to 6:59 AM (66, 22.2%) for females.
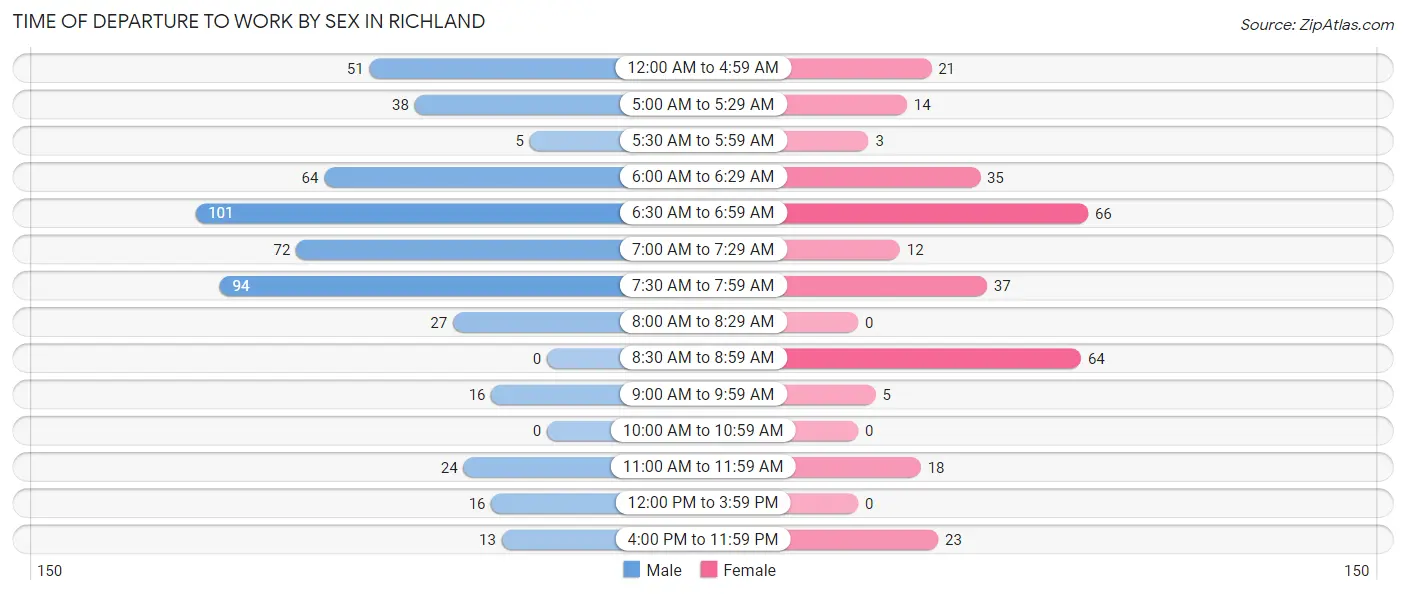
| Time of Departure | Male | Female |
| 12:00 AM to 4:59 AM | 51 (9.8%) | 21 (7.0%) |
| 5:00 AM to 5:29 AM | 38 (7.3%) | 14 (4.7%) |
| 5:30 AM to 5:59 AM | 5 (1.0%) | 3 (1.0%) |
| 6:00 AM to 6:29 AM | 64 (12.3%) | 35 (11.7%) |
| 6:30 AM to 6:59 AM | 101 (19.4%) | 66 (22.2%) |
| 7:00 AM to 7:29 AM | 72 (13.8%) | 12 (4.0%) |
| 7:30 AM to 7:59 AM | 94 (18.0%) | 37 (12.4%) |
| 8:00 AM to 8:29 AM | 27 (5.2%) | 0 (0.0%) |
| 8:30 AM to 8:59 AM | 0 (0.0%) | 64 (21.5%) |
| 9:00 AM to 9:59 AM | 16 (3.1%) | 5 (1.7%) |
| 10:00 AM to 10:59 AM | 0 (0.0%) | 0 (0.0%) |
| 11:00 AM to 11:59 AM | 24 (4.6%) | 18 (6.0%) |
| 12:00 PM to 3:59 PM | 16 (3.1%) | 0 (0.0%) |
| 4:00 PM to 11:59 PM | 13 (2.5%) | 23 (7.7%) |
| Total | 521 (100.0%) | 298 (100.0%) |
Housing Occupancy in Richland
Occupancy by Ownership in Richland
Of the total 824 dwellings in Richland, owner-occupied units account for 592 (71.8%), while renter-occupied units make up 232 (28.2%).
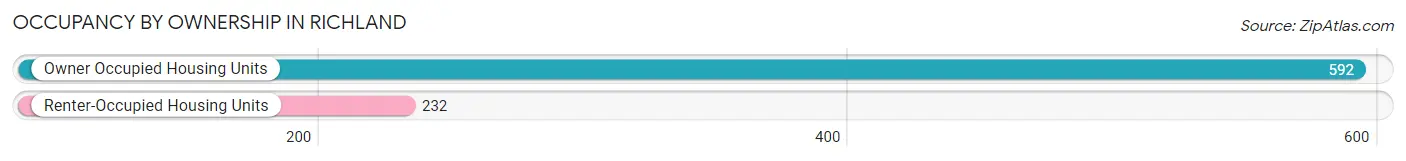
| Occupancy | # Housing Units | % Housing Units |
| Owner Occupied Housing Units | 592 | 71.8% |
| Renter-Occupied Housing Units | 232 | 28.2% |
| Total Occupied Housing Units | 824 | 100.0% |
Occupancy by Household Size in Richland
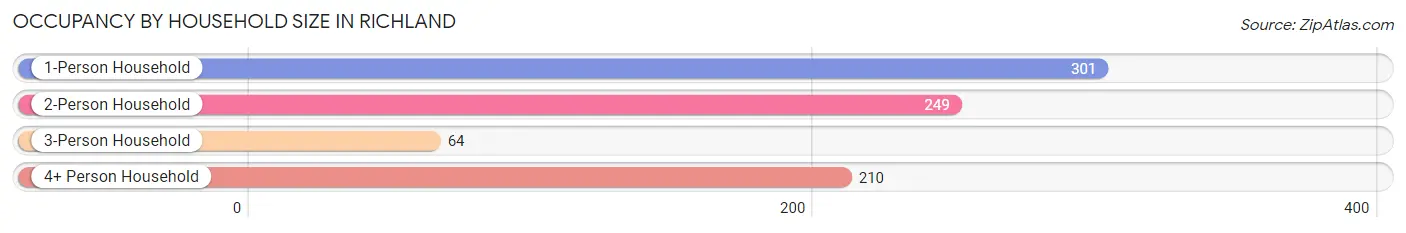
| Household Size | # Housing Units | % Housing Units |
| 1-Person Household | 301 | 36.5% |
| 2-Person Household | 249 | 30.2% |
| 3-Person Household | 64 | 7.8% |
| 4+ Person Household | 210 | 25.5% |
| Total Housing Units | 824 | 100.0% |
Occupancy by Ownership by Household Size in Richland
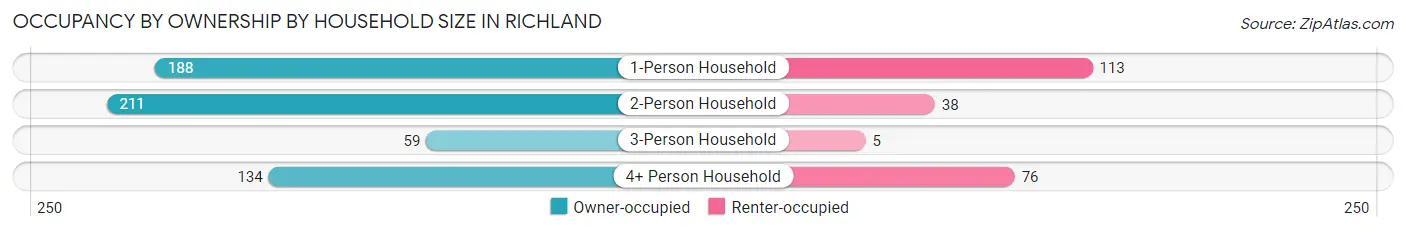
| Household Size | Owner-occupied | Renter-occupied |
| 1-Person Household | 188 (62.5%) | 113 (37.5%) |
| 2-Person Household | 211 (84.7%) | 38 (15.3%) |
| 3-Person Household | 59 (92.2%) | 5 (7.8%) |
| 4+ Person Household | 134 (63.8%) | 76 (36.2%) |
| Total Housing Units | 592 (71.8%) | 232 (28.2%) |
Occupancy by Educational Attainment in Richland
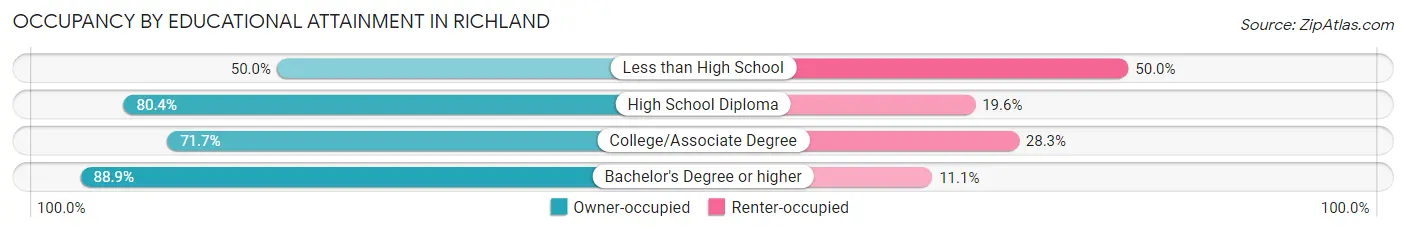
| Household Size | Owner-occupied | Renter-occupied |
| Less than High School | 95 (50.0%) | 95 (50.0%) |
| High School Diploma | 135 (80.4%) | 33 (19.6%) |
| College/Associate Degree | 218 (71.7%) | 86 (28.3%) |
| Bachelor's Degree or higher | 144 (88.9%) | 18 (11.1%) |
Occupancy by Age of Householder in Richland
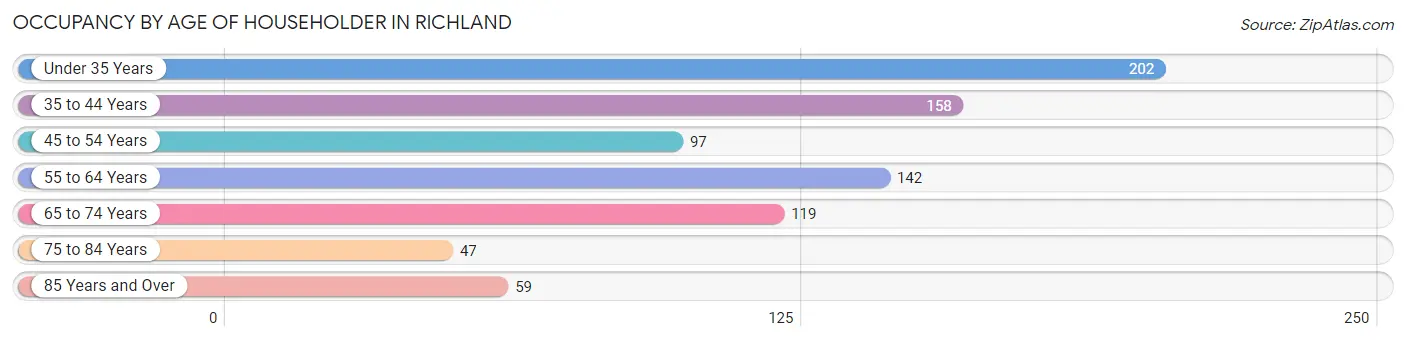
| Age Bracket | # Households | % Households |
| Under 35 Years | 202 | 24.5% |
| 35 to 44 Years | 158 | 19.2% |
| 45 to 54 Years | 97 | 11.8% |
| 55 to 64 Years | 142 | 17.2% |
| 65 to 74 Years | 119 | 14.4% |
| 75 to 84 Years | 47 | 5.7% |
| 85 Years and Over | 59 | 7.2% |
| Total | 824 | 100.0% |
Housing Finances in Richland
Median Income by Occupancy in Richland
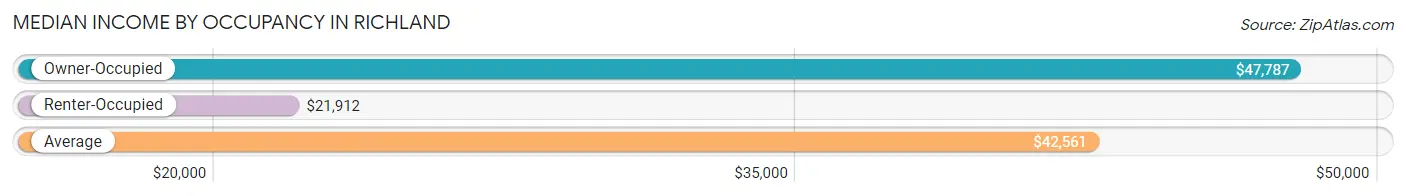
| Occupancy Type | # Households | Median Income |
| Owner-Occupied | 592 (71.8%) | $47,787 |
| Renter-Occupied | 232 (28.2%) | $21,912 |
| Average | 824 (100.0%) | $42,561 |
Occupancy by Householder Income Bracket in Richland
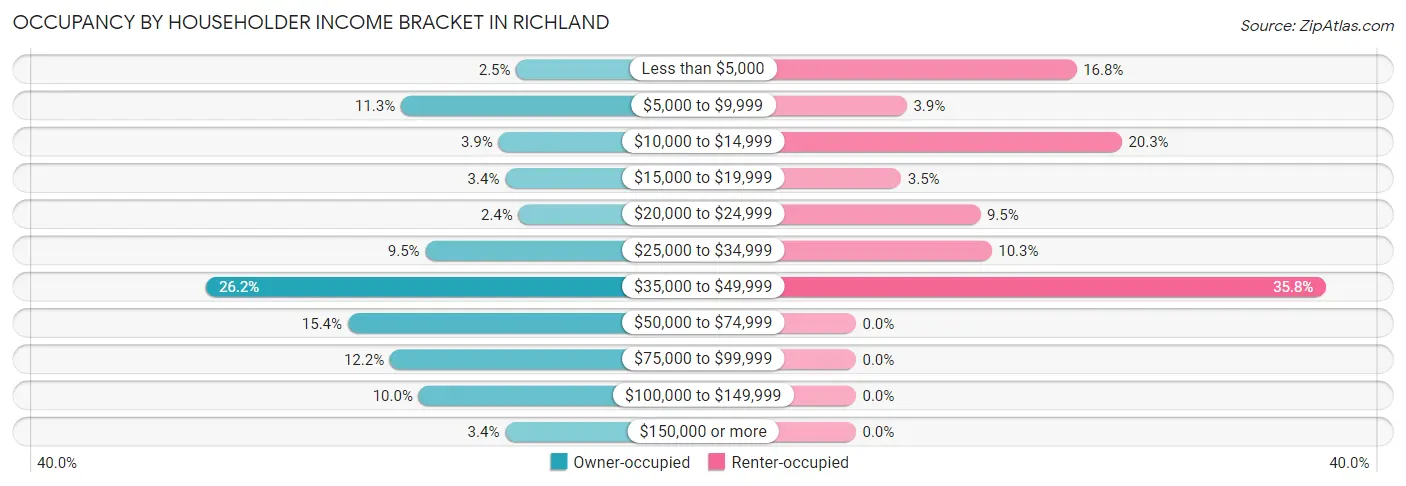
| Income Bracket | Owner-occupied | Renter-occupied |
| Less than $5,000 | 15 (2.5%) | 39 (16.8%) |
| $5,000 to $9,999 | 67 (11.3%) | 9 (3.9%) |
| $10,000 to $14,999 | 23 (3.9%) | 47 (20.3%) |
| $15,000 to $19,999 | 20 (3.4%) | 8 (3.5%) |
| $20,000 to $24,999 | 14 (2.4%) | 22 (9.5%) |
| $25,000 to $34,999 | 56 (9.5%) | 24 (10.3%) |
| $35,000 to $49,999 | 155 (26.2%) | 83 (35.8%) |
| $50,000 to $74,999 | 91 (15.4%) | 0 (0.0%) |
| $75,000 to $99,999 | 72 (12.2%) | 0 (0.0%) |
| $100,000 to $149,999 | 59 (10.0%) | 0 (0.0%) |
| $150,000 or more | 20 (3.4%) | 0 (0.0%) |
| Total | 592 (100.0%) | 232 (100.0%) |
Monthly Housing Cost Tiers in Richland
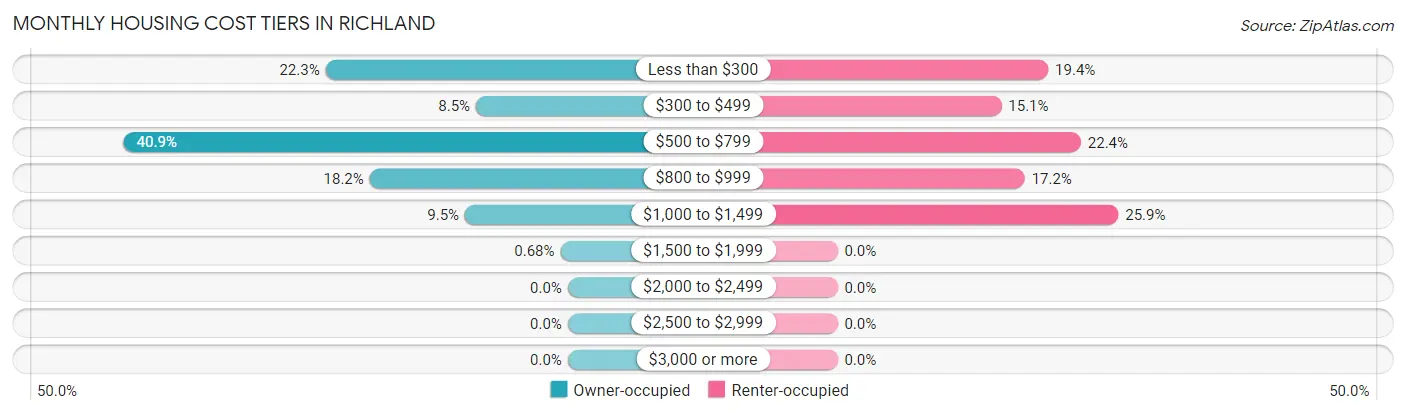
| Monthly Cost | Owner-occupied | Renter-occupied |
| Less than $300 | 132 (22.3%) | 45 (19.4%) |
| $300 to $499 | 50 (8.5%) | 35 (15.1%) |
| $500 to $799 | 242 (40.9%) | 52 (22.4%) |
| $800 to $999 | 108 (18.2%) | 40 (17.2%) |
| $1,000 to $1,499 | 56 (9.5%) | 60 (25.9%) |
| $1,500 to $1,999 | 4 (0.7%) | 0 (0.0%) |
| $2,000 to $2,499 | 0 (0.0%) | 0 (0.0%) |
| $2,500 to $2,999 | 0 (0.0%) | 0 (0.0%) |
| $3,000 or more | 0 (0.0%) | 0 (0.0%) |
| Total | 592 (100.0%) | 232 (100.0%) |
Physical Housing Characteristics in Richland
Housing Structures in Richland
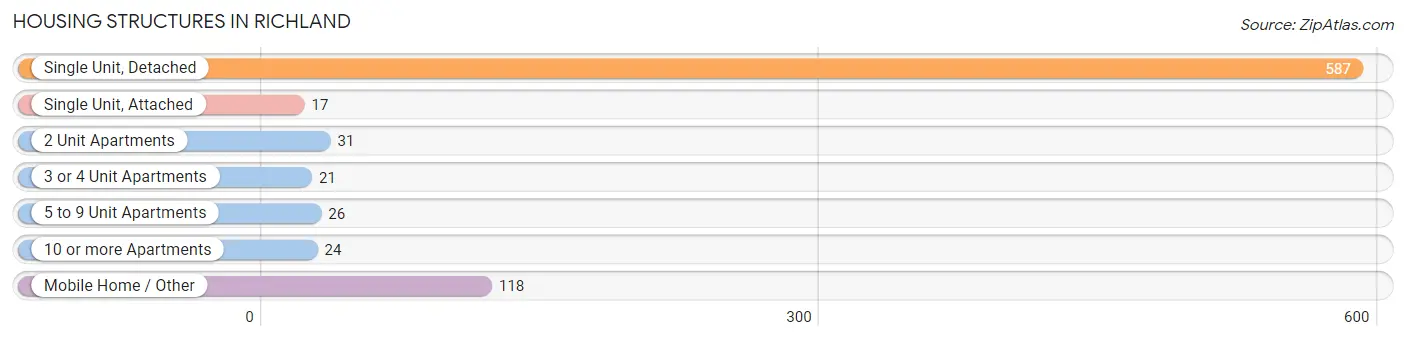
| Structure Type | # Housing Units | % Housing Units |
| Single Unit, Detached | 587 | 71.2% |
| Single Unit, Attached | 17 | 2.1% |
| 2 Unit Apartments | 31 | 3.8% |
| 3 or 4 Unit Apartments | 21 | 2.5% |
| 5 to 9 Unit Apartments | 26 | 3.2% |
| 10 or more Apartments | 24 | 2.9% |
| Mobile Home / Other | 118 | 14.3% |
| Total | 824 | 100.0% |
Housing Structures by Occupancy in Richland
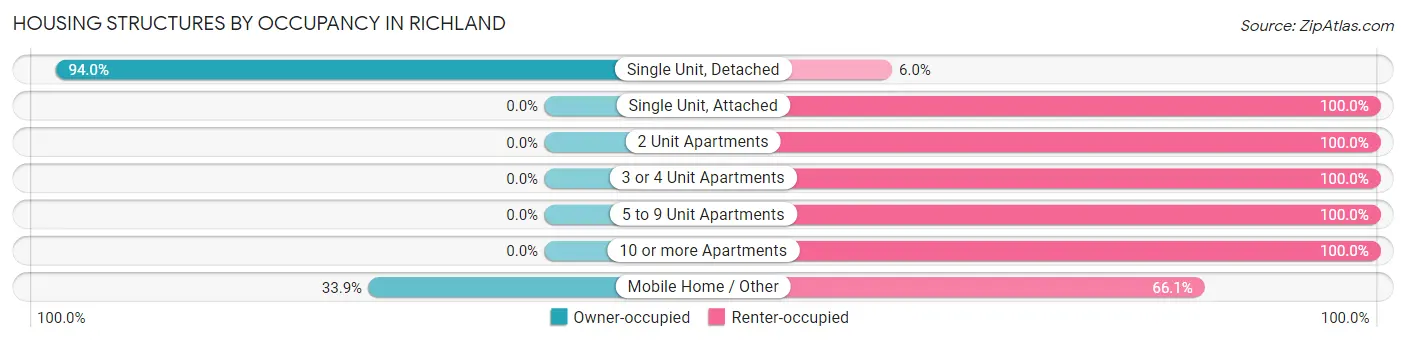
| Structure Type | Owner-occupied | Renter-occupied |
| Single Unit, Detached | 552 (94.0%) | 35 (6.0%) |
| Single Unit, Attached | 0 (0.0%) | 17 (100.0%) |
| 2 Unit Apartments | 0 (0.0%) | 31 (100.0%) |
| 3 or 4 Unit Apartments | 0 (0.0%) | 21 (100.0%) |
| 5 to 9 Unit Apartments | 0 (0.0%) | 26 (100.0%) |
| 10 or more Apartments | 0 (0.0%) | 24 (100.0%) |
| Mobile Home / Other | 40 (33.9%) | 78 (66.1%) |
| Total | 592 (71.8%) | 232 (28.2%) |
Housing Structures by Number of Rooms in Richland
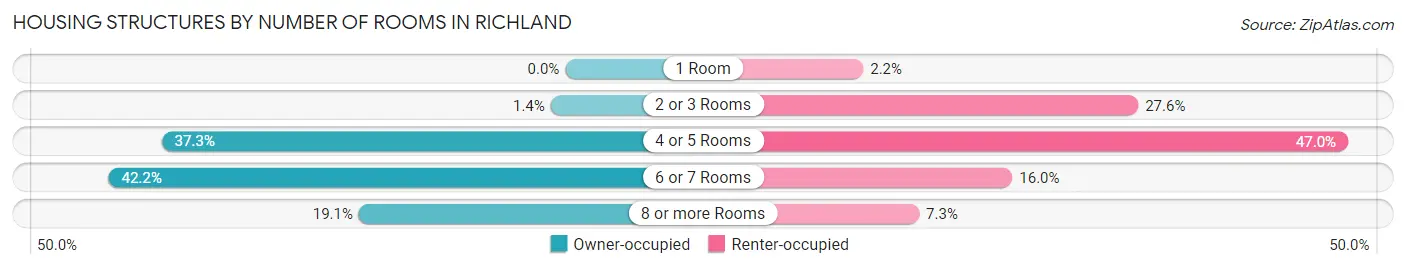
| Number of Rooms | Owner-occupied | Renter-occupied |
| 1 Room | 0 (0.0%) | 5 (2.2%) |
| 2 or 3 Rooms | 8 (1.3%) | 64 (27.6%) |
| 4 or 5 Rooms | 221 (37.3%) | 109 (47.0%) |
| 6 or 7 Rooms | 250 (42.2%) | 37 (16.0%) |
| 8 or more Rooms | 113 (19.1%) | 17 (7.3%) |
| Total | 592 (100.0%) | 232 (100.0%) |
Housing Structure by Heating Type in Richland
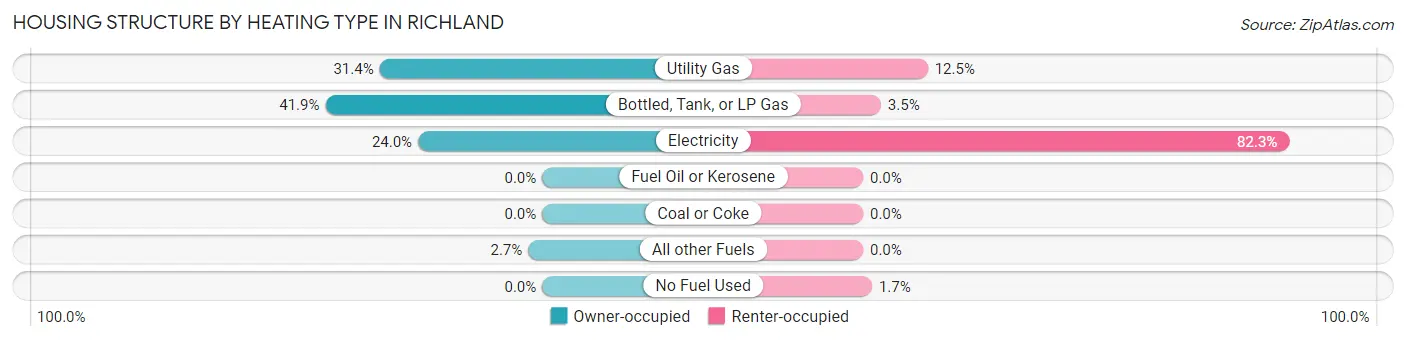
| Heating Type | Owner-occupied | Renter-occupied |
| Utility Gas | 186 (31.4%) | 29 (12.5%) |
| Bottled, Tank, or LP Gas | 248 (41.9%) | 8 (3.5%) |
| Electricity | 142 (24.0%) | 191 (82.3%) |
| Fuel Oil or Kerosene | 0 (0.0%) | 0 (0.0%) |
| Coal or Coke | 0 (0.0%) | 0 (0.0%) |
| All other Fuels | 16 (2.7%) | 0 (0.0%) |
| No Fuel Used | 0 (0.0%) | 4 (1.7%) |
| Total | 592 (100.0%) | 232 (100.0%) |
Household Vehicle Usage in Richland
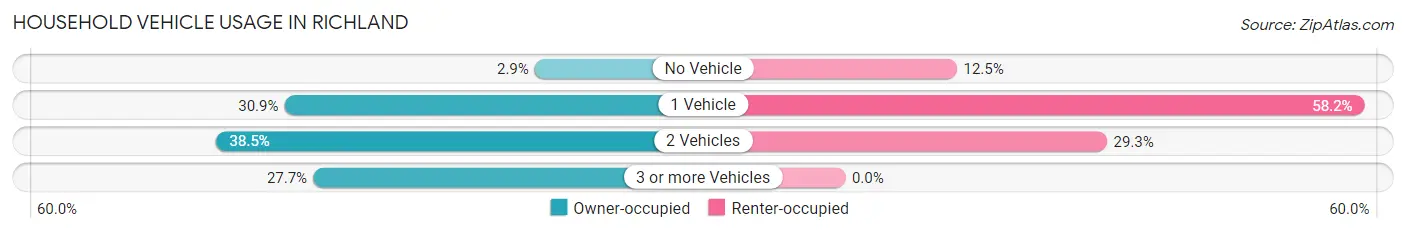
| Vehicles per Household | Owner-occupied | Renter-occupied |
| No Vehicle | 17 (2.9%) | 29 (12.5%) |
| 1 Vehicle | 183 (30.9%) | 135 (58.2%) |
| 2 Vehicles | 228 (38.5%) | 68 (29.3%) |
| 3 or more Vehicles | 164 (27.7%) | 0 (0.0%) |
| Total | 592 (100.0%) | 232 (100.0%) |
Real Estate & Mortgages in Richland
Real Estate and Mortgage Overview in Richland
| Characteristic | Without Mortgage | With Mortgage |
| Housing Units | 328 | 264 |
| Median Property Value | $73,000 | $103,300 |
| Median Household Income | $43,370 | $12 |
| Monthly Housing Costs | $433 | $0 |
| Real Estate Taxes | $357 | $29 |
Property Value by Mortgage Status in Richland
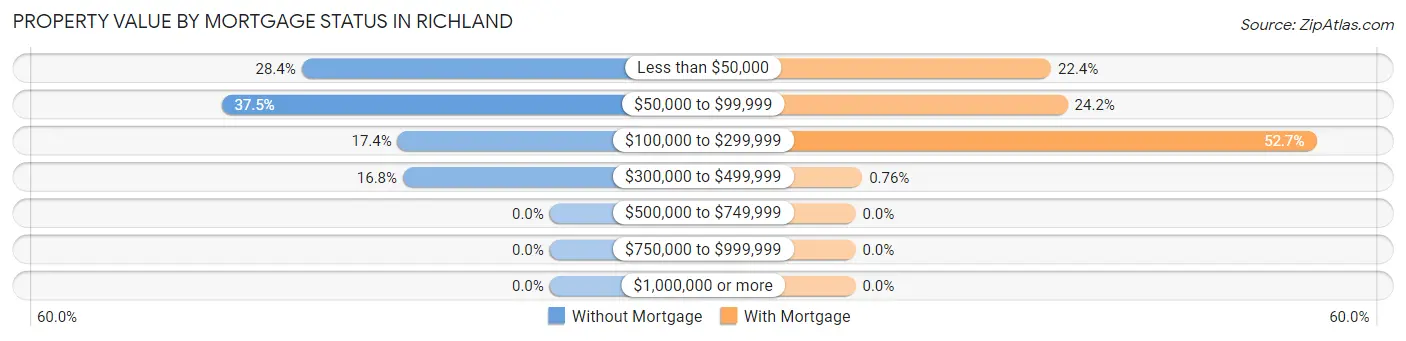
| Property Value | Without Mortgage | With Mortgage |
| Less than $50,000 | 93 (28.3%) | 59 (22.4%) |
| $50,000 to $99,999 | 123 (37.5%) | 64 (24.2%) |
| $100,000 to $299,999 | 57 (17.4%) | 139 (52.6%) |
| $300,000 to $499,999 | 55 (16.8%) | 2 (0.8%) |
| $500,000 to $749,999 | 0 (0.0%) | 0 (0.0%) |
| $750,000 to $999,999 | 0 (0.0%) | 0 (0.0%) |
| $1,000,000 or more | 0 (0.0%) | 0 (0.0%) |
| Total | 328 (100.0%) | 264 (100.0%) |
Household Income by Mortgage Status in Richland
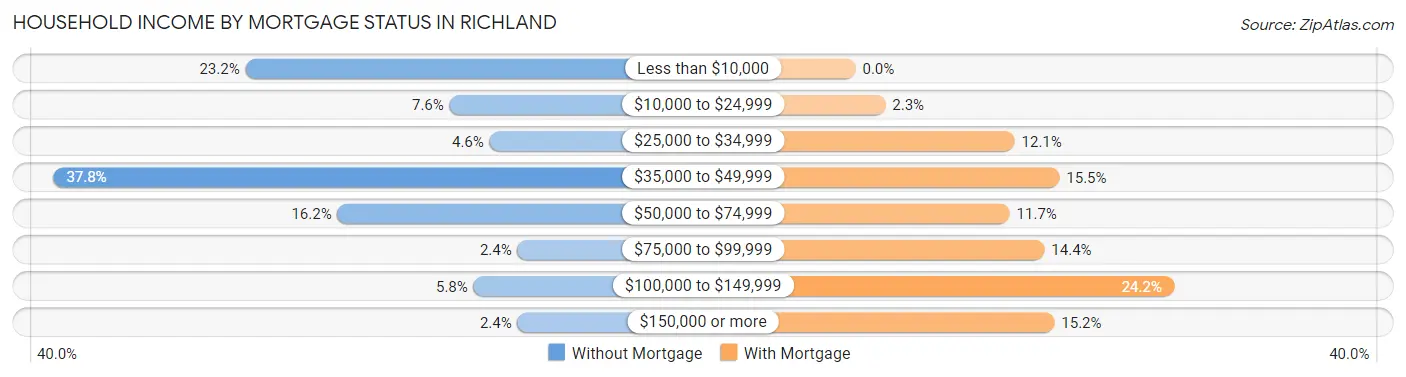
| Household Income | Without Mortgage | With Mortgage |
| Less than $10,000 | 76 (23.2%) | 0 (0.0%) |
| $10,000 to $24,999 | 25 (7.6%) | 6 (2.3%) |
| $25,000 to $34,999 | 15 (4.6%) | 32 (12.1%) |
| $35,000 to $49,999 | 124 (37.8%) | 41 (15.5%) |
| $50,000 to $74,999 | 53 (16.2%) | 31 (11.7%) |
| $75,000 to $99,999 | 8 (2.4%) | 38 (14.4%) |
| $100,000 to $149,999 | 19 (5.8%) | 64 (24.2%) |
| $150,000 or more | 8 (2.4%) | 40 (15.1%) |
| Total | 328 (100.0%) | 264 (100.0%) |
Property Value to Household Income Ratio in Richland
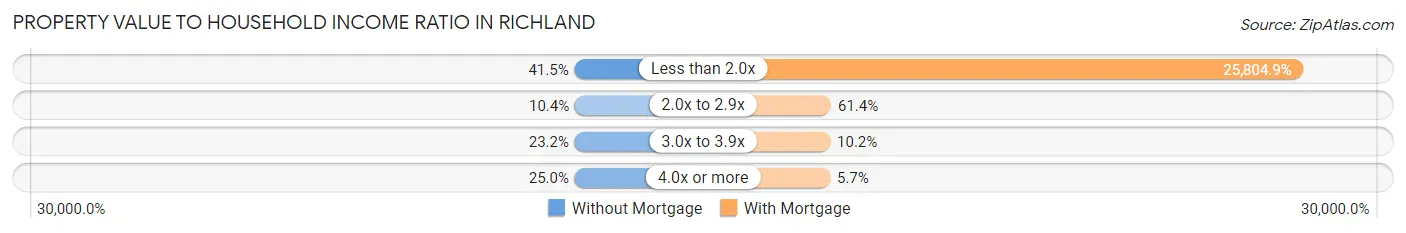
| Value-to-Income Ratio | Without Mortgage | With Mortgage |
| Less than 2.0x | 136 (41.5%) | 68,125 (25,804.9%) |
| 2.0x to 2.9x | 34 (10.4%) | 162 (61.4%) |
| 3.0x to 3.9x | 76 (23.2%) | 27 (10.2%) |
| 4.0x or more | 82 (25.0%) | 15 (5.7%) |
| Total | 328 (100.0%) | 264 (100.0%) |
Real Estate Taxes by Mortgage Status in Richland
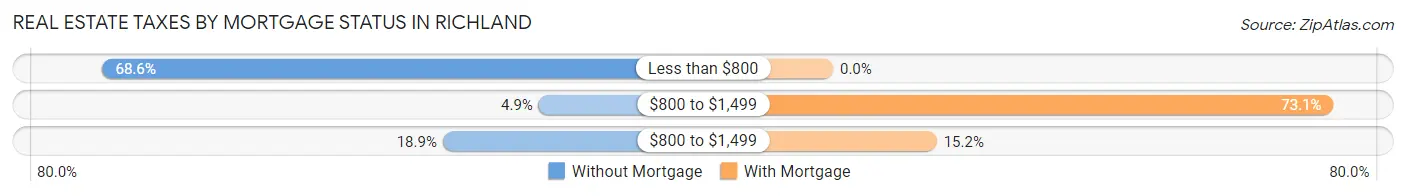
| Property Taxes | Without Mortgage | With Mortgage |
| Less than $800 | 225 (68.6%) | 0 (0.0%) |
| $800 to $1,499 | 16 (4.9%) | 193 (73.1%) |
| $800 to $1,499 | 62 (18.9%) | 40 (15.1%) |
| Total | 328 (100.0%) | 264 (100.0%) |
Health & Disability in Richland
Health Insurance Coverage by Age in Richland
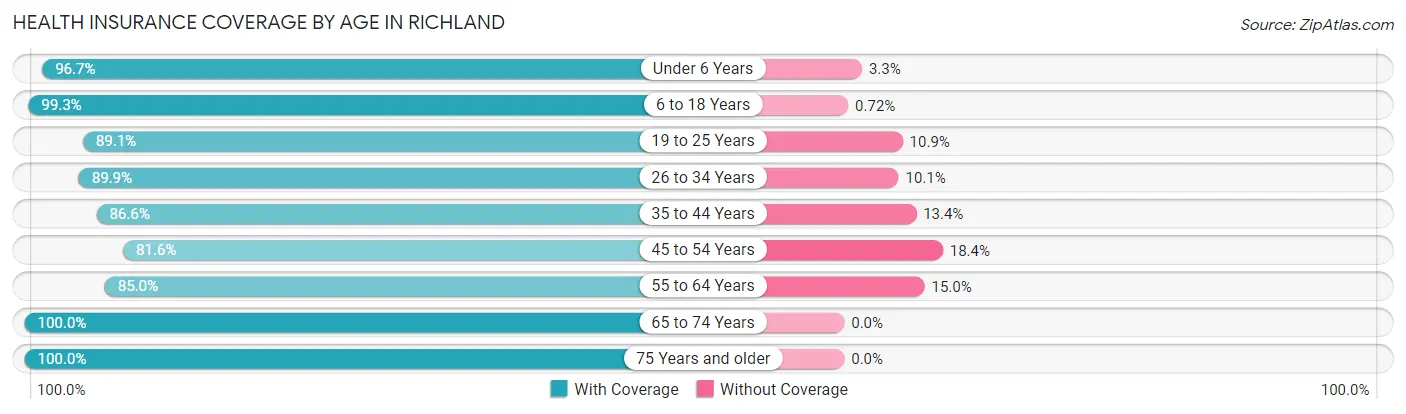
| Age Bracket | With Coverage | Without Coverage |
| Under 6 Years | 294 (96.7%) | 10 (3.3%) |
| 6 to 18 Years | 414 (99.3%) | 3 (0.7%) |
| 19 to 25 Years | 131 (89.1%) | 16 (10.9%) |
| 26 to 34 Years | 293 (89.9%) | 33 (10.1%) |
| 35 to 44 Years | 213 (86.6%) | 33 (13.4%) |
| 45 to 54 Years | 240 (81.6%) | 54 (18.4%) |
| 55 to 64 Years | 199 (85.0%) | 35 (15.0%) |
| 65 to 74 Years | 129 (100.0%) | 0 (0.0%) |
| 75 Years and older | 123 (100.0%) | 0 (0.0%) |
| Total | 2,036 (91.7%) | 184 (8.3%) |
Health Insurance Coverage by Citizenship Status in Richland
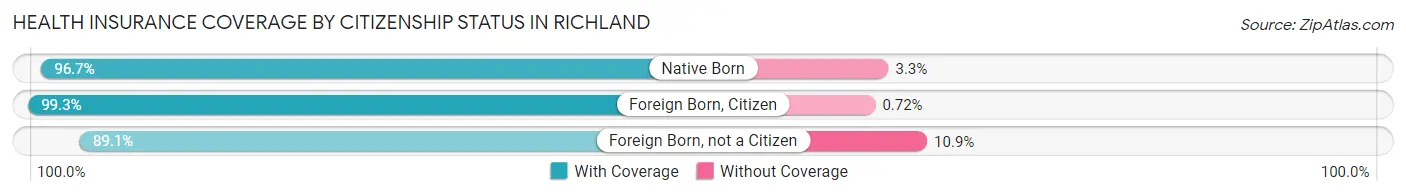
| Citizenship Status | With Coverage | Without Coverage |
| Native Born | 294 (96.7%) | 10 (3.3%) |
| Foreign Born, Citizen | 414 (99.3%) | 3 (0.7%) |
| Foreign Born, not a Citizen | 131 (89.1%) | 16 (10.9%) |
Health Insurance Coverage by Household Income in Richland
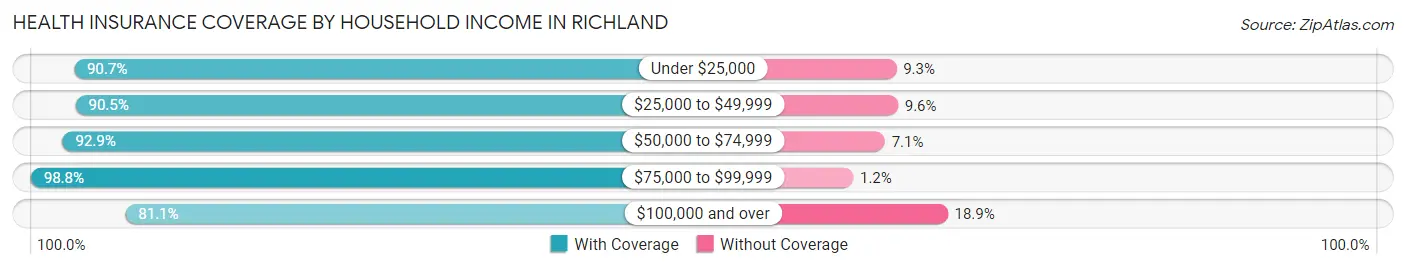
| Household Income | With Coverage | Without Coverage |
| Under $25,000 | 402 (90.7%) | 41 (9.3%) |
| $25,000 to $49,999 | 710 (90.4%) | 75 (9.6%) |
| $50,000 to $74,999 | 340 (92.9%) | 26 (7.1%) |
| $75,000 to $99,999 | 423 (98.8%) | 5 (1.2%) |
| $100,000 and over | 159 (81.1%) | 37 (18.9%) |
Public vs Private Health Insurance Coverage by Age in Richland
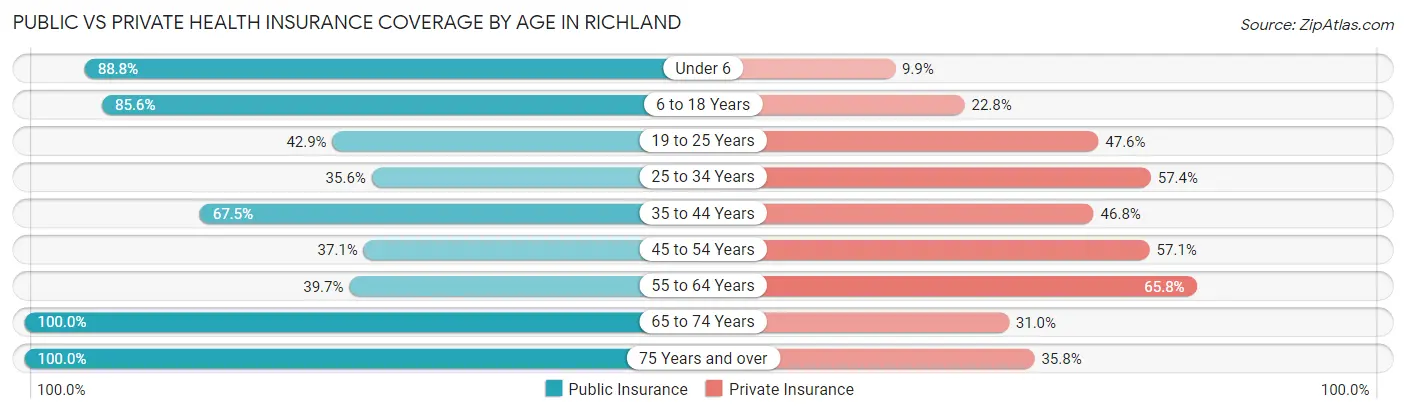
| Age Bracket | Public Insurance | Private Insurance |
| Under 6 | 270 (88.8%) | 30 (9.9%) |
| 6 to 18 Years | 357 (85.6%) | 95 (22.8%) |
| 19 to 25 Years | 63 (42.9%) | 70 (47.6%) |
| 25 to 34 Years | 116 (35.6%) | 187 (57.4%) |
| 35 to 44 Years | 166 (67.5%) | 115 (46.8%) |
| 45 to 54 Years | 109 (37.1%) | 168 (57.1%) |
| 55 to 64 Years | 93 (39.7%) | 154 (65.8%) |
| 65 to 74 Years | 129 (100.0%) | 40 (31.0%) |
| 75 Years and over | 123 (100.0%) | 44 (35.8%) |
| Total | 1,426 (64.2%) | 903 (40.7%) |
Disability Status by Sex by Age in Richland
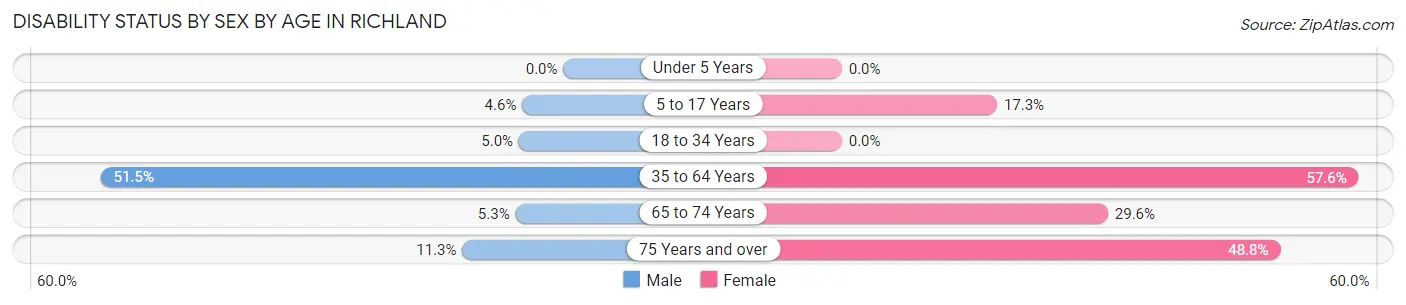
| Age Bracket | Male | Female |
| Under 5 Years | 0 (0.0%) | 0 (0.0%) |
| 5 to 17 Years | 7 (4.6%) | 42 (17.3%) |
| 18 to 34 Years | 11 (5.0%) | 0 (0.0%) |
| 35 to 64 Years | 218 (51.5%) | 202 (57.6%) |
| 65 to 74 Years | 4 (5.3%) | 16 (29.6%) |
| 75 Years and over | 9 (11.3%) | 21 (48.8%) |
Disability Class by Sex by Age in Richland
Disability Class: Hearing Difficulty
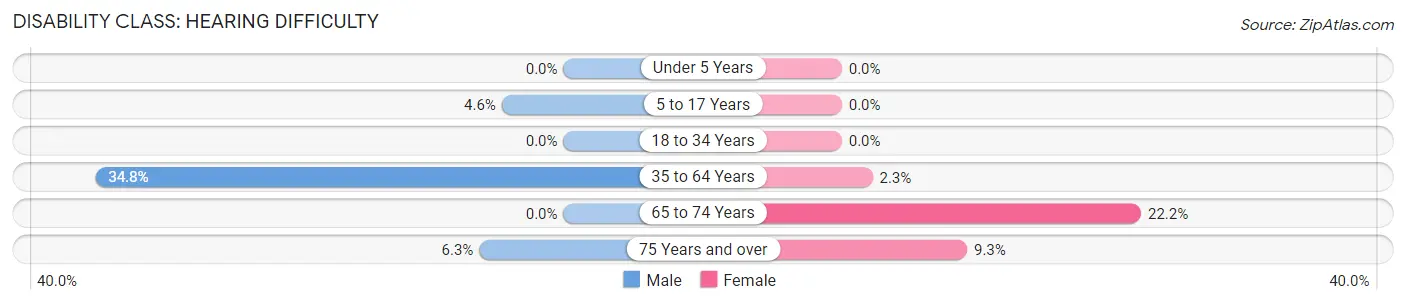
| Age Bracket | Male | Female |
| Under 5 Years | 0 (0.0%) | 0 (0.0%) |
| 5 to 17 Years | 7 (4.6%) | 0 (0.0%) |
| 18 to 34 Years | 0 (0.0%) | 0 (0.0%) |
| 35 to 64 Years | 147 (34.7%) | 8 (2.3%) |
| 65 to 74 Years | 0 (0.0%) | 12 (22.2%) |
| 75 Years and over | 5 (6.2%) | 4 (9.3%) |
Disability Class: Vision Difficulty
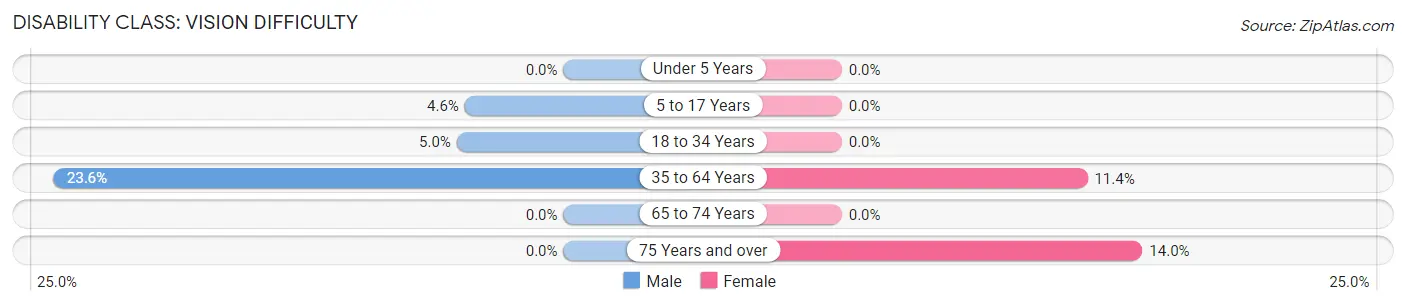
| Age Bracket | Male | Female |
| Under 5 Years | 0 (0.0%) | 0 (0.0%) |
| 5 to 17 Years | 7 (4.6%) | 0 (0.0%) |
| 18 to 34 Years | 11 (5.0%) | 0 (0.0%) |
| 35 to 64 Years | 100 (23.6%) | 40 (11.4%) |
| 65 to 74 Years | 0 (0.0%) | 0 (0.0%) |
| 75 Years and over | 0 (0.0%) | 6 (14.0%) |
Disability Class: Cognitive Difficulty
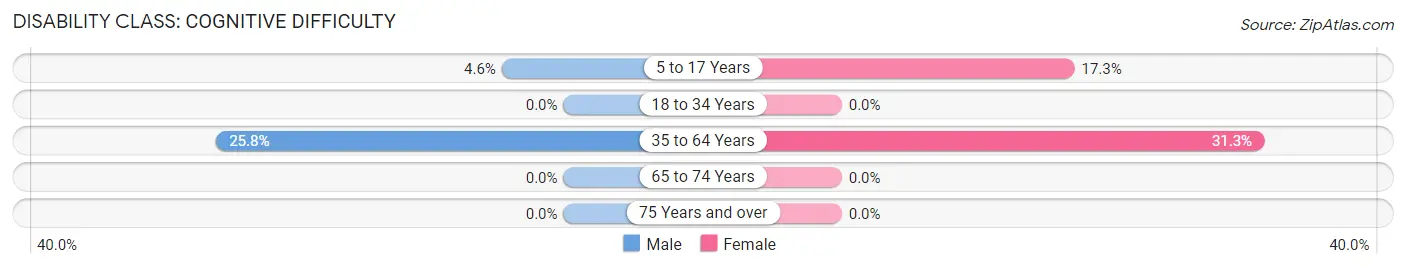
| Age Bracket | Male | Female |
| 5 to 17 Years | 7 (4.6%) | 42 (17.3%) |
| 18 to 34 Years | 0 (0.0%) | 0 (0.0%) |
| 35 to 64 Years | 109 (25.8%) | 110 (31.3%) |
| 65 to 74 Years | 0 (0.0%) | 0 (0.0%) |
| 75 Years and over | 0 (0.0%) | 0 (0.0%) |
Disability Class: Ambulatory Difficulty
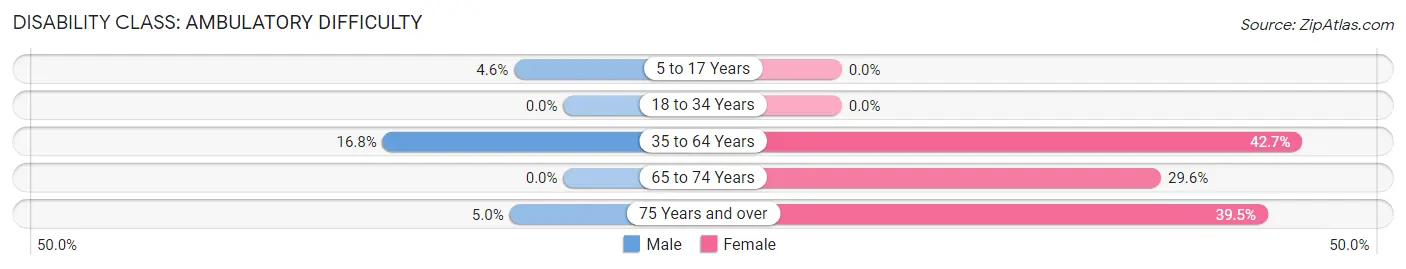
| Age Bracket | Male | Female |
| 5 to 17 Years | 7 (4.6%) | 0 (0.0%) |
| 18 to 34 Years | 0 (0.0%) | 0 (0.0%) |
| 35 to 64 Years | 71 (16.8%) | 150 (42.7%) |
| 65 to 74 Years | 0 (0.0%) | 16 (29.6%) |
| 75 Years and over | 4 (5.0%) | 17 (39.5%) |
Disability Class: Self-Care Difficulty
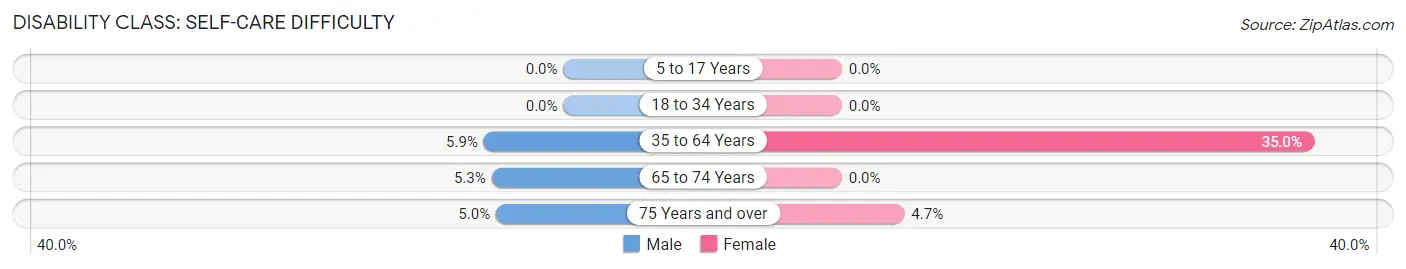
| Age Bracket | Male | Female |
| 5 to 17 Years | 0 (0.0%) | 0 (0.0%) |
| 18 to 34 Years | 0 (0.0%) | 0 (0.0%) |
| 35 to 64 Years | 25 (5.9%) | 123 (35.0%) |
| 65 to 74 Years | 4 (5.3%) | 0 (0.0%) |
| 75 Years and over | 4 (5.0%) | 2 (4.6%) |
Technology Access in Richland
Computing Device Access in Richland
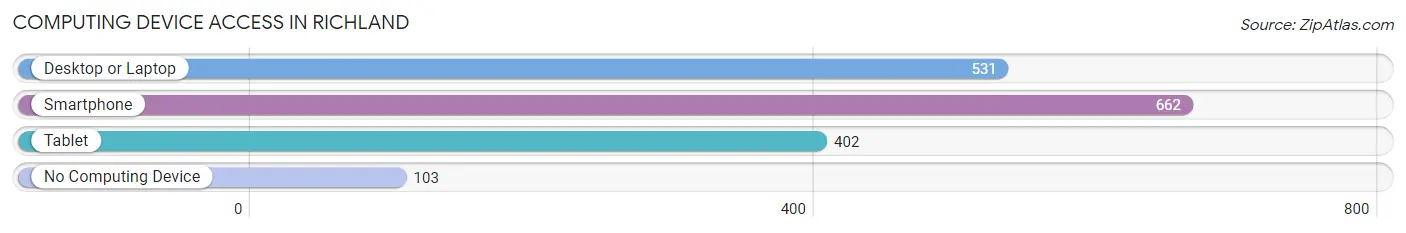
| Device Type | # Households | % Households |
| Desktop or Laptop | 531 | 64.4% |
| Smartphone | 662 | 80.3% |
| Tablet | 402 | 48.8% |
| No Computing Device | 103 | 12.5% |
| Total | 824 | 100.0% |
Internet Access in Richland
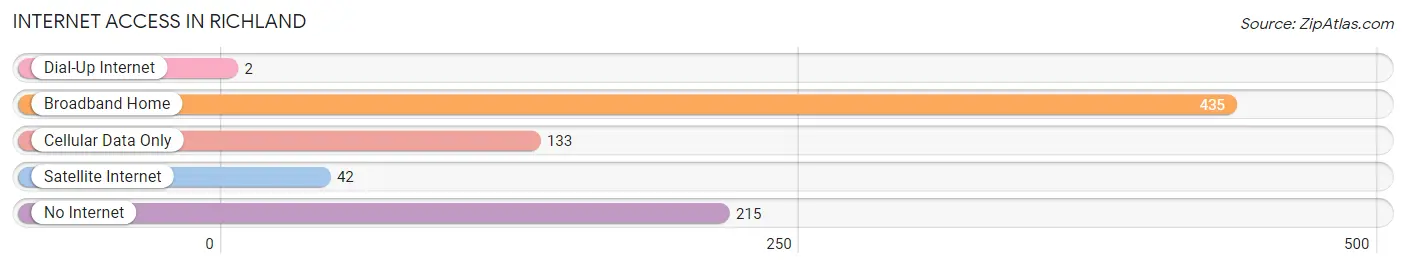
| Internet Type | # Households | % Households |
| Dial-Up Internet | 2 | 0.2% |
| Broadband Home | 435 | 52.8% |
| Cellular Data Only | 133 | 16.1% |
| Satellite Internet | 42 | 5.1% |
| No Internet | 215 | 26.1% |
| Total | 824 | 100.0% |
Richland Summary
Richland, Missouri is a small town located in the southeastern corner of the state, in Pulaski County. It is situated on the banks of the Gasconade River, and is surrounded by rolling hills and farmland. Richland is a rural community with a population of just over 1,000 people, and is known for its friendly atmosphere and small-town charm.
History
Richland was founded in 1837 by a group of settlers from Kentucky and Tennessee. The town was named after the nearby Richland Creek, which was named for its abundance of rich soil. The town was originally a farming community, and the main crops grown were corn, wheat, and oats. In the late 1800s, the town began to grow and prosper, and a number of businesses were established, including a general store, a blacksmith shop, and a sawmill.
In the early 1900s, Richland began to experience a period of growth and development. The town was incorporated in 1909, and a number of new businesses were established, including a bank, a hotel, and a newspaper. The town also saw the construction of a number of churches, schools, and other public buildings.
Geography
Richland is located in the southeastern corner of Pulaski County, in the Ozark Mountains region of Missouri. The town is situated on the banks of the Gasconade River, and is surrounded by rolling hills and farmland. The town is located approximately 30 miles south of St. Louis, and is accessible via Interstate 44.
The climate in Richland is generally mild, with hot summers and cold winters. The average annual temperature is around 55 degrees Fahrenheit, and the average annual precipitation is around 40 inches.
Economy
The economy of Richland is largely based on agriculture. The town is home to a number of farms, and the main crops grown are corn, wheat, and oats. In addition, the town is home to a number of small businesses, including a general store, a hardware store, and a restaurant.
Demographics
As of the 2010 census, the population of Richland was 1,072. The racial makeup of the town was 97.2% White, 0.7% African American, 0.3% Native American, 0.2% Asian, 0.1% Pacific Islander, and 1.5% from other races. The median household income was $37,500, and the median family income was $45,000. The per capita income was $18,000.
Richland is a small, rural community with a friendly atmosphere and a strong sense of community. The town is home to a number of churches, schools, and other public buildings, and is a great place to raise a family.
Common Questions
What is Per Capita Income in Richland?
Per Capita income in Richland is $31,824.
What is the Median Family Income in Richland?
Median Family Income in Richland is $44,071.
What is the Median Household income in Richland?
Median Household Income in Richland is $42,561.
What is Income or Wage Gap in Richland?
Income or Wage Gap in Richland is 41.1%.
Women in Richland earn 58.9 cents for every dollar earned by a man.
What is Family Income Deficit in Richland?
Family Income Deficit in Richland is $12,655.
Families that are below poverty line in Richland earn $12,655 less on average than the poverty threshold level.
What is Inequality or Gini Index in Richland?
Inequality or Gini Index in Richland is 0.67.
What is the Total Population of Richland?
Total Population of Richland is 2,307.
What is the Total Male Population of Richland?
Total Male Population of Richland is 1,214.
What is the Total Female Population of Richland?
Total Female Population of Richland is 1,093.
What is the Ratio of Males per 100 Females in Richland?
There are 111.07 Males per 100 Females in Richland.
What is the Ratio of Females per 100 Males in Richland?
There are 90.03 Females per 100 Males in Richland.
What is the Median Population Age in Richland?
Median Population Age in Richland is 32.6 Years.
What is the Average Family Size in Richland
Average Family Size in Richland is 3.6 People.
What is the Average Household Size in Richland
Average Household Size in Richland is 2.8 People.
How Large is the Labor Force in Richland?
There are 921 People in the Labor Forcein in Richland.
What is the Percentage of People in the Labor Force in Richland?
57.0% of People are in the Labor Force in Richland.
What is the Unemployment Rate in Richland?
Unemployment Rate in Richland is 6.1%.