Hayti, MO Map & Demographics
Hayti Map
Hayti Overview
$15,589
PER CAPITA INCOME
$27,583
AVG FAMILY INCOME
$22,202
AVG HOUSEHOLD INCOME
58.8%
WAGE / INCOME GAP [ % ]
41.2¢/ $1
WAGE / INCOME GAP [ $ ]
0.43
INEQUALITY / GINI INDEX
2,367
TOTAL POPULATION
1,164
MALE POPULATION
1,203
FEMALE POPULATION
96.76
MALES / 100 FEMALES
103.35
FEMALES / 100 MALES
42.7
MEDIAN AGE
3.0
AVG FAMILY SIZE
2.3
AVG HOUSEHOLD SIZE
697
LABOR FORCE [ PEOPLE ]
41.2%
PERCENT IN LABOR FORCE
12.5%
UNEMPLOYMENT RATE
Hayti Zip Codes
Hayti Area Codes
Income in Hayti
Income Overview in Hayti
Per Capita Income in Hayti is $15,589, while median incomes of families and households are $27,583 and $22,202 respectively.
| Characteristic | Number | Measure |
| Per Capita Income | 2,367 | $15,589 |
| Median Family Income | 639 | $27,583 |
| Mean Family Income | 639 | $41,181 |
| Median Household Income | 1,026 | $22,202 |
| Mean Household Income | 1,026 | $36,589 |
| Income Deficit | 639 | $0 |
| Wage / Income Gap (%) | 2,367 | 58.82% |
| Wage / Income Gap ($) | 2,367 | 41.18¢ per $1 |
| Gini / Inequality Index | 2,367 | 0.43 |
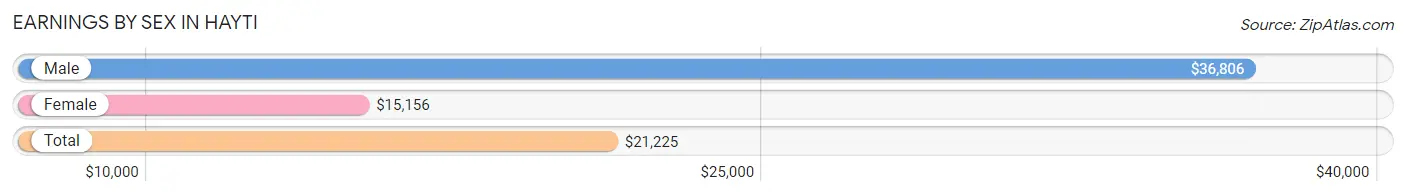
Earnings by Sex in Hayti
Average Earnings in Hayti are $21,225, $36,806 for men and $15,156 for women, a difference of 58.8%.
| Sex | Number | Average Earnings |
| Male | 281 (37.4%) | $36,806 |
| Female | 470 (62.6%) | $15,156 |
| Total | 751 (100.0%) | $21,225 |
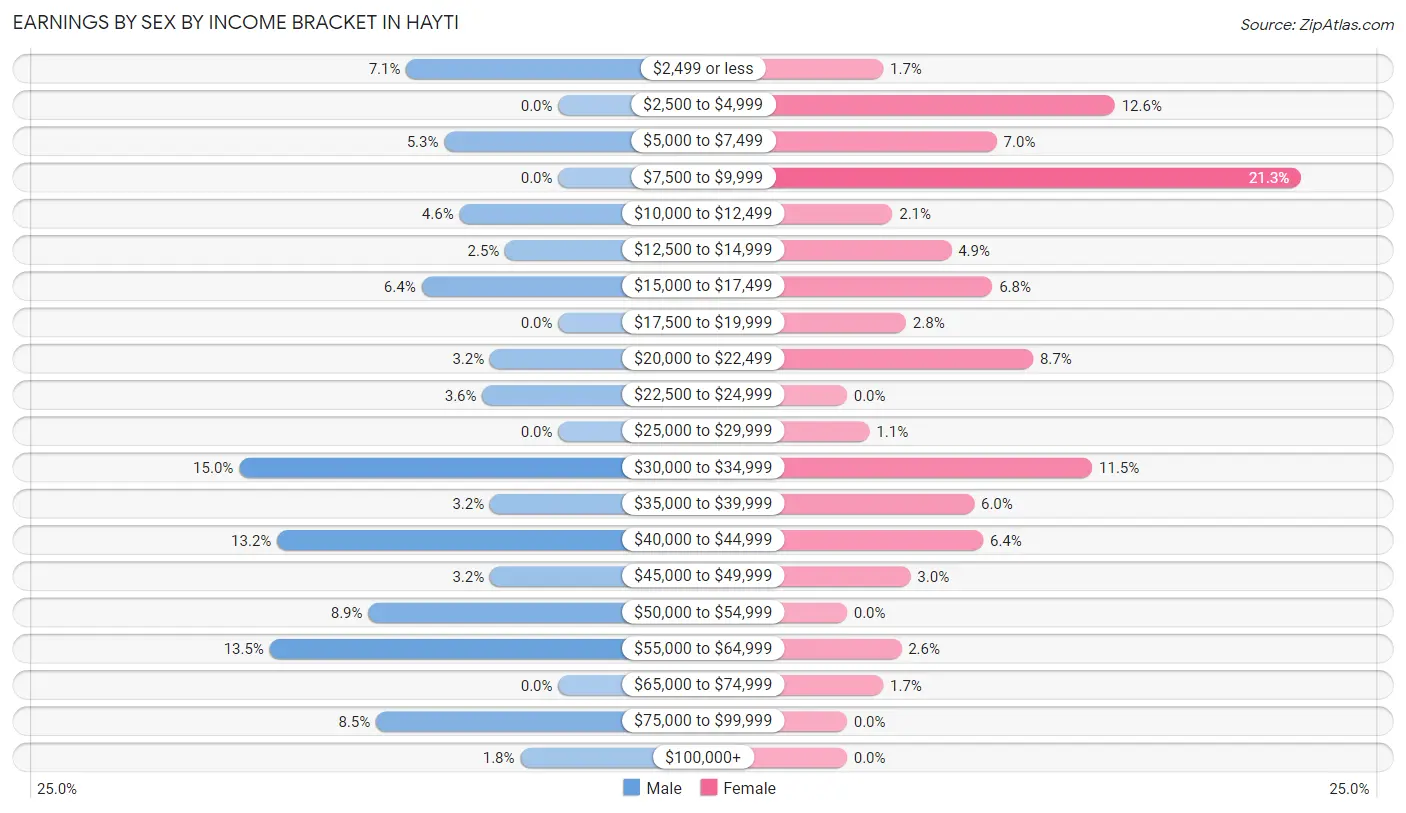
Earnings by Sex by Income Bracket in Hayti
The most common earnings brackets in Hayti are $30,000 to $34,999 for men (42 | 14.9%) and $7,500 to $9,999 for women (100 | 21.3%).
| Income | Male | Female |
| $2,499 or less | 20 (7.1%) | 8 (1.7%) |
| $2,500 to $4,999 | 0 (0.0%) | 59 (12.6%) |
| $5,000 to $7,499 | 15 (5.3%) | 33 (7.0%) |
| $7,500 to $9,999 | 0 (0.0%) | 100 (21.3%) |
| $10,000 to $12,499 | 13 (4.6%) | 10 (2.1%) |
| $12,500 to $14,999 | 7 (2.5%) | 23 (4.9%) |
| $15,000 to $17,499 | 18 (6.4%) | 32 (6.8%) |
| $17,500 to $19,999 | 0 (0.0%) | 13 (2.8%) |
| $20,000 to $22,499 | 9 (3.2%) | 41 (8.7%) |
| $22,500 to $24,999 | 10 (3.6%) | 0 (0.0%) |
| $25,000 to $29,999 | 0 (0.0%) | 5 (1.1%) |
| $30,000 to $34,999 | 42 (14.9%) | 54 (11.5%) |
| $35,000 to $39,999 | 9 (3.2%) | 28 (6.0%) |
| $40,000 to $44,999 | 37 (13.2%) | 30 (6.4%) |
| $45,000 to $49,999 | 9 (3.2%) | 14 (3.0%) |
| $50,000 to $54,999 | 25 (8.9%) | 0 (0.0%) |
| $55,000 to $64,999 | 38 (13.5%) | 12 (2.5%) |
| $65,000 to $74,999 | 0 (0.0%) | 8 (1.7%) |
| $75,000 to $99,999 | 24 (8.5%) | 0 (0.0%) |
| $100,000+ | 5 (1.8%) | 0 (0.0%) |
| Total | 281 (100.0%) | 470 (100.0%) |
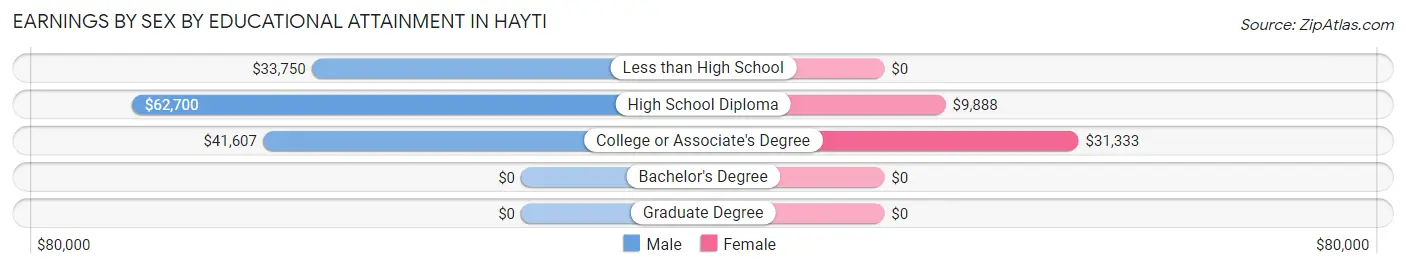
Earnings by Sex by Educational Attainment in Hayti
Average earnings in Hayti are $40,811 for men and $15,391 for women, a difference of 62.3%. Men with an educational attainment of high school diploma enjoy the highest average annual earnings of $62,700, while those with less than high school education earn the least with $33,750. Women with an educational attainment of college or associate's degree earn the most with the average annual earnings of $31,333, while those with high school diploma education have the smallest earnings of $9,888.
| Educational Attainment | Male Income | Female Income |
| Less than High School | $33,750 | $0 |
| High School Diploma | $62,700 | $9,888 |
| College or Associate's Degree | $41,607 | $31,333 |
| Bachelor's Degree | - | - |
| Graduate Degree | - | - |
| Total | $40,811 | $15,391 |
Family Income in Hayti
Family Income Brackets in Hayti
According to the Hayti family income data, there are 186 families falling into the $15,000 to $24,999 income range, which is the most common income bracket and makes up 29.1% of all families.
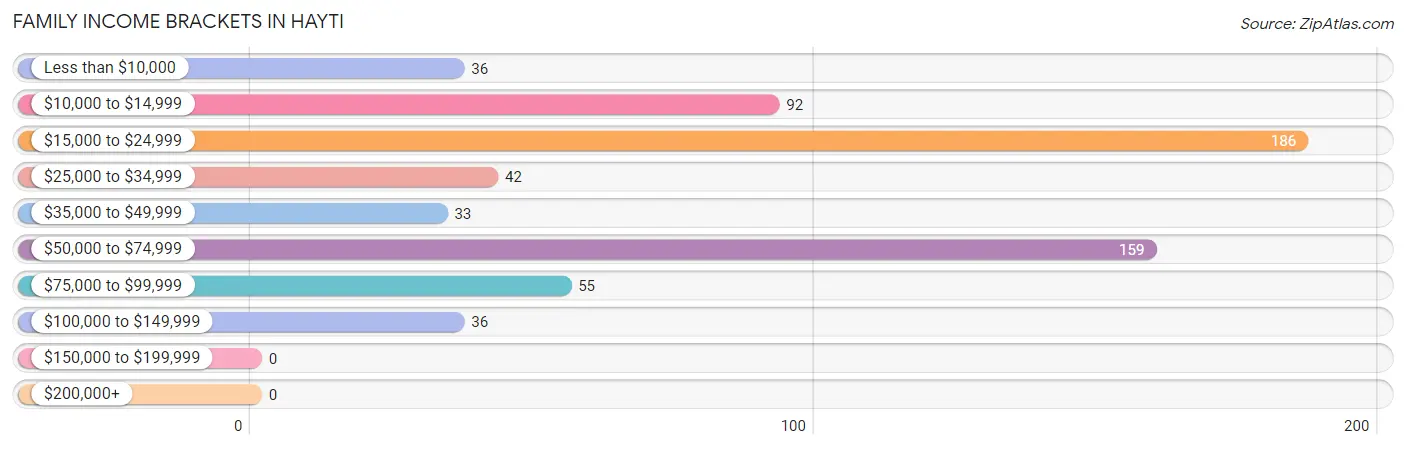
| Income Bracket | # Families | % Families |
| Less than $10,000 | 36 | 5.6% |
| $10,000 to $14,999 | 92 | 14.4% |
| $15,000 to $24,999 | 186 | 29.1% |
| $25,000 to $34,999 | 42 | 6.6% |
| $35,000 to $49,999 | 33 | 5.2% |
| $50,000 to $74,999 | 159 | 24.9% |
| $75,000 to $99,999 | 55 | 8.6% |
| $100,000 to $149,999 | 36 | 5.6% |
| $150,000 to $199,999 | 0 | 0.0% |
| $200,000+ | 0 | 0.0% |
Family Income by Famaliy Size in Hayti
5-person families (108 | 16.9%) account for the highest median family income in Hayti with $33,750 per family, while 5-person families (108 | 16.9%) have the highest median income of $6,750 per family member.
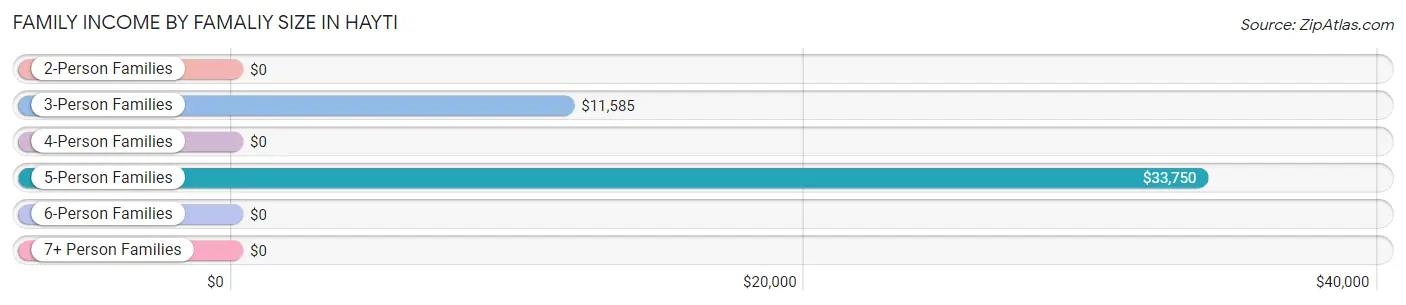
| Income Bracket | # Families | Median Income |
| 2-Person Families | 343 (53.7%) | $0 |
| 3-Person Families | 143 (22.4%) | $11,585 |
| 4-Person Families | 45 (7.0%) | $0 |
| 5-Person Families | 108 (16.9%) | $33,750 |
| 6-Person Families | 0 (0.0%) | $0 |
| 7+ Person Families | 0 (0.0%) | $0 |
| Total | 639 (100.0%) | $27,583 |
Family Income by Number of Earners in Hayti
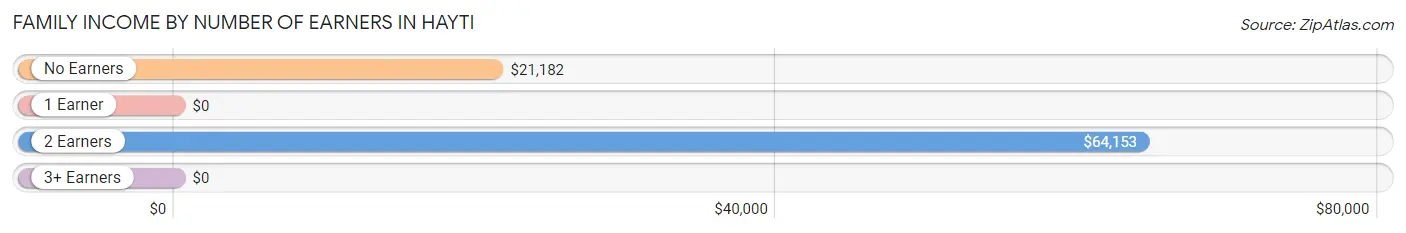
| Number of Earners | # Families | Median Income |
| No Earners | 225 (35.2%) | $21,182 |
| 1 Earner | 261 (40.8%) | $0 |
| 2 Earners | 136 (21.3%) | $64,153 |
| 3+ Earners | 17 (2.7%) | $0 |
| Total | 639 (100.0%) | $27,583 |
Household Income in Hayti
Household Income Brackets in Hayti
With 305 households falling in the category, the $15,000 to $24,999 income range is the most frequent in Hayti, accounting for 29.7% of all households.
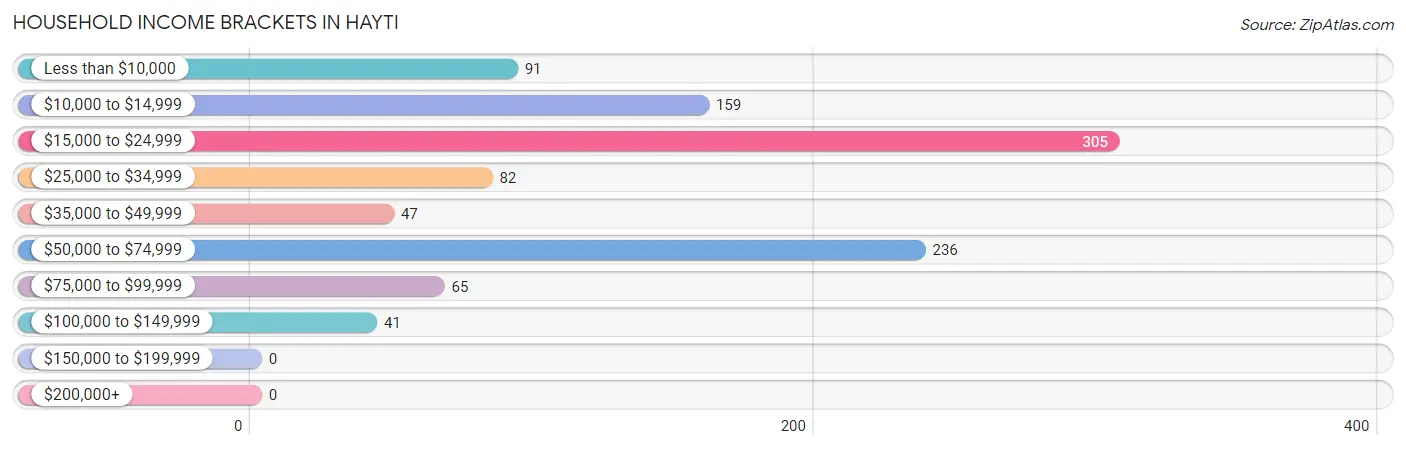
| Income Bracket | # Households | % Households |
| Less than $10,000 | 91 | 8.9% |
| $10,000 to $14,999 | 159 | 15.5% |
| $15,000 to $24,999 | 305 | 29.7% |
| $25,000 to $34,999 | 82 | 8.0% |
| $35,000 to $49,999 | 47 | 4.6% |
| $50,000 to $74,999 | 236 | 23.0% |
| $75,000 to $99,999 | 65 | 6.3% |
| $100,000 to $149,999 | 41 | 4.0% |
| $150,000 to $199,999 | 0 | 0.0% |
| $200,000+ | 0 | 0.0% |
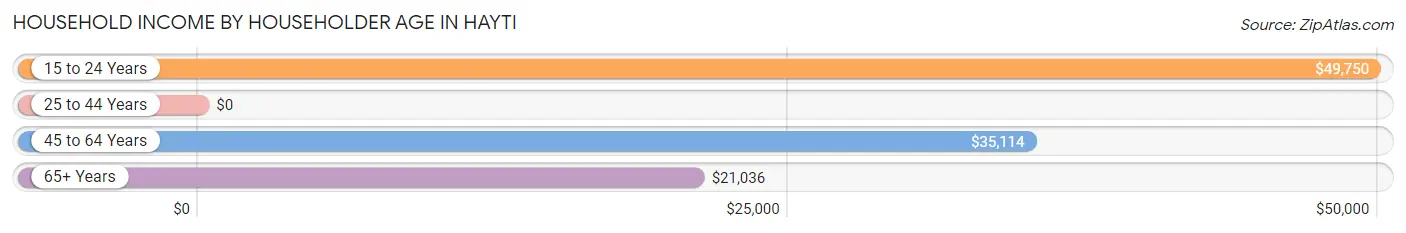
Household Income by Householder Age in Hayti
The median household income in Hayti is $22,202, with the highest median household income of $49,750 found in the 15 to 24 years age bracket for the primary householder. A total of 15 households (1.5%) fall into this category. Meanwhile, the 25 to 44 years age bracket for the primary householder has the lowest median household income of $0, with 335 households (32.7%) in this group.
| Income Bracket | # Households | Median Income |
| 15 to 24 Years | 15 (1.5%) | $49,750 |
| 25 to 44 Years | 335 (32.7%) | $0 |
| 45 to 64 Years | 382 (37.2%) | $35,114 |
| 65+ Years | 294 (28.6%) | $21,036 |
| Total | 1,026 (100.0%) | $22,202 |
Poverty in Hayti
Income Below Poverty by Sex and Age in Hayti
With 39.0% poverty level for males and 54.6% for females among the residents of Hayti, 45 to 54 year old males and 5 year old females are the most vulnerable to poverty, with 62 males (73.8%) and 25 females (100.0%) in their respective age groups living below the poverty level.
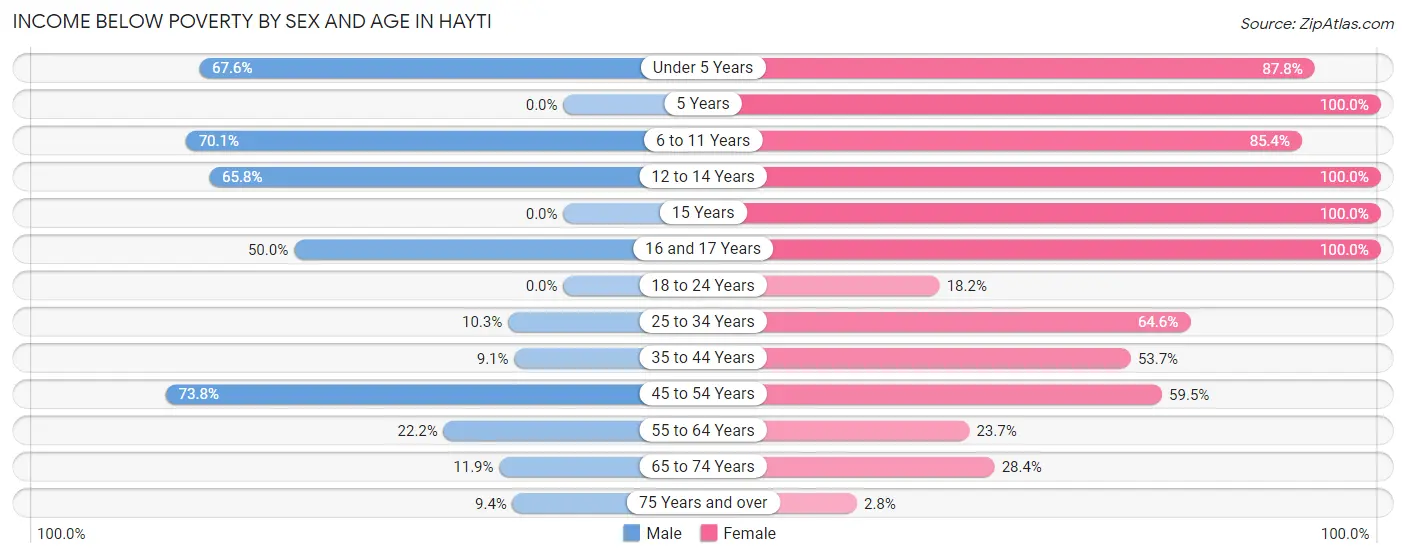
| Age Bracket | Male | Female |
| Under 5 Years | 48 (67.6%) | 129 (87.8%) |
| 5 Years | 0 (0.0%) | 25 (100.0%) |
| 6 to 11 Years | 150 (70.1%) | 105 (85.4%) |
| 12 to 14 Years | 48 (65.7%) | 14 (100.0%) |
| 15 Years | 0 (0.0%) | 9 (100.0%) |
| 16 and 17 Years | 58 (50.0%) | 17 (100.0%) |
| 18 to 24 Years | 0 (0.0%) | 4 (18.2%) |
| 25 to 34 Years | 4 (10.3%) | 95 (64.6%) |
| 35 to 44 Years | 9 (9.1%) | 95 (53.7%) |
| 45 to 54 Years | 62 (73.8%) | 88 (59.5%) |
| 55 to 64 Years | 52 (22.2%) | 41 (23.7%) |
| 65 to 74 Years | 12 (11.9%) | 21 (28.4%) |
| 75 Years and over | 8 (9.4%) | 3 (2.8%) |
| Total | 451 (39.0%) | 646 (54.6%) |
Income Above Poverty by Sex and Age in Hayti
According to the poverty statistics in Hayti, males aged 18 to 24 years and females aged 75 years and over are the age groups that are most secure financially, with 100.0% of males and 97.2% of females in these age groups living above the poverty line.
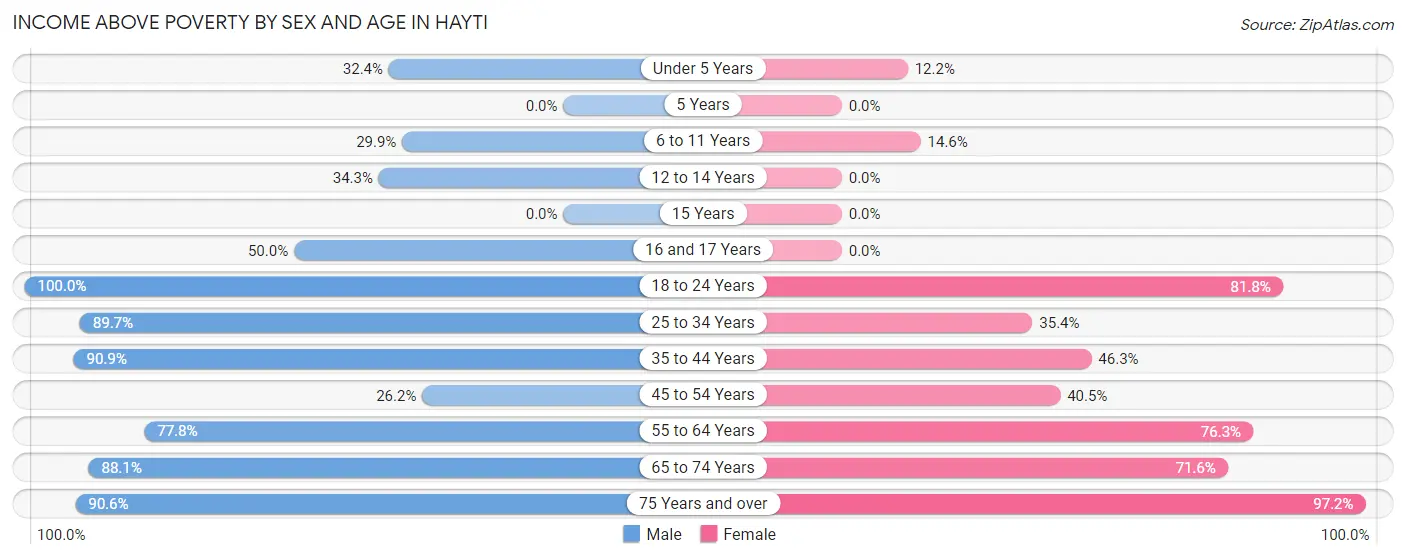
| Age Bracket | Male | Female |
| Under 5 Years | 23 (32.4%) | 18 (12.2%) |
| 5 Years | 0 (0.0%) | 0 (0.0%) |
| 6 to 11 Years | 64 (29.9%) | 18 (14.6%) |
| 12 to 14 Years | 25 (34.3%) | 0 (0.0%) |
| 15 Years | 0 (0.0%) | 0 (0.0%) |
| 16 and 17 Years | 58 (50.0%) | 0 (0.0%) |
| 18 to 24 Years | 42 (100.0%) | 18 (81.8%) |
| 25 to 34 Years | 35 (89.7%) | 52 (35.4%) |
| 35 to 44 Years | 90 (90.9%) | 82 (46.3%) |
| 45 to 54 Years | 22 (26.2%) | 60 (40.5%) |
| 55 to 64 Years | 182 (77.8%) | 132 (76.3%) |
| 65 to 74 Years | 89 (88.1%) | 53 (71.6%) |
| 75 Years and over | 77 (90.6%) | 103 (97.2%) |
| Total | 707 (61.1%) | 536 (45.4%) |
Income Below Poverty Among Married-Couple Families in Hayti
The poverty statistics for married-couple families in Hayti show that 22.9% or 83 of the total 362 families live below the poverty line. Families with 1 or 2 children have the highest poverty rate of 49.1%, comprising of 56 families. On the other hand, families with 3 or 4 children have the lowest poverty rate of 0.0%, which includes 0 families.
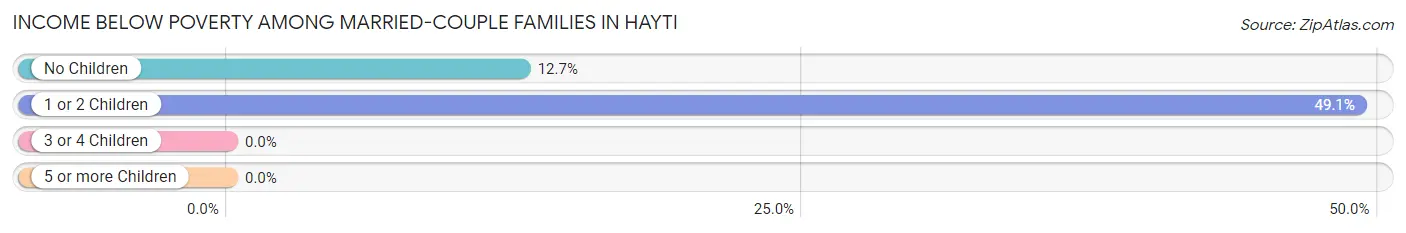
| Children | Above Poverty | Below Poverty |
| No Children | 185 (87.3%) | 27 (12.7%) |
| 1 or 2 Children | 58 (50.9%) | 56 (49.1%) |
| 3 or 4 Children | 36 (100.0%) | 0 (0.0%) |
| 5 or more Children | 0 (0.0%) | 0 (0.0%) |
| Total | 279 (77.1%) | 83 (22.9%) |
Income Below Poverty Among Single-Parent Households in Hayti
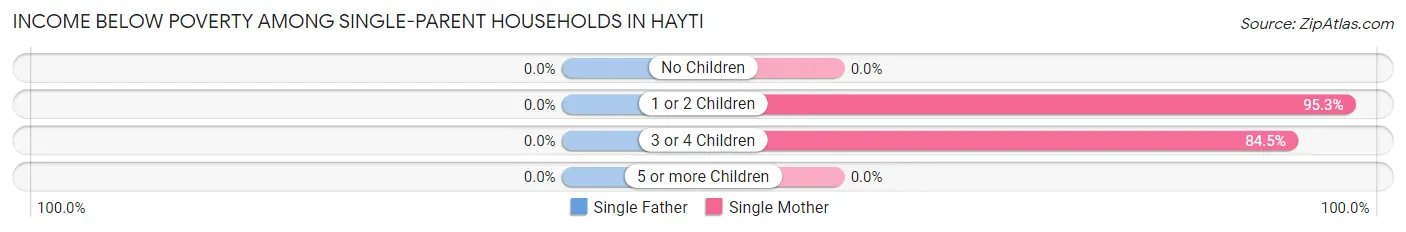
| Children | Single Father | Single Mother |
| No Children | 0 (0.0%) | 0 (0.0%) |
| 1 or 2 Children | 0 (0.0%) | 101 (95.3%) |
| 3 or 4 Children | 0 (0.0%) | 71 (84.5%) |
| 5 or more Children | 0 (0.0%) | 0 (0.0%) |
| Total | 0 (0.0%) | 172 (63.2%) |
Income Below Poverty Among Married-Couple vs Single-Parent Households in Hayti
The poverty data for Hayti shows that 83 of the married-couple family households (22.9%) and 172 of the single-parent households (62.1%) are living below the poverty level. Within the married-couple family households, those with 1 or 2 children have the highest poverty rate, with 56 households (49.1%) falling below the poverty line. Among the single-parent households, those with 1 or 2 children have the highest poverty rate, with 101 household (95.3%) living below poverty.
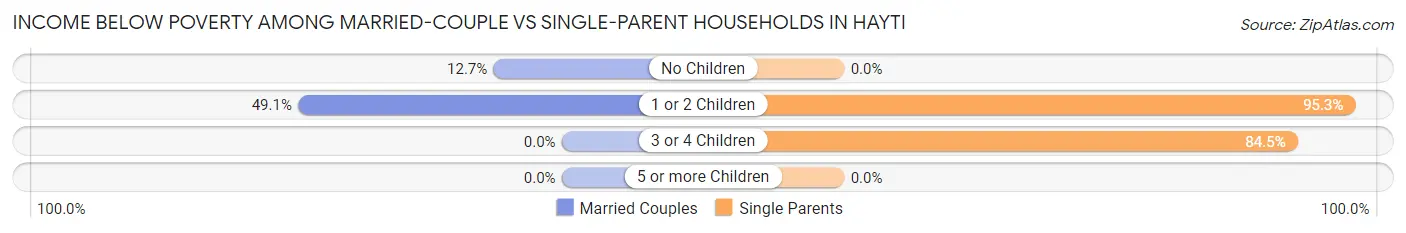
| Children | Married-Couple Families | Single-Parent Households |
| No Children | 27 (12.7%) | 0 (0.0%) |
| 1 or 2 Children | 56 (49.1%) | 101 (95.3%) |
| 3 or 4 Children | 0 (0.0%) | 71 (84.5%) |
| 5 or more Children | 0 (0.0%) | 0 (0.0%) |
| Total | 83 (22.9%) | 172 (62.1%) |
Race in Hayti
The most populous races in Hayti are White / Caucasian (1,464 | 61.9%), Black / African American (729 | 30.8%), and Two or more Races (168 | 7.1%).
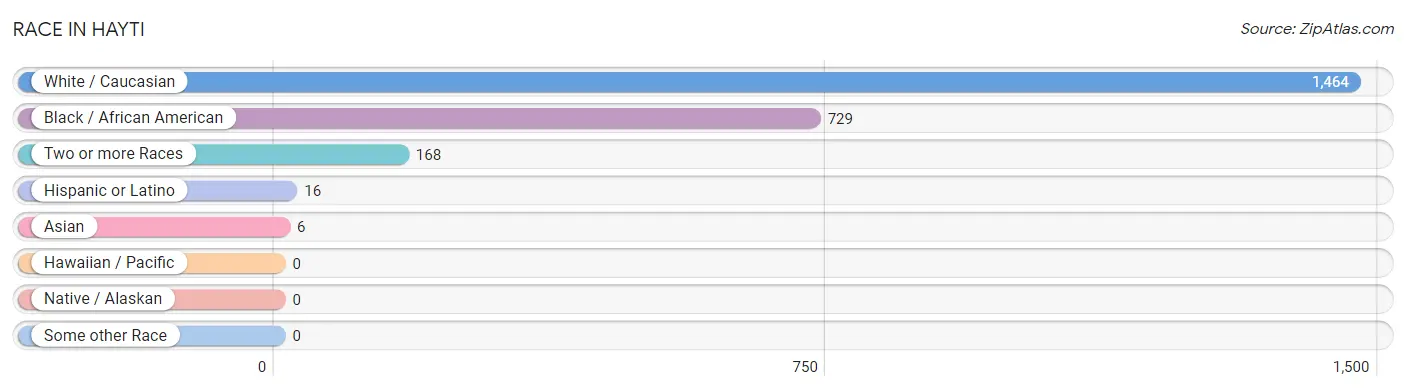
| Race | # Population | % Population |
| Asian | 6 | 0.3% |
| Black / African American | 729 | 30.8% |
| Hawaiian / Pacific | 0 | 0.0% |
| Hispanic or Latino | 16 | 0.7% |
| Native / Alaskan | 0 | 0.0% |
| White / Caucasian | 1,464 | 61.9% |
| Two or more Races | 168 | 7.1% |
| Some other Race | 0 | 0.0% |
| Total | 2,367 | 100.0% |
Ancestry in Hayti
The most populous ancestries reported in Hayti are Irish (284 | 12.0%), American (243 | 10.3%), German (155 | 6.6%), European (94 | 4.0%), and English (66 | 2.8%), together accounting for 35.6% of all Hayti residents.
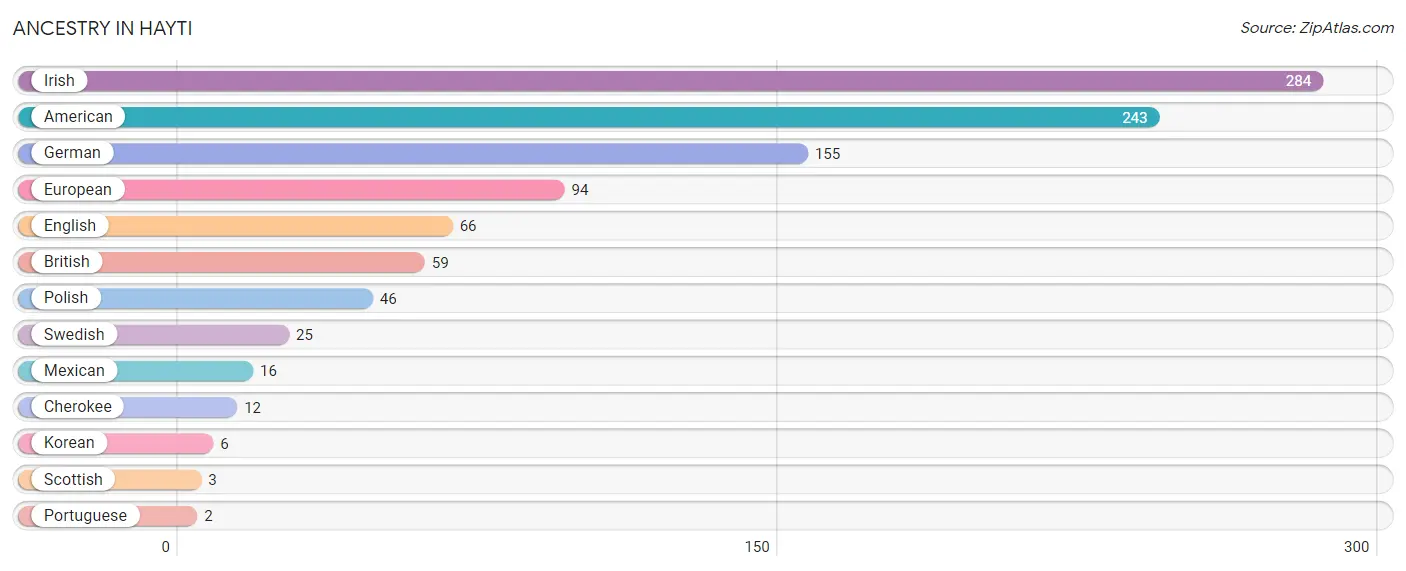
| Ancestry | # Population | % Population |
| American | 243 | 10.3% |
| British | 59 | 2.5% |
| Cherokee | 12 | 0.5% |
| English | 66 | 2.8% |
| European | 94 | 4.0% |
| German | 155 | 6.6% |
| Irish | 284 | 12.0% |
| Korean | 6 | 0.3% |
| Mexican | 16 | 0.7% |
| Polish | 46 | 1.9% |
| Portuguese | 2 | 0.1% |
| Scottish | 3 | 0.1% |
| Swedish | 25 | 1.1% | View All 13 Rows |
Immigrants in Hayti
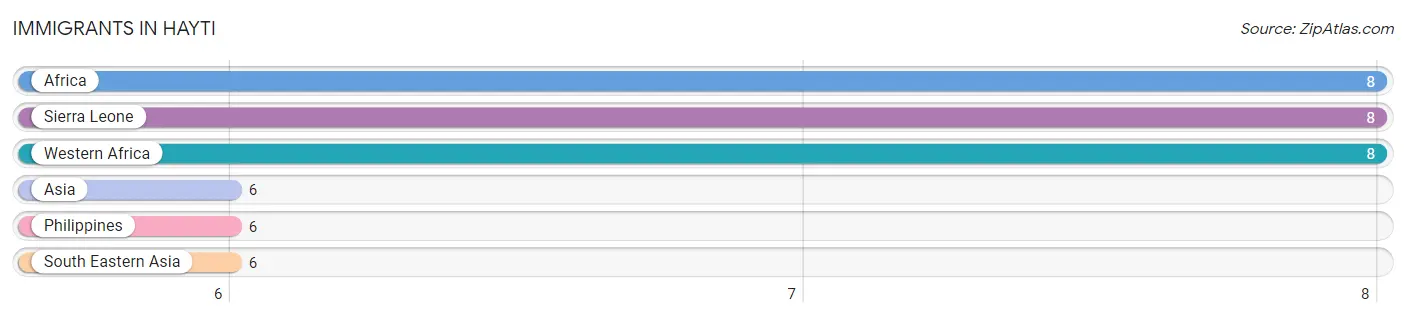
The most numerous immigrant groups reported in Hayti came from Africa (8 | 0.3%), Sierra Leone (8 | 0.3%), Western Africa (8 | 0.3%), Asia (6 | 0.3%), and Philippines (6 | 0.3%), together accounting for 1.5% of all Hayti residents.
| Immigration Origin | # Population | % Population |
| Africa | 8 | 0.3% |
| Asia | 6 | 0.3% |
| Philippines | 6 | 0.3% |
| Sierra Leone | 8 | 0.3% |
| South Eastern Asia | 6 | 0.3% |
| Western Africa | 8 | 0.3% | View All 6 Rows |
Sex and Age in Hayti
Sex and Age in Hayti
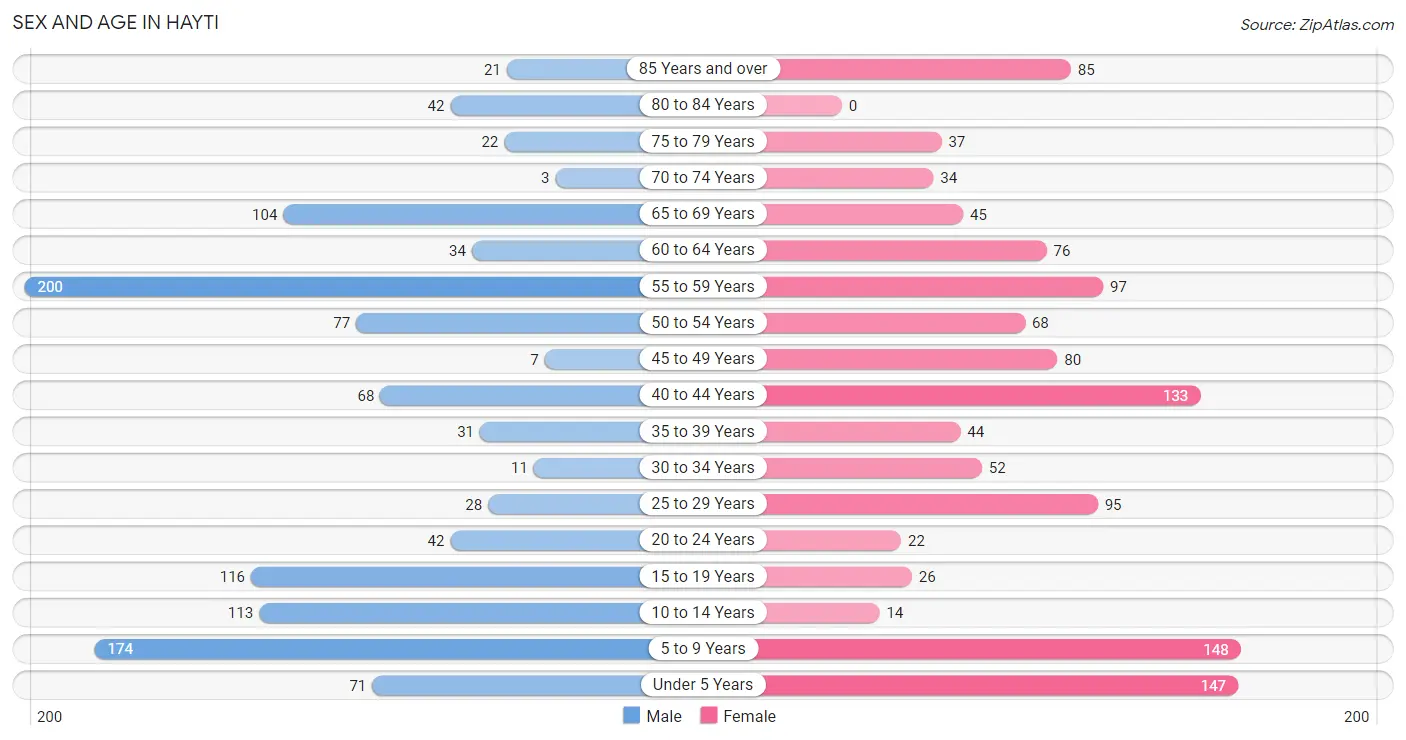
The most populous age groups in Hayti are 55 to 59 Years (200 | 17.2%) for men and 5 to 9 Years (148 | 12.3%) for women.
| Age Bracket | Male | Female |
| Under 5 Years | 71 (6.1%) | 147 (12.2%) |
| 5 to 9 Years | 174 (14.9%) | 148 (12.3%) |
| 10 to 14 Years | 113 (9.7%) | 14 (1.2%) |
| 15 to 19 Years | 116 (10.0%) | 26 (2.2%) |
| 20 to 24 Years | 42 (3.6%) | 22 (1.8%) |
| 25 to 29 Years | 28 (2.4%) | 95 (7.9%) |
| 30 to 34 Years | 11 (0.9%) | 52 (4.3%) |
| 35 to 39 Years | 31 (2.7%) | 44 (3.7%) |
| 40 to 44 Years | 68 (5.8%) | 133 (11.1%) |
| 45 to 49 Years | 7 (0.6%) | 80 (6.7%) |
| 50 to 54 Years | 77 (6.6%) | 68 (5.7%) |
| 55 to 59 Years | 200 (17.2%) | 97 (8.1%) |
| 60 to 64 Years | 34 (2.9%) | 76 (6.3%) |
| 65 to 69 Years | 104 (8.9%) | 45 (3.7%) |
| 70 to 74 Years | 3 (0.3%) | 34 (2.8%) |
| 75 to 79 Years | 22 (1.9%) | 37 (3.1%) |
| 80 to 84 Years | 42 (3.6%) | 0 (0.0%) |
| 85 Years and over | 21 (1.8%) | 85 (7.1%) |
| Total | 1,164 (100.0%) | 1,203 (100.0%) |
Families and Households in Hayti
Median Family Size in Hayti
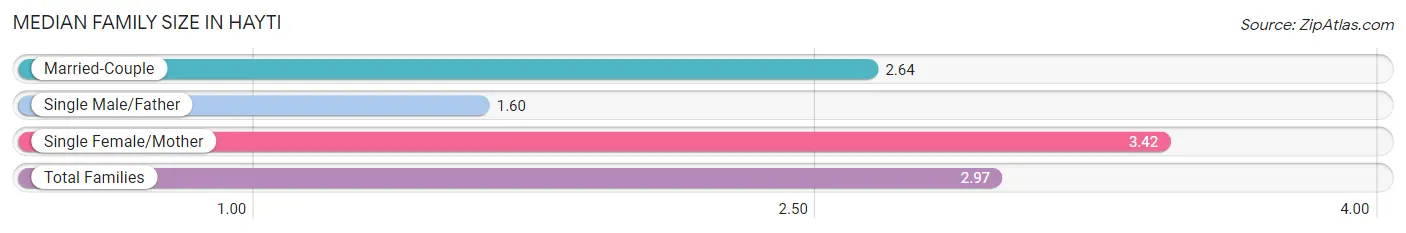
The median family size in Hayti is 2.97 persons per family, with single female/mother families (272 | 42.6%) accounting for the largest median family size of 3.42 persons per family. On the other hand, single male/father families (5 | 0.8%) represent the smallest median family size with 1.60 persons per family.
| Family Type | # Families | Family Size |
| Married-Couple | 362 (56.7%) | 2.64 |
| Single Male/Father | 5 (0.8%) | 1.60 |
| Single Female/Mother | 272 (42.6%) | 3.42 |
| Total Families | 639 (100.0%) | 2.97 |
Median Household Size in Hayti
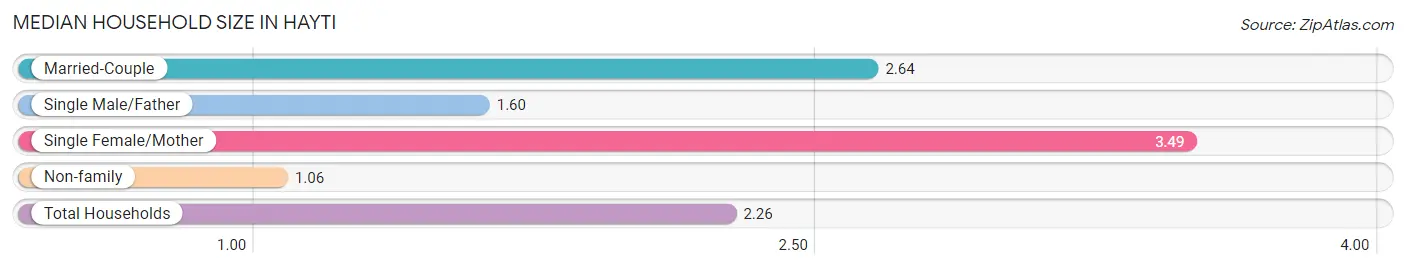
The median household size in Hayti is 2.26 persons per household, with single female/mother households (272 | 26.5%) accounting for the largest median household size of 3.49 persons per household. non-family households (387 | 37.7%) represent the smallest median household size with 1.06 persons per household.
| Household Type | # Households | Household Size |
| Married-Couple | 362 (35.3%) | 2.64 |
| Single Male/Father | 5 (0.5%) | 1.60 |
| Single Female/Mother | 272 (26.5%) | 3.49 |
| Non-family | 387 (37.7%) | 1.06 |
| Total Households | 1,026 (100.0%) | 2.26 |
Household Size by Marriage Status in Hayti
Out of a total of 1,026 households in Hayti, 639 (62.3%) are family households, while 387 (37.7%) are nonfamily households. The most numerous type of family households are 2-person households, comprising 327, and the most common type of nonfamily households are 1-person households, comprising 363.
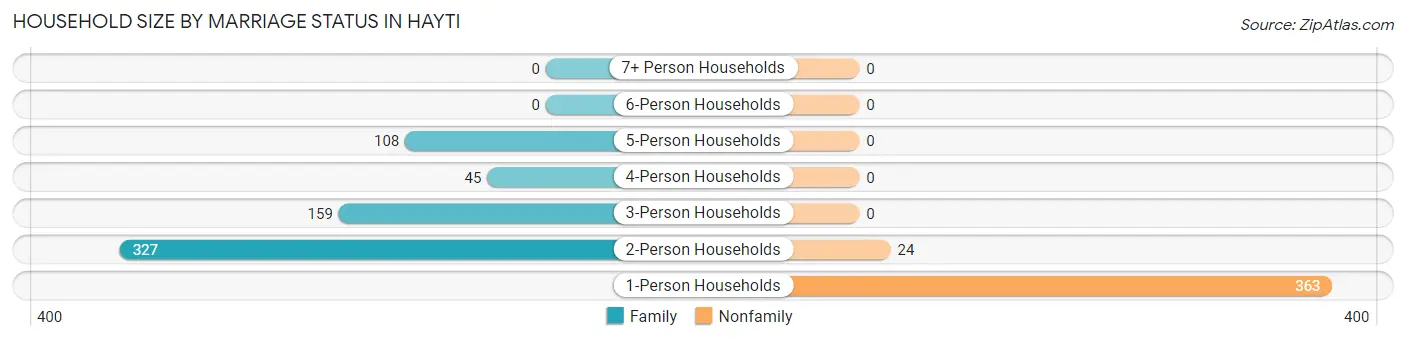
| Household Size | Family Households | Nonfamily Households |
| 1-Person Households | - | 363 (35.4%) |
| 2-Person Households | 327 (31.9%) | 24 (2.3%) |
| 3-Person Households | 159 (15.5%) | 0 (0.0%) |
| 4-Person Households | 45 (4.4%) | 0 (0.0%) |
| 5-Person Households | 108 (10.5%) | 0 (0.0%) |
| 6-Person Households | 0 (0.0%) | 0 (0.0%) |
| 7+ Person Households | 0 (0.0%) | 0 (0.0%) |
| Total | 639 (62.3%) | 387 (37.7%) |
Female Fertility in Hayti
Fertility by Age in Hayti
Average fertility rate in Hayti is 142.0 births per 1,000 women. Women in the age bracket of 20 to 34 years have the highest fertility rate with 349.0 births per 1,000 women. Women in the age bracket of 20 to 34 years acount for 89.4% of all women with births.
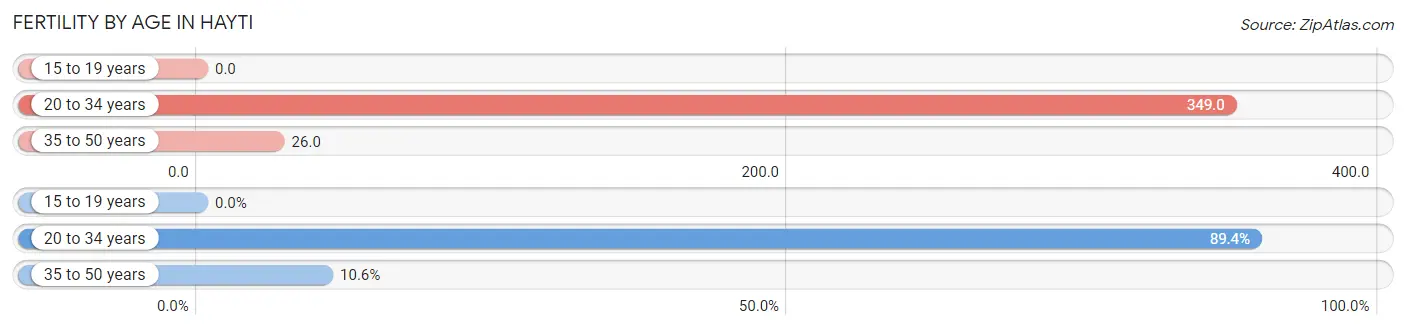
| Age Bracket | Women with Births | Births / 1,000 Women |
| 15 to 19 years | 0 (0.0%) | 0.0 |
| 20 to 34 years | 59 (89.4%) | 349.0 |
| 35 to 50 years | 7 (10.6%) | 26.0 |
| Total | 66 (100.0%) | 142.0 |
Fertility by Age by Marriage Status in Hayti
54.5% of women with births (66) in Hayti are married. The highest percentage of unmarried women with births falls into 35 to 50 years age bracket with 100.0% of them unmarried at the time of birth, while the lowest percentage of unmarried women with births belong to 20 to 34 years age bracket with 39.0% of them unmarried.
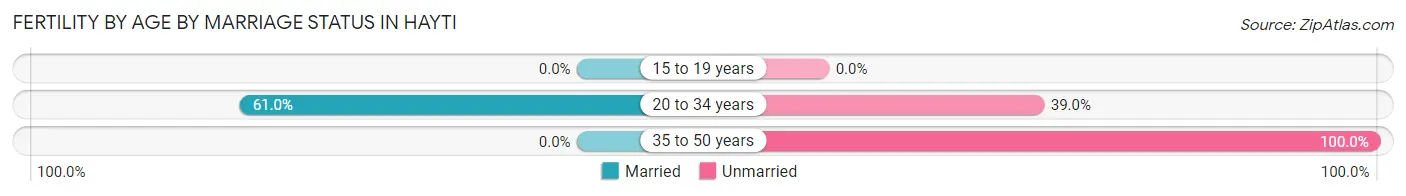
| Age Bracket | Married | Unmarried |
| 15 to 19 years | 0 (0.0%) | 0 (0.0%) |
| 20 to 34 years | 36 (61.0%) | 23 (39.0%) |
| 35 to 50 years | 0 (0.0%) | 7 (100.0%) |
| Total | 36 (54.5%) | 30 (45.5%) |
Fertility by Education in Hayti
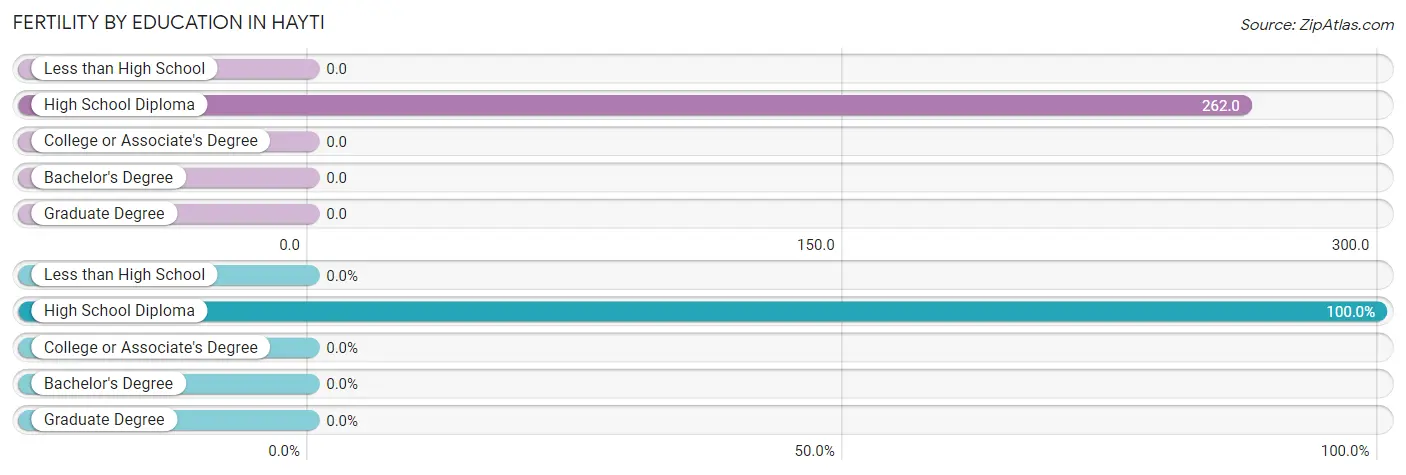
| Educational Attainment | Women with Births | Births / 1,000 Women |
| Less than High School | 0 (0.0%) | 0.0 |
| High School Diploma | 66 (100.0%) | 262.0 |
| College or Associate's Degree | 0 (0.0%) | 0.0 |
| Bachelor's Degree | 0 (0.0%) | 0.0 |
| Graduate Degree | 0 (0.0%) | 0.0 |
| Total | 66 (100.0%) | 142.0 |
Fertility by Education by Marriage Status in Hayti
45.5% of women with births in Hayti are unmarried. Women with the educational attainment of high school diploma are most likely to be married with 54.5% of them married at childbirth, while women with the educational attainment of high school diploma are least likely to be married with 45.5% of them unmarried at childbirth.
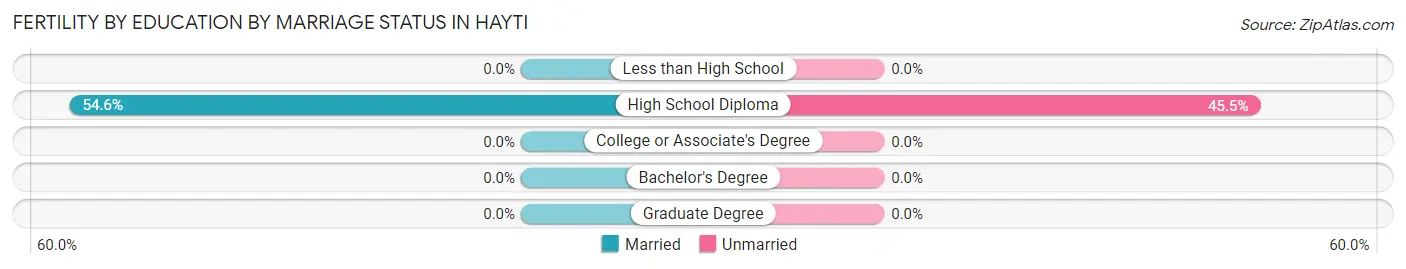
| Educational Attainment | Married | Unmarried |
| Less than High School | 0 (0.0%) | 0 (0.0%) |
| High School Diploma | 36 (54.5%) | 30 (45.5%) |
| College or Associate's Degree | 0 (0.0%) | 0 (0.0%) |
| Bachelor's Degree | 0 (0.0%) | 0 (0.0%) |
| Graduate Degree | 0 (0.0%) | 0 (0.0%) |
| Total | 36 (54.5%) | 30 (45.5%) |
Employment Characteristics in Hayti
Employment by Class of Employer in Hayti
Among the 591 employed individuals in Hayti, private company employees (385 | 65.1%), local government employees (85 | 14.4%), and self-employed (not incorporated) (44 | 7.4%) make up the most common classes of employment.
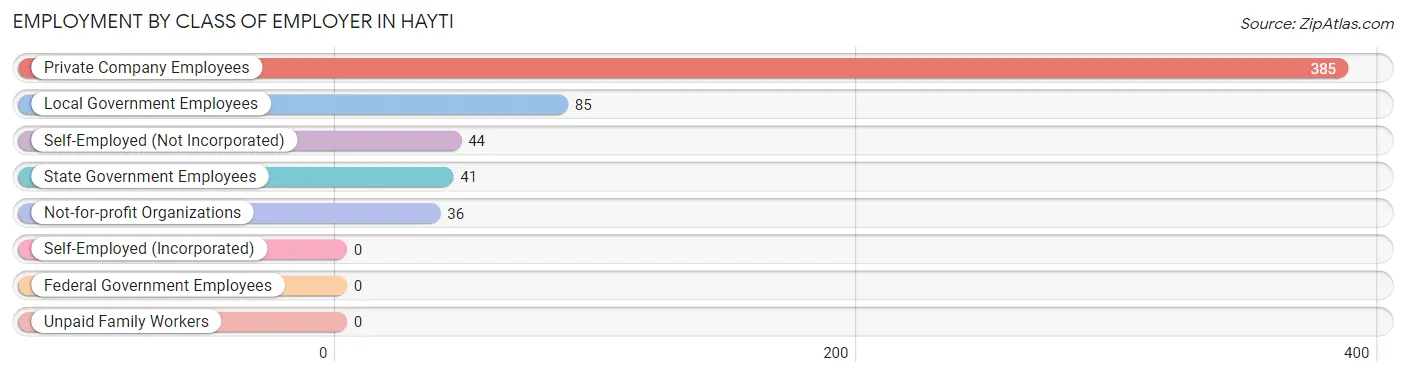
| Employer Class | # Employees | % Employees |
| Private Company Employees | 385 | 65.1% |
| Self-Employed (Incorporated) | 0 | 0.0% |
| Self-Employed (Not Incorporated) | 44 | 7.4% |
| Not-for-profit Organizations | 36 | 6.1% |
| Local Government Employees | 85 | 14.4% |
| State Government Employees | 41 | 6.9% |
| Federal Government Employees | 0 | 0.0% |
| Unpaid Family Workers | 0 | 0.0% |
| Total | 591 | 100.0% |
Employment Status by Age in Hayti
According to the labor force statistics for Hayti, out of the total population over 16 years of age (1,691), 41.2% or 697 individuals are in the labor force, with 12.5% or 87 of them unemployed. The age group with the highest labor force participation rate is 20 to 24 years, with 100.0% or 64 individuals in the labor force. Within the labor force, the 75 years and over age range has the highest percentage of unemployed individuals, with 100.0% or 8 of them being unemployed.
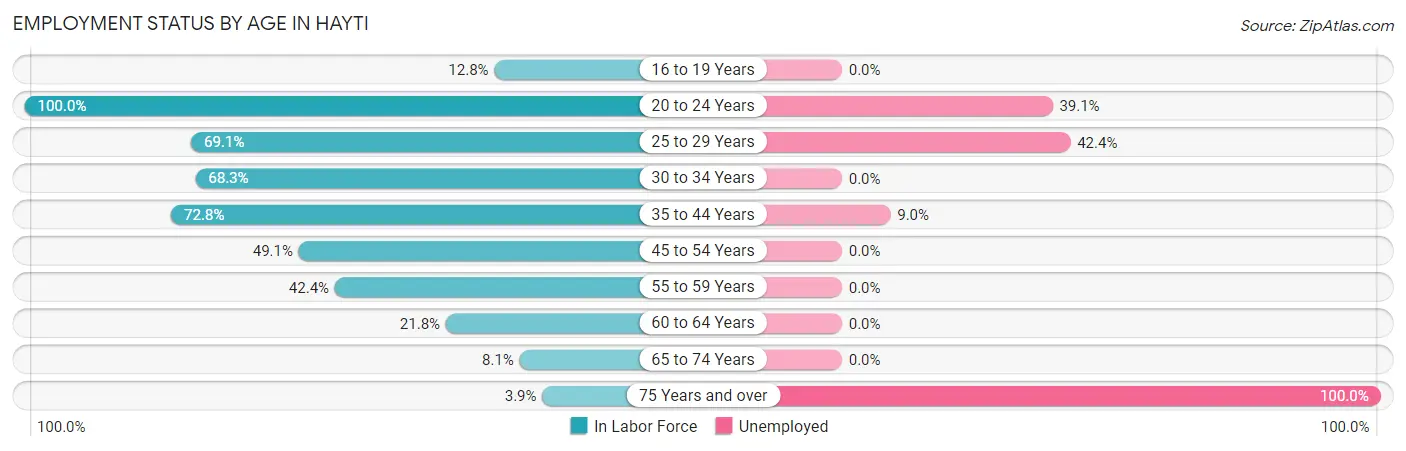
| Age Bracket | In Labor Force | Unemployed |
| 16 to 19 Years | 17 (12.8%) | 0 (0.0%) |
| 20 to 24 Years | 64 (100.0%) | 25 (39.1%) |
| 25 to 29 Years | 85 (69.1%) | 36 (42.4%) |
| 30 to 34 Years | 43 (68.3%) | 0 (0.0%) |
| 35 to 44 Years | 201 (72.8%) | 18 (9.0%) |
| 45 to 54 Years | 114 (49.1%) | 0 (0.0%) |
| 55 to 59 Years | 126 (42.4%) | 0 (0.0%) |
| 60 to 64 Years | 24 (21.8%) | 0 (0.0%) |
| 65 to 74 Years | 15 (8.1%) | 0 (0.0%) |
| 75 Years and over | 8 (3.9%) | 8 (100.0%) |
| Total | 697 (41.2%) | 87 (12.5%) |
Employment Status by Educational Attainment in Hayti
According to labor force statistics for Hayti, 53.9% of individuals (593) out of the total population between 25 and 64 years of age (1,101) are in the labor force, with 9.1% or 54 of them being unemployed. The group with the highest labor force participation rate are those with the educational attainment of bachelor's degree or higher, with 75.0% or 27 individuals in the labor force. Within the labor force, individuals with high school diploma education have the highest percentage of unemployment, with 14.2% or 54 of them being unemployed.
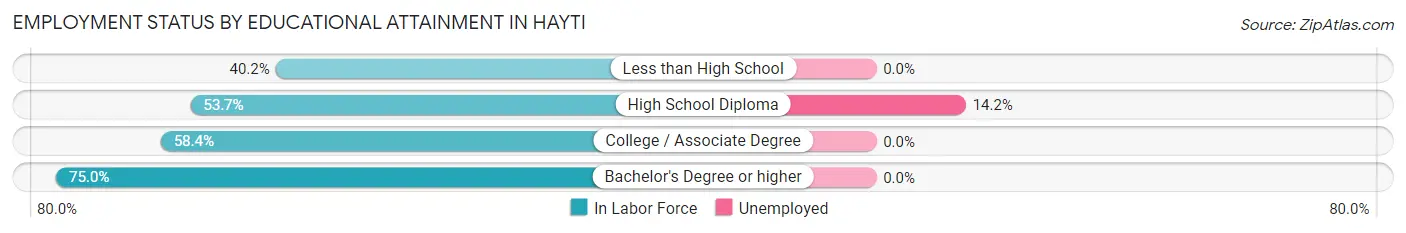
| Educational Attainment | In Labor Force | Unemployed |
| Less than High School | 51 (40.2%) | 0 (0.0%) |
| High School Diploma | 380 (53.7%) | 100 (14.2%) |
| College / Associate Degree | 135 (58.4%) | 0 (0.0%) |
| Bachelor's Degree or higher | 27 (75.0%) | 0 (0.0%) |
| Total | 593 (53.9%) | 100 (9.1%) |
Employment Occupations by Sex in Hayti
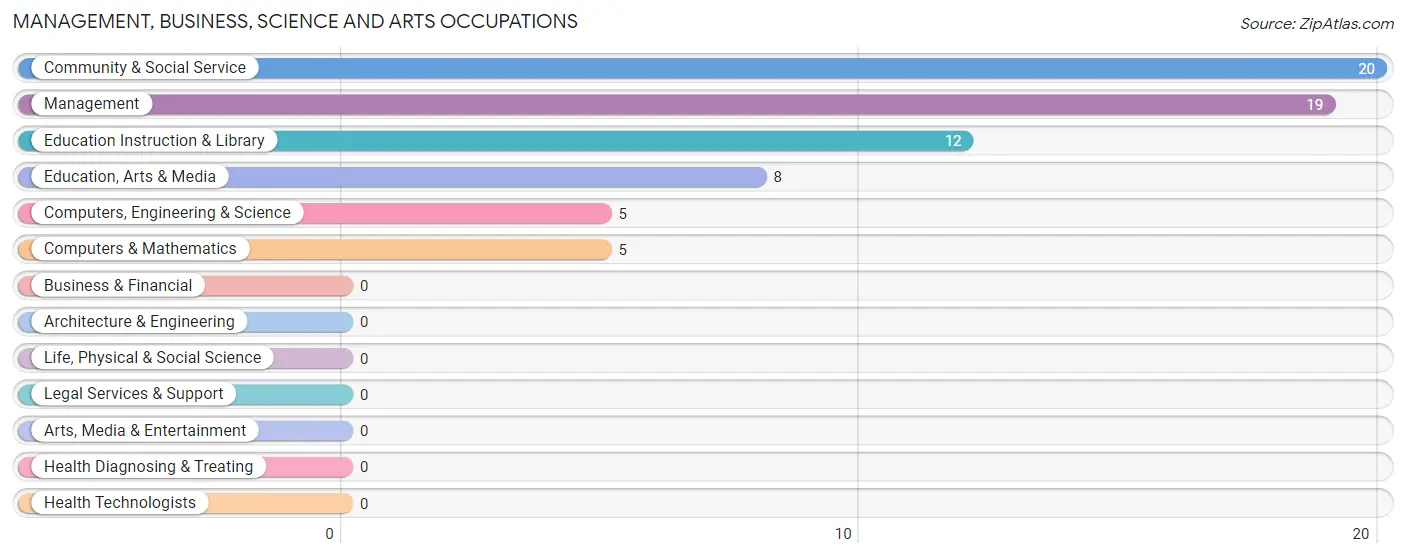
Management, Business, Science and Arts Occupations
The most common Management, Business, Science and Arts occupations in Hayti are Community & Social Service (20 | 3.3%), Management (19 | 3.1%), Education Instruction & Library (12 | 2.0%), Education, Arts & Media (8 | 1.3%), and Computers, Engineering & Science (5 | 0.8%).
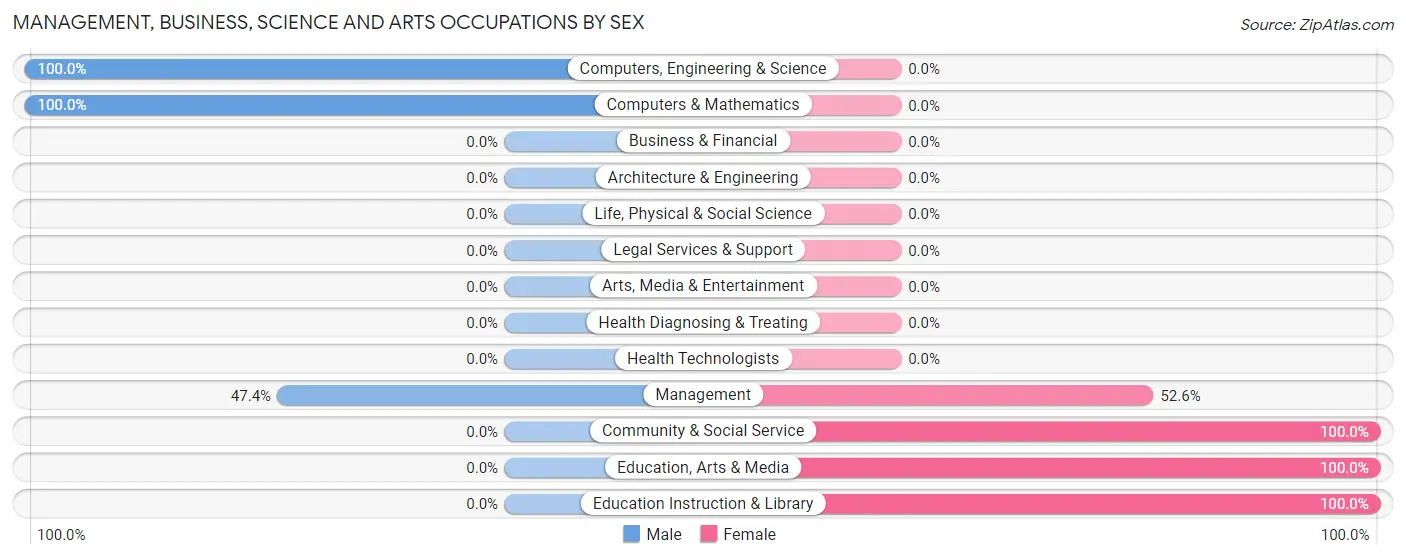
Management, Business, Science and Arts Occupations by Sex
Within the Management, Business, Science and Arts occupations in Hayti, the most male-oriented occupations are Computers, Engineering & Science (100.0%), Computers & Mathematics (100.0%), and Management (47.4%), while the most female-oriented occupations are Community & Social Service (100.0%), Education, Arts & Media (100.0%), and Education Instruction & Library (100.0%).
| Occupation | Male | Female |
| Management | 9 (47.4%) | 10 (52.6%) |
| Business & Financial | 0 (0.0%) | 0 (0.0%) |
| Computers, Engineering & Science | 5 (100.0%) | 0 (0.0%) |
| Computers & Mathematics | 5 (100.0%) | 0 (0.0%) |
| Architecture & Engineering | 0 (0.0%) | 0 (0.0%) |
| Life, Physical & Social Science | 0 (0.0%) | 0 (0.0%) |
| Community & Social Service | 0 (0.0%) | 20 (100.0%) |
| Education, Arts & Media | 0 (0.0%) | 8 (100.0%) |
| Legal Services & Support | 0 (0.0%) | 0 (0.0%) |
| Education Instruction & Library | 0 (0.0%) | 12 (100.0%) |
| Arts, Media & Entertainment | 0 (0.0%) | 0 (0.0%) |
| Health Diagnosing & Treating | 0 (0.0%) | 0 (0.0%) |
| Health Technologists | 0 (0.0%) | 0 (0.0%) |
| Total (Category) | 14 (31.8%) | 30 (68.2%) |
| Total (Overall) | 255 (41.8%) | 355 (58.2%) |
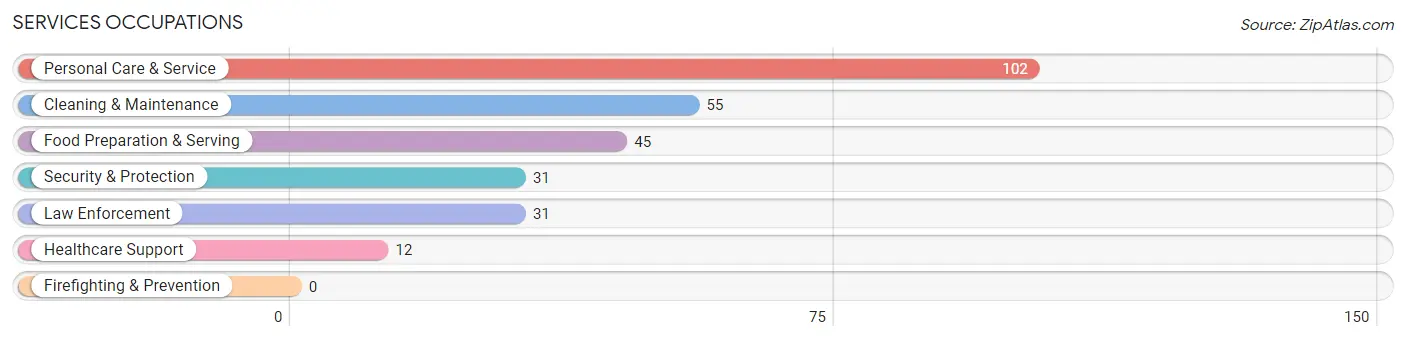
Services Occupations
The most common Services occupations in Hayti are Personal Care & Service (102 | 16.7%), Cleaning & Maintenance (55 | 9.0%), Food Preparation & Serving (45 | 7.4%), Security & Protection (31 | 5.1%), and Law Enforcement (31 | 5.1%).
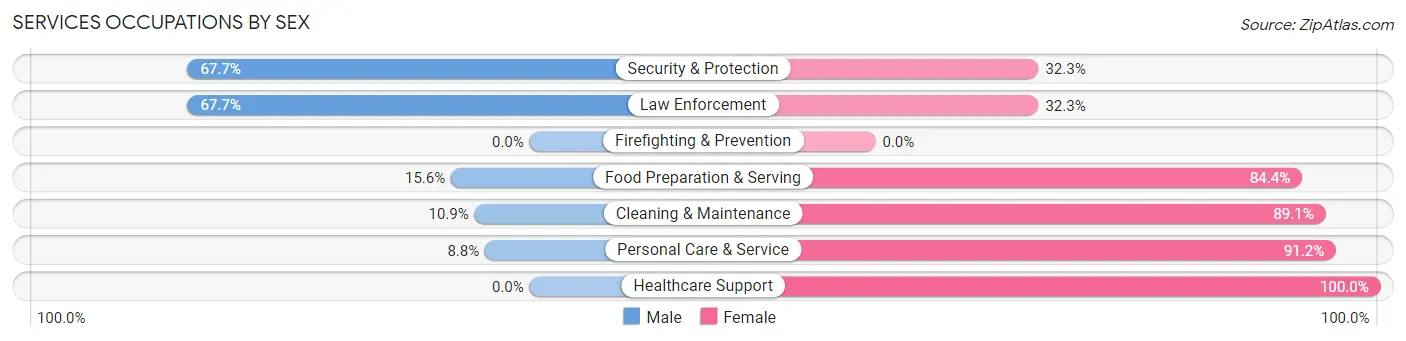
Services Occupations by Sex
Within the Services occupations in Hayti, the most male-oriented occupations are Security & Protection (67.7%), Law Enforcement (67.7%), and Food Preparation & Serving (15.6%), while the most female-oriented occupations are Healthcare Support (100.0%), Personal Care & Service (91.2%), and Cleaning & Maintenance (89.1%).
| Occupation | Male | Female |
| Healthcare Support | 0 (0.0%) | 12 (100.0%) |
| Security & Protection | 21 (67.7%) | 10 (32.3%) |
| Firefighting & Prevention | 0 (0.0%) | 0 (0.0%) |
| Law Enforcement | 21 (67.7%) | 10 (32.3%) |
| Food Preparation & Serving | 7 (15.6%) | 38 (84.4%) |
| Cleaning & Maintenance | 6 (10.9%) | 49 (89.1%) |
| Personal Care & Service | 9 (8.8%) | 93 (91.2%) |
| Total (Category) | 43 (17.5%) | 202 (82.5%) |
| Total (Overall) | 255 (41.8%) | 355 (58.2%) |
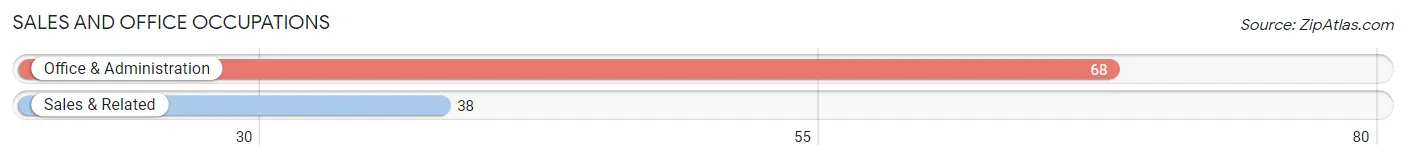
Sales and Office Occupations
The most common Sales and Office occupations in Hayti are Office & Administration (68 | 11.2%), and Sales & Related (38 | 6.2%).
Sales and Office Occupations by Sex
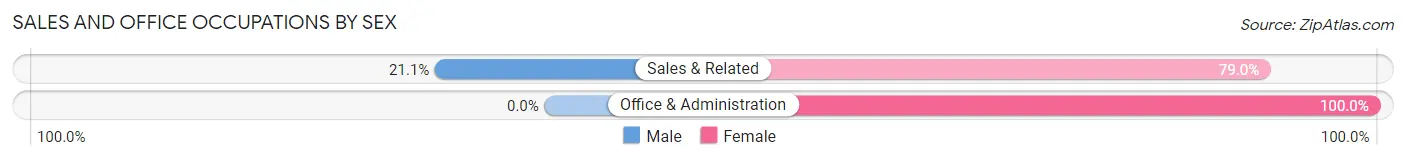
| Occupation | Male | Female |
| Sales & Related | 8 (21.0%) | 30 (78.9%) |
| Office & Administration | 0 (0.0%) | 68 (100.0%) |
| Total (Category) | 8 (7.5%) | 98 (92.4%) |
| Total (Overall) | 255 (41.8%) | 355 (58.2%) |
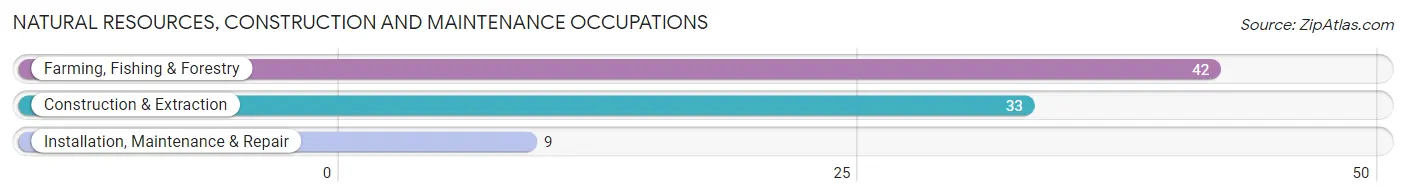
Natural Resources, Construction and Maintenance Occupations
The most common Natural Resources, Construction and Maintenance occupations in Hayti are Farming, Fishing & Forestry (42 | 6.9%), Construction & Extraction (33 | 5.4%), and Installation, Maintenance & Repair (9 | 1.5%).
Natural Resources, Construction and Maintenance Occupations by Sex
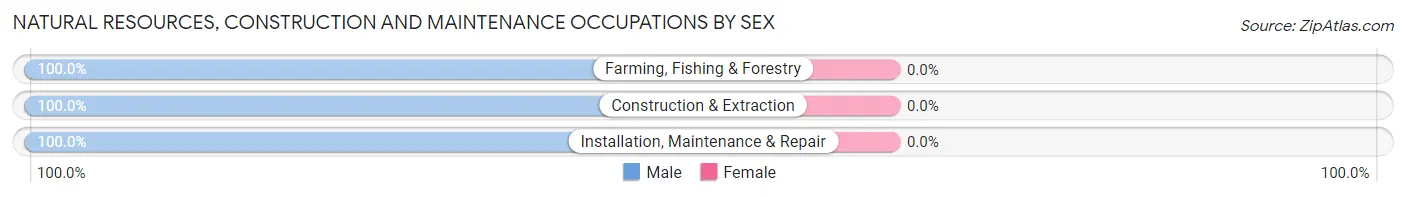
| Occupation | Male | Female |
| Farming, Fishing & Forestry | 42 (100.0%) | 0 (0.0%) |
| Construction & Extraction | 33 (100.0%) | 0 (0.0%) |
| Installation, Maintenance & Repair | 9 (100.0%) | 0 (0.0%) |
| Total (Category) | 84 (100.0%) | 0 (0.0%) |
| Total (Overall) | 255 (41.8%) | 355 (58.2%) |
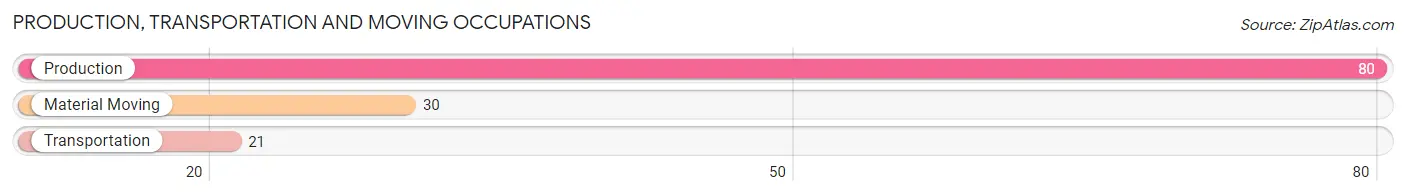
Production, Transportation and Moving Occupations
The most common Production, Transportation and Moving occupations in Hayti are Production (80 | 13.1%), Material Moving (30 | 4.9%), and Transportation (21 | 3.4%).
Production, Transportation and Moving Occupations by Sex
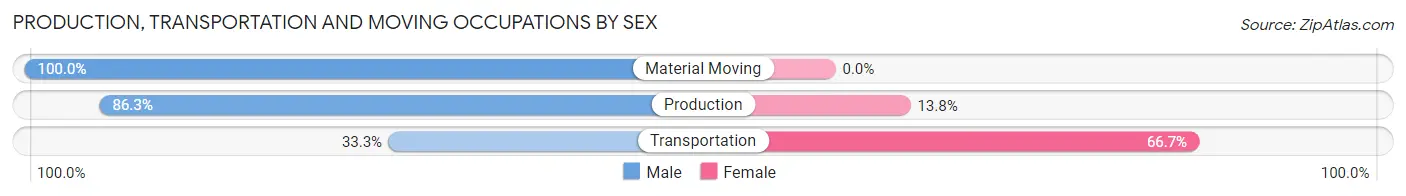
| Occupation | Male | Female |
| Production | 69 (86.3%) | 11 (13.8%) |
| Transportation | 7 (33.3%) | 14 (66.7%) |
| Material Moving | 30 (100.0%) | 0 (0.0%) |
| Total (Category) | 106 (80.9%) | 25 (19.1%) |
| Total (Overall) | 255 (41.8%) | 355 (58.2%) |
Employment Industries by Sex in Hayti
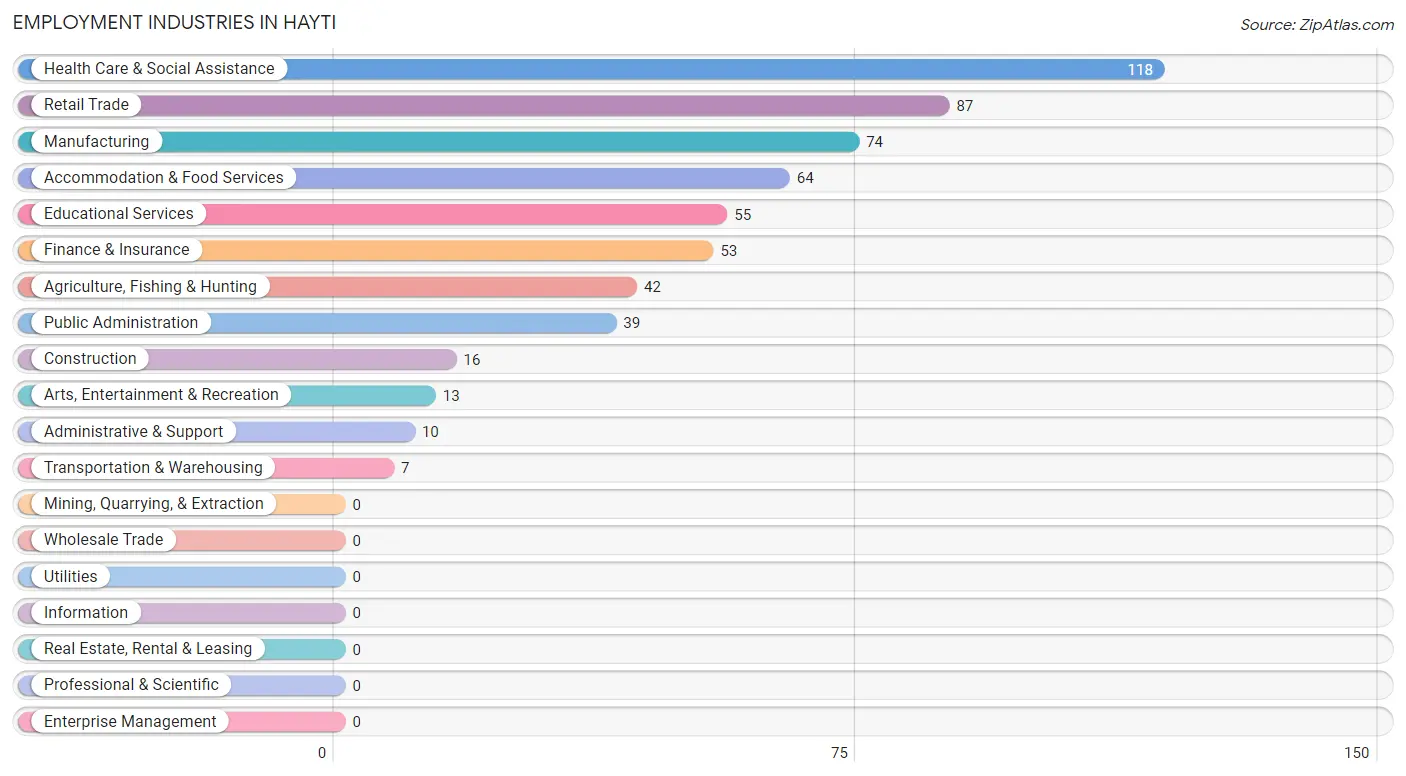
Employment Industries in Hayti
The major employment industries in Hayti include Health Care & Social Assistance (118 | 19.3%), Retail Trade (87 | 14.3%), Manufacturing (74 | 12.1%), Accommodation & Food Services (64 | 10.5%), and Educational Services (55 | 9.0%).
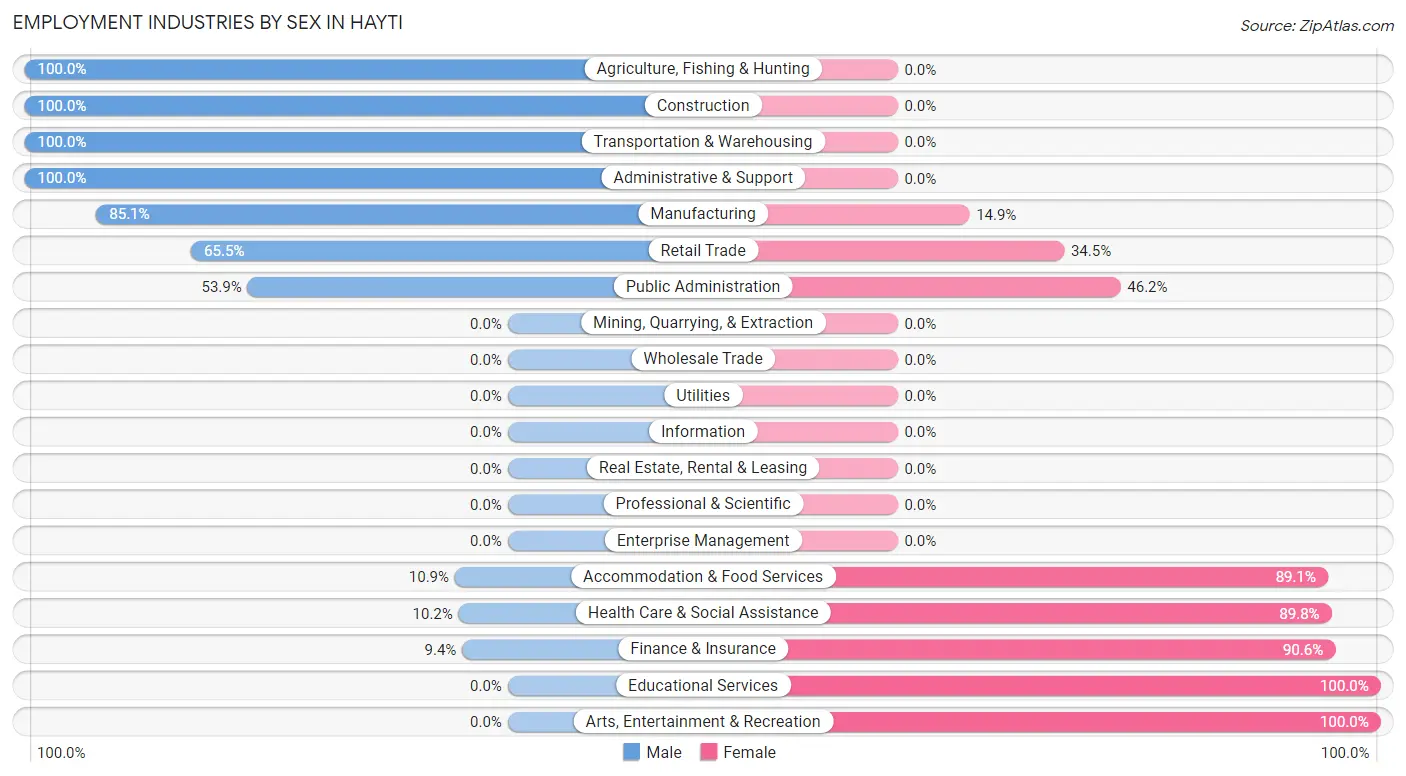
Employment Industries by Sex in Hayti
The Hayti industries that see more men than women are Agriculture, Fishing & Hunting (100.0%), Construction (100.0%), and Transportation & Warehousing (100.0%), whereas the industries that tend to have a higher number of women are Educational Services (100.0%), Arts, Entertainment & Recreation (100.0%), and Finance & Insurance (90.6%).
| Industry | Male | Female |
| Agriculture, Fishing & Hunting | 42 (100.0%) | 0 (0.0%) |
| Mining, Quarrying, & Extraction | 0 (0.0%) | 0 (0.0%) |
| Construction | 16 (100.0%) | 0 (0.0%) |
| Manufacturing | 63 (85.1%) | 11 (14.9%) |
| Wholesale Trade | 0 (0.0%) | 0 (0.0%) |
| Retail Trade | 57 (65.5%) | 30 (34.5%) |
| Transportation & Warehousing | 7 (100.0%) | 0 (0.0%) |
| Utilities | 0 (0.0%) | 0 (0.0%) |
| Information | 0 (0.0%) | 0 (0.0%) |
| Finance & Insurance | 5 (9.4%) | 48 (90.6%) |
| Real Estate, Rental & Leasing | 0 (0.0%) | 0 (0.0%) |
| Professional & Scientific | 0 (0.0%) | 0 (0.0%) |
| Enterprise Management | 0 (0.0%) | 0 (0.0%) |
| Administrative & Support | 10 (100.0%) | 0 (0.0%) |
| Educational Services | 0 (0.0%) | 55 (100.0%) |
| Health Care & Social Assistance | 12 (10.2%) | 106 (89.8%) |
| Arts, Entertainment & Recreation | 0 (0.0%) | 13 (100.0%) |
| Accommodation & Food Services | 7 (10.9%) | 57 (89.1%) |
| Public Administration | 21 (53.8%) | 18 (46.2%) |
| Total | 255 (41.8%) | 355 (58.2%) |
Education in Hayti
School Enrollment in Hayti
The most common levels of schooling among the 508 students in Hayti are elementary school (219 | 43.1%), middle school (113 | 22.2%), and high school (92 | 18.1%).
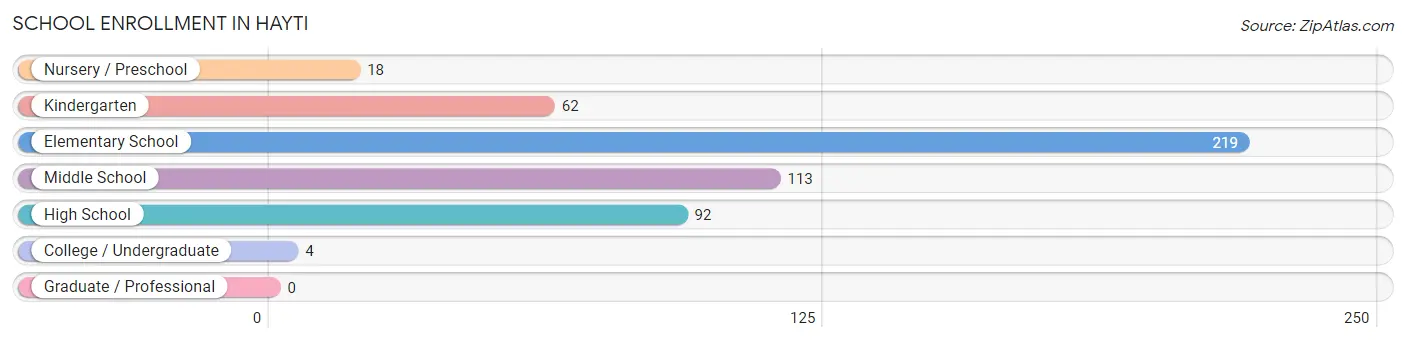
| School Level | # Students | % Students |
| Nursery / Preschool | 18 | 3.5% |
| Kindergarten | 62 | 12.2% |
| Elementary School | 219 | 43.1% |
| Middle School | 113 | 22.2% |
| High School | 92 | 18.1% |
| College / Undergraduate | 4 | 0.8% |
| Graduate / Professional | 0 | 0.0% |
| Total | 508 | 100.0% |
School Enrollment by Age by Funding Source in Hayti
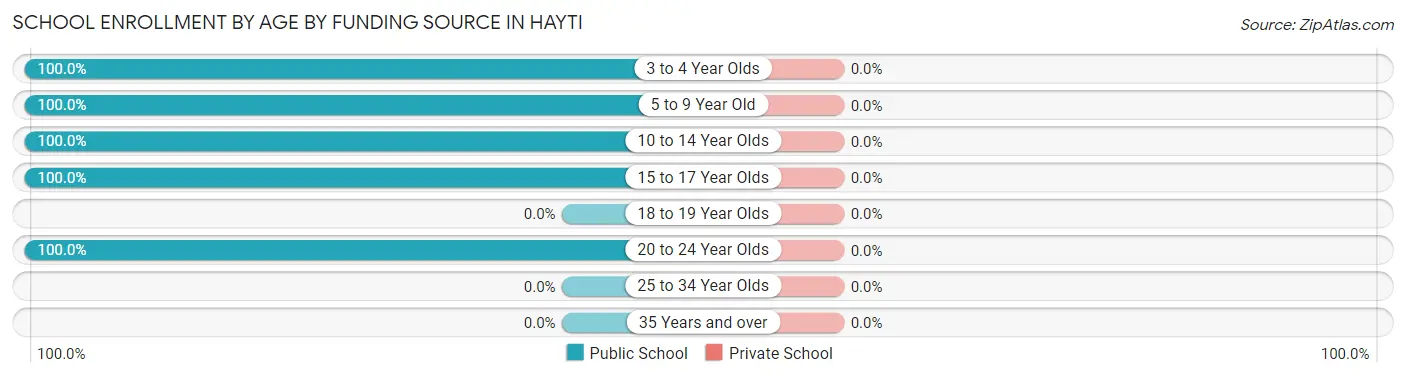
| Age Bracket | Public School | Private School |
| 3 to 4 Year Olds | 18 (100.0%) | 0 (0.0%) |
| 5 to 9 Year Old | 281 (100.0%) | 0 (0.0%) |
| 10 to 14 Year Olds | 113 (100.0%) | 0 (0.0%) |
| 15 to 17 Year Olds | 92 (100.0%) | 0 (0.0%) |
| 18 to 19 Year Olds | 0 (0.0%) | 0 (0.0%) |
| 20 to 24 Year Olds | 4 (100.0%) | 0 (0.0%) |
| 25 to 34 Year Olds | 0 (0.0%) | 0 (0.0%) |
| 35 Years and over | 0 (0.0%) | 0 (0.0%) |
| Total | 508 (100.0%) | 0 (0.0%) |
Educational Attainment by Field of Study in Hayti
Education (21 | 36.8%), business (15 | 26.3%), bio, nature & agricultural (7 | 12.3%), liberal arts & history (6 | 10.5%), and computers & mathematics (5 | 8.8%) are the most common fields of study among 57 individuals in Hayti who have obtained a bachelor's degree or higher.
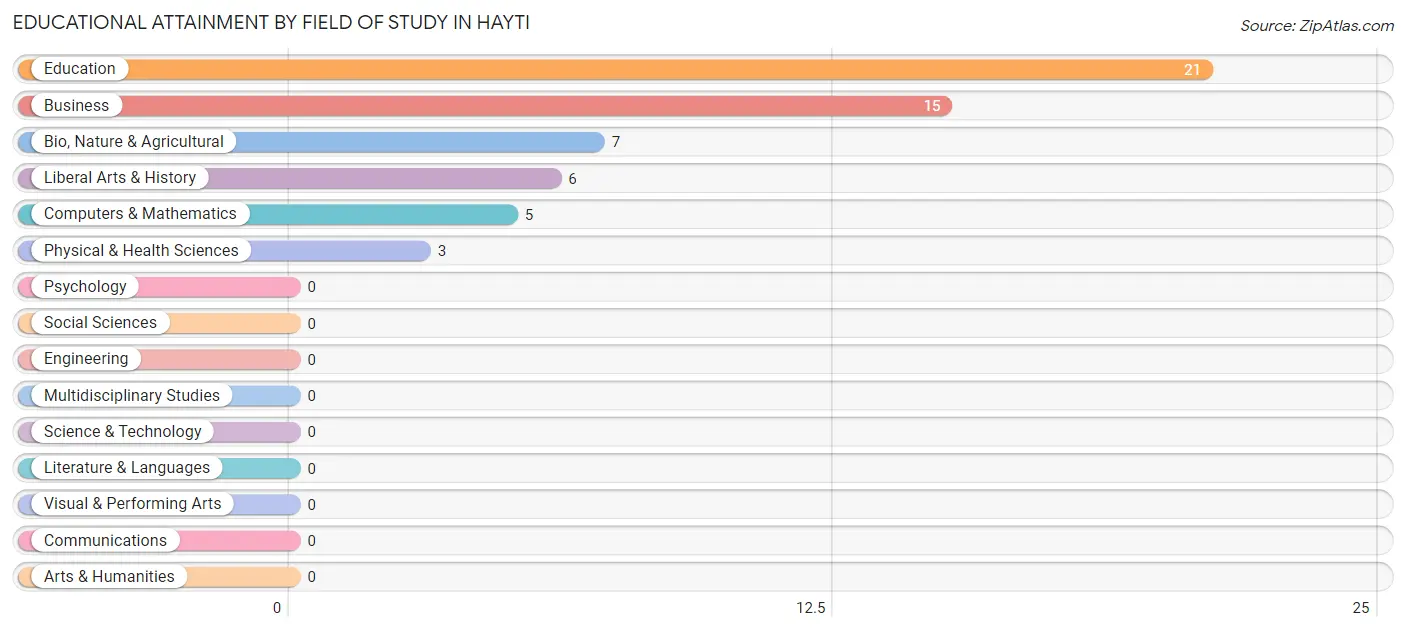
| Field of Study | # Graduates | % Graduates |
| Computers & Mathematics | 5 | 8.8% |
| Bio, Nature & Agricultural | 7 | 12.3% |
| Physical & Health Sciences | 3 | 5.3% |
| Psychology | 0 | 0.0% |
| Social Sciences | 0 | 0.0% |
| Engineering | 0 | 0.0% |
| Multidisciplinary Studies | 0 | 0.0% |
| Science & Technology | 0 | 0.0% |
| Business | 15 | 26.3% |
| Education | 21 | 36.8% |
| Literature & Languages | 0 | 0.0% |
| Liberal Arts & History | 6 | 10.5% |
| Visual & Performing Arts | 0 | 0.0% |
| Communications | 0 | 0.0% |
| Arts & Humanities | 0 | 0.0% |
| Total | 57 | 100.0% |
Transportation & Commute in Hayti
Vehicle Availability by Sex in Hayti
The most prevalent vehicle ownership categories in Hayti are males with 1 vehicle (90, accounting for 38.6%) and females with 1 vehicle (180, making up 25.4%).
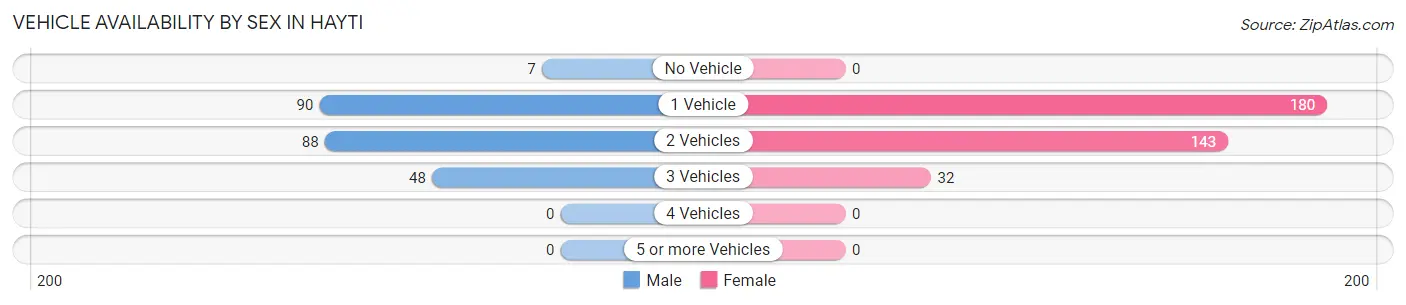
| Vehicles Available | Male | Female |
| No Vehicle | 7 (3.0%) | 0 (0.0%) |
| 1 Vehicle | 90 (38.6%) | 180 (50.7%) |
| 2 Vehicles | 88 (37.8%) | 143 (40.3%) |
| 3 Vehicles | 48 (20.6%) | 32 (9.0%) |
| 4 Vehicles | 0 (0.0%) | 0 (0.0%) |
| 5 or more Vehicles | 0 (0.0%) | 0 (0.0%) |
| Total | 233 (100.0%) | 355 (100.0%) |
Commute Time in Hayti
The most frequently occuring commute durations in Hayti are 5 to 9 minutes (182 commuters, 31.3%), 10 to 14 minutes (126 commuters, 21.6%), and less than 5 minutes (121 commuters, 20.8%).
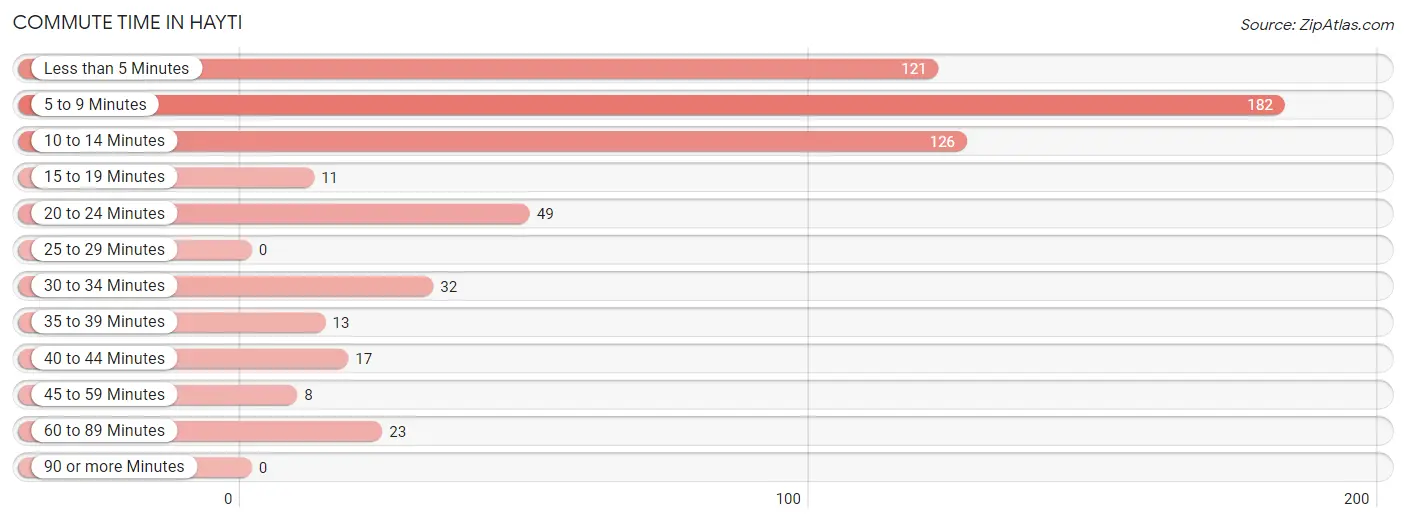
| Commute Time | # Commuters | % Commuters |
| Less than 5 Minutes | 121 | 20.8% |
| 5 to 9 Minutes | 182 | 31.3% |
| 10 to 14 Minutes | 126 | 21.6% |
| 15 to 19 Minutes | 11 | 1.9% |
| 20 to 24 Minutes | 49 | 8.4% |
| 25 to 29 Minutes | 0 | 0.0% |
| 30 to 34 Minutes | 32 | 5.5% |
| 35 to 39 Minutes | 13 | 2.2% |
| 40 to 44 Minutes | 17 | 2.9% |
| 45 to 59 Minutes | 8 | 1.4% |
| 60 to 89 Minutes | 23 | 4.0% |
| 90 or more Minutes | 0 | 0.0% |
Commute Time by Sex in Hayti
The most common commute times in Hayti are 10 to 14 minutes (67 commuters, 29.5%) for males and 5 to 9 minutes (135 commuters, 38.0%) for females.
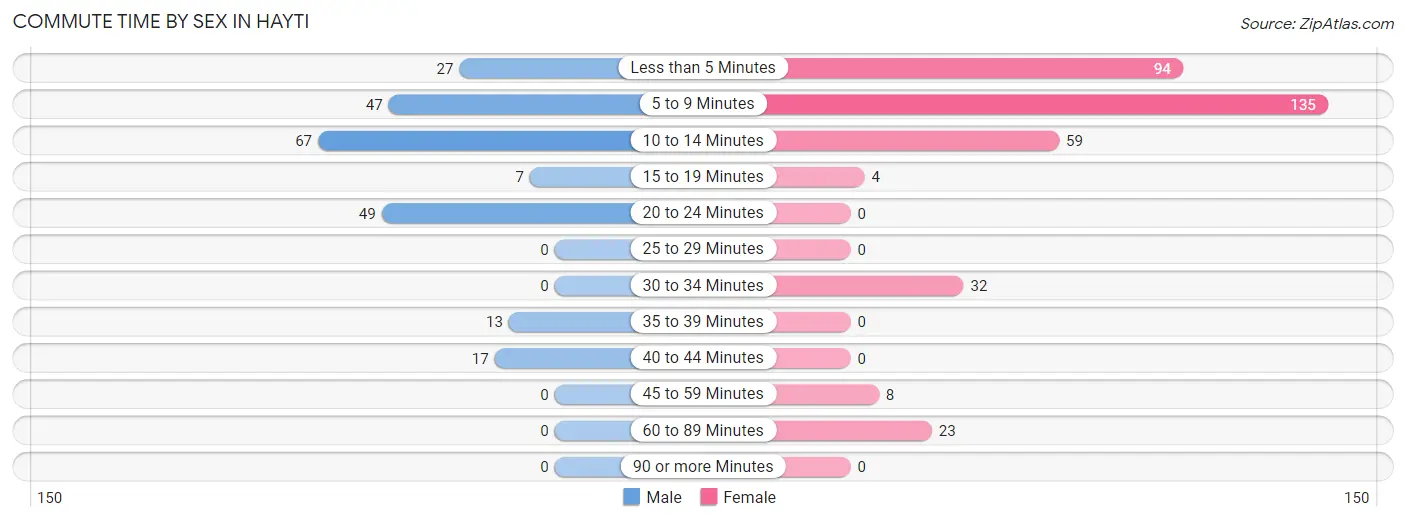
| Commute Time | Male | Female |
| Less than 5 Minutes | 27 (11.9%) | 94 (26.5%) |
| 5 to 9 Minutes | 47 (20.7%) | 135 (38.0%) |
| 10 to 14 Minutes | 67 (29.5%) | 59 (16.6%) |
| 15 to 19 Minutes | 7 (3.1%) | 4 (1.1%) |
| 20 to 24 Minutes | 49 (21.6%) | 0 (0.0%) |
| 25 to 29 Minutes | 0 (0.0%) | 0 (0.0%) |
| 30 to 34 Minutes | 0 (0.0%) | 32 (9.0%) |
| 35 to 39 Minutes | 13 (5.7%) | 0 (0.0%) |
| 40 to 44 Minutes | 17 (7.5%) | 0 (0.0%) |
| 45 to 59 Minutes | 0 (0.0%) | 8 (2.2%) |
| 60 to 89 Minutes | 0 (0.0%) | 23 (6.5%) |
| 90 or more Minutes | 0 (0.0%) | 0 (0.0%) |
Time of Departure to Work by Sex in Hayti
The most frequent times of departure to work in Hayti are 12:00 AM to 4:59 AM (40, 17.6%) for males and 7:30 AM to 7:59 AM (99, 27.9%) for females.
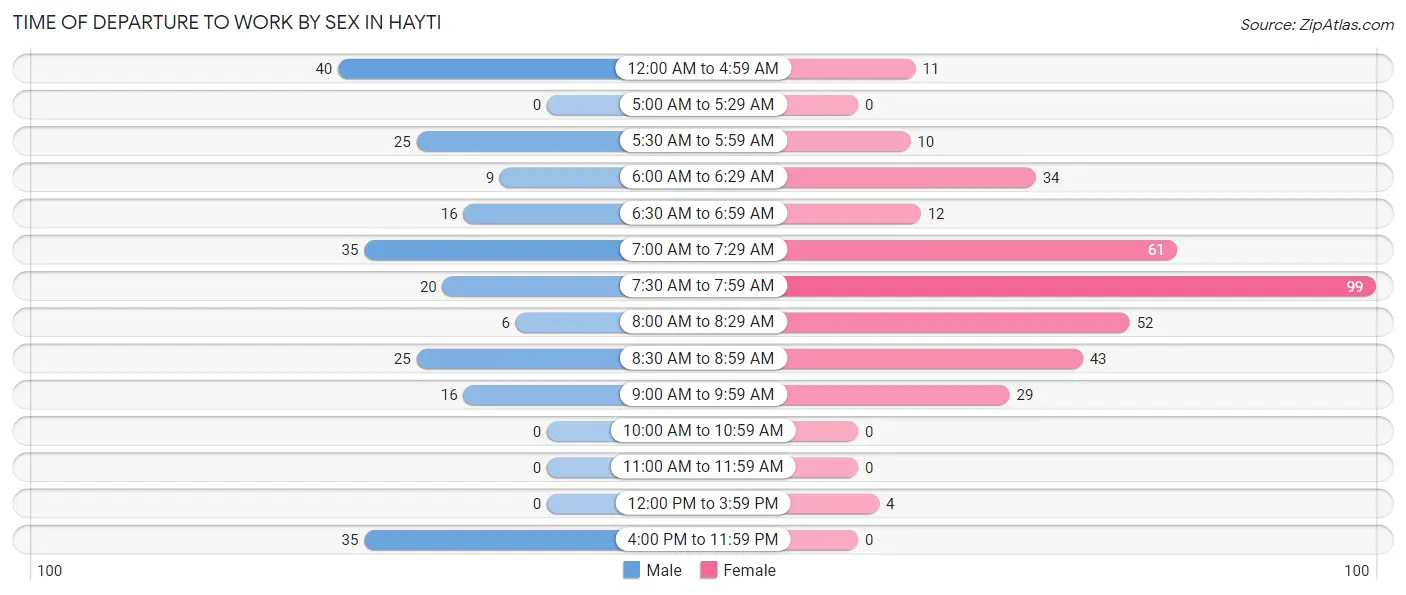
| Time of Departure | Male | Female |
| 12:00 AM to 4:59 AM | 40 (17.6%) | 11 (3.1%) |
| 5:00 AM to 5:29 AM | 0 (0.0%) | 0 (0.0%) |
| 5:30 AM to 5:59 AM | 25 (11.0%) | 10 (2.8%) |
| 6:00 AM to 6:29 AM | 9 (4.0%) | 34 (9.6%) |
| 6:30 AM to 6:59 AM | 16 (7.0%) | 12 (3.4%) |
| 7:00 AM to 7:29 AM | 35 (15.4%) | 61 (17.2%) |
| 7:30 AM to 7:59 AM | 20 (8.8%) | 99 (27.9%) |
| 8:00 AM to 8:29 AM | 6 (2.6%) | 52 (14.6%) |
| 8:30 AM to 8:59 AM | 25 (11.0%) | 43 (12.1%) |
| 9:00 AM to 9:59 AM | 16 (7.0%) | 29 (8.2%) |
| 10:00 AM to 10:59 AM | 0 (0.0%) | 0 (0.0%) |
| 11:00 AM to 11:59 AM | 0 (0.0%) | 0 (0.0%) |
| 12:00 PM to 3:59 PM | 0 (0.0%) | 4 (1.1%) |
| 4:00 PM to 11:59 PM | 35 (15.4%) | 0 (0.0%) |
| Total | 227 (100.0%) | 355 (100.0%) |
Housing Occupancy in Hayti
Occupancy by Ownership in Hayti
Of the total 1,026 dwellings in Hayti, owner-occupied units account for 489 (47.7%), while renter-occupied units make up 537 (52.3%).
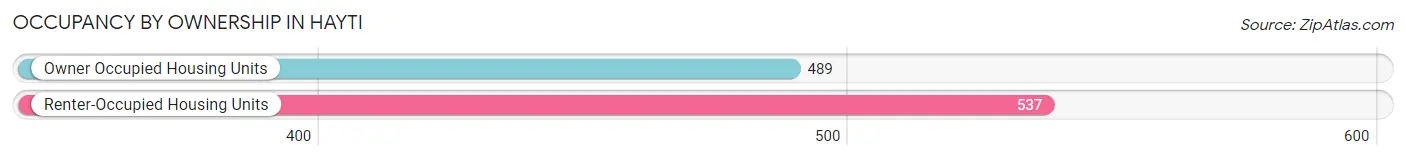
| Occupancy | # Housing Units | % Housing Units |
| Owner Occupied Housing Units | 489 | 47.7% |
| Renter-Occupied Housing Units | 537 | 52.3% |
| Total Occupied Housing Units | 1,026 | 100.0% |
Occupancy by Household Size in Hayti
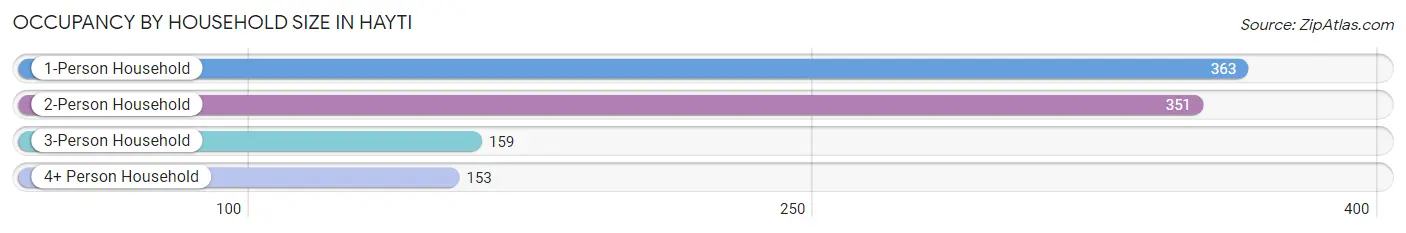
| Household Size | # Housing Units | % Housing Units |
| 1-Person Household | 363 | 35.4% |
| 2-Person Household | 351 | 34.2% |
| 3-Person Household | 159 | 15.5% |
| 4+ Person Household | 153 | 14.9% |
| Total Housing Units | 1,026 | 100.0% |
Occupancy by Ownership by Household Size in Hayti
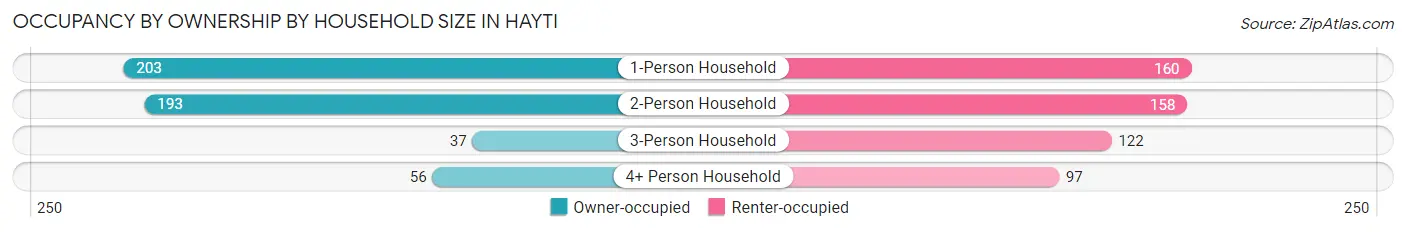
| Household Size | Owner-occupied | Renter-occupied |
| 1-Person Household | 203 (55.9%) | 160 (44.1%) |
| 2-Person Household | 193 (55.0%) | 158 (45.0%) |
| 3-Person Household | 37 (23.3%) | 122 (76.7%) |
| 4+ Person Household | 56 (36.6%) | 97 (63.4%) |
| Total Housing Units | 489 (47.7%) | 537 (52.3%) |
Occupancy by Educational Attainment in Hayti
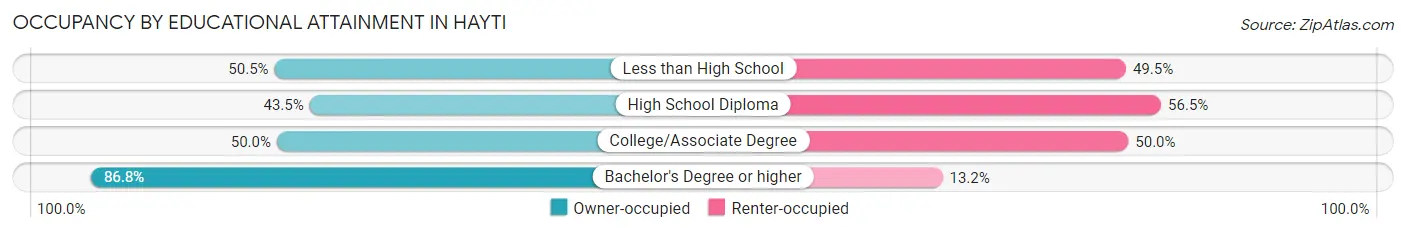
| Household Size | Owner-occupied | Renter-occupied |
| Less than High School | 108 (50.5%) | 106 (49.5%) |
| High School Diploma | 261 (43.5%) | 339 (56.5%) |
| College/Associate Degree | 87 (50.0%) | 87 (50.0%) |
| Bachelor's Degree or higher | 33 (86.8%) | 5 (13.2%) |
Occupancy by Age of Householder in Hayti
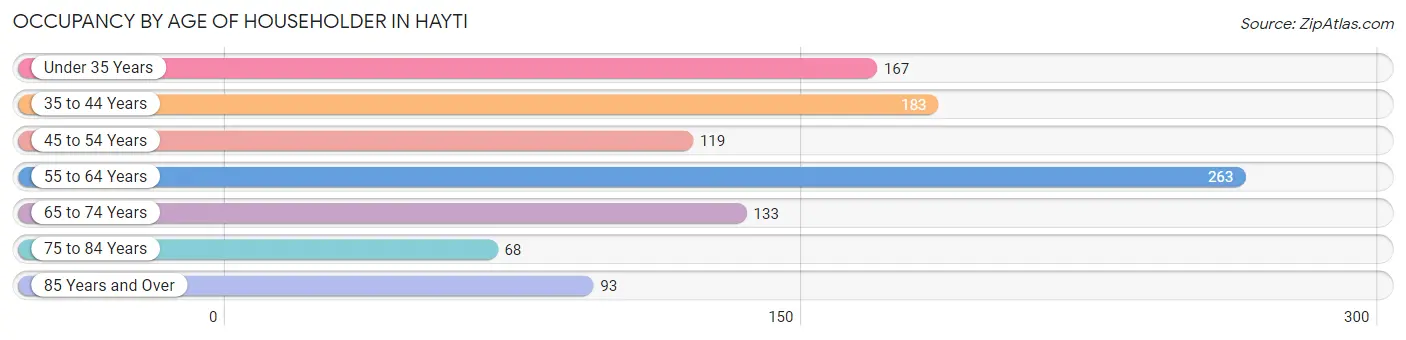
| Age Bracket | # Households | % Households |
| Under 35 Years | 167 | 16.3% |
| 35 to 44 Years | 183 | 17.8% |
| 45 to 54 Years | 119 | 11.6% |
| 55 to 64 Years | 263 | 25.6% |
| 65 to 74 Years | 133 | 13.0% |
| 75 to 84 Years | 68 | 6.6% |
| 85 Years and Over | 93 | 9.1% |
| Total | 1,026 | 100.0% |
Housing Finances in Hayti
Median Income by Occupancy in Hayti
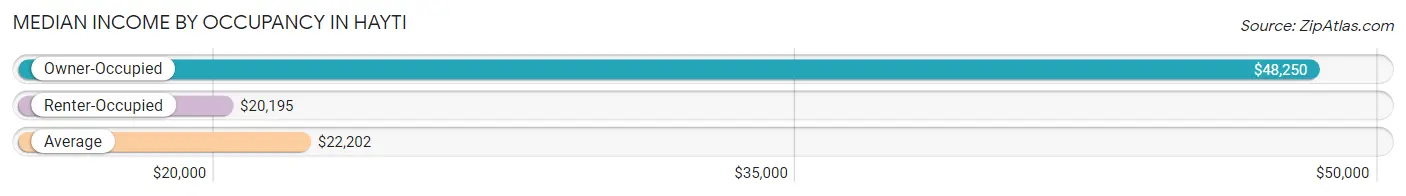
| Occupancy Type | # Households | Median Income |
| Owner-Occupied | 489 (47.7%) | $48,250 |
| Renter-Occupied | 537 (52.3%) | $20,195 |
| Average | 1,026 (100.0%) | $22,202 |
Occupancy by Householder Income Bracket in Hayti
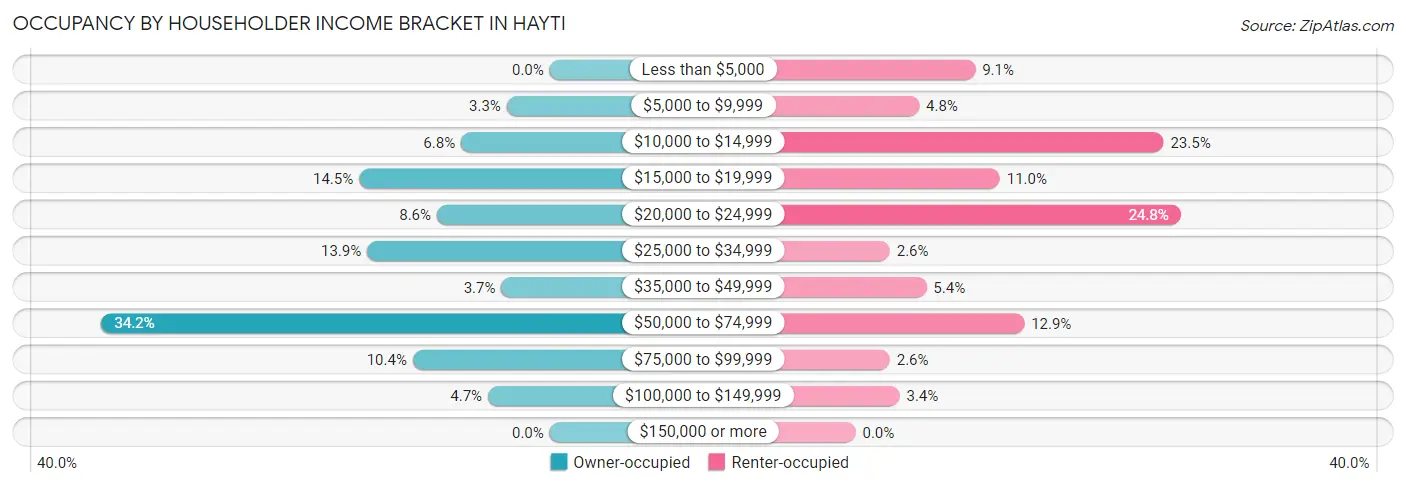
| Income Bracket | Owner-occupied | Renter-occupied |
| Less than $5,000 | 0 (0.0%) | 49 (9.1%) |
| $5,000 to $9,999 | 16 (3.3%) | 26 (4.8%) |
| $10,000 to $14,999 | 33 (6.8%) | 126 (23.5%) |
| $15,000 to $19,999 | 71 (14.5%) | 59 (11.0%) |
| $20,000 to $24,999 | 42 (8.6%) | 133 (24.8%) |
| $25,000 to $34,999 | 68 (13.9%) | 14 (2.6%) |
| $35,000 to $49,999 | 18 (3.7%) | 29 (5.4%) |
| $50,000 to $74,999 | 167 (34.2%) | 69 (12.9%) |
| $75,000 to $99,999 | 51 (10.4%) | 14 (2.6%) |
| $100,000 to $149,999 | 23 (4.7%) | 18 (3.4%) |
| $150,000 or more | 0 (0.0%) | 0 (0.0%) |
| Total | 489 (100.0%) | 537 (100.0%) |
Monthly Housing Cost Tiers in Hayti
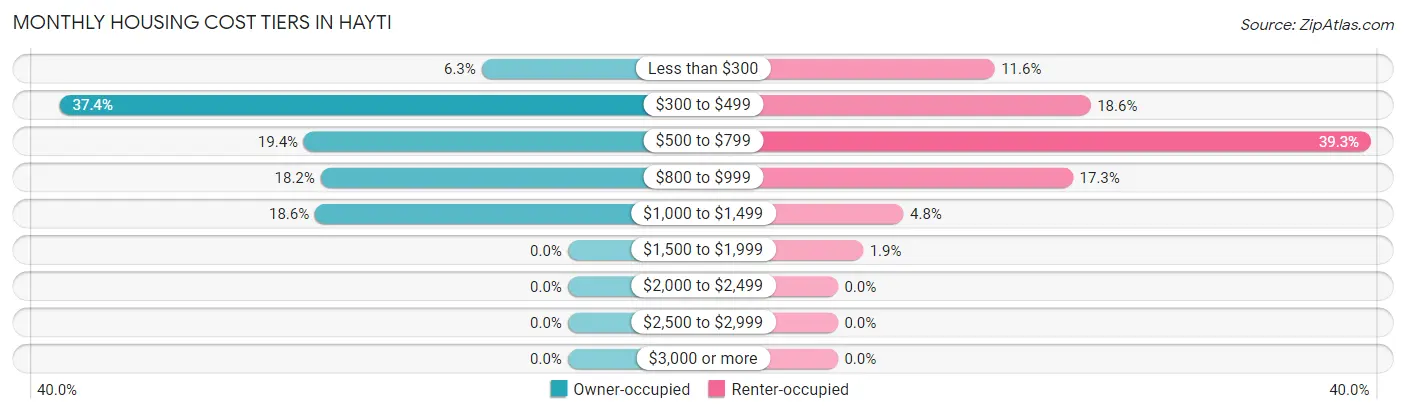
| Monthly Cost | Owner-occupied | Renter-occupied |
| Less than $300 | 31 (6.3%) | 62 (11.6%) |
| $300 to $499 | 183 (37.4%) | 100 (18.6%) |
| $500 to $799 | 95 (19.4%) | 211 (39.3%) |
| $800 to $999 | 89 (18.2%) | 93 (17.3%) |
| $1,000 to $1,499 | 91 (18.6%) | 26 (4.8%) |
| $1,500 to $1,999 | 0 (0.0%) | 10 (1.9%) |
| $2,000 to $2,499 | 0 (0.0%) | 0 (0.0%) |
| $2,500 to $2,999 | 0 (0.0%) | 0 (0.0%) |
| $3,000 or more | 0 (0.0%) | 0 (0.0%) |
| Total | 489 (100.0%) | 537 (100.0%) |
Physical Housing Characteristics in Hayti
Housing Structures in Hayti
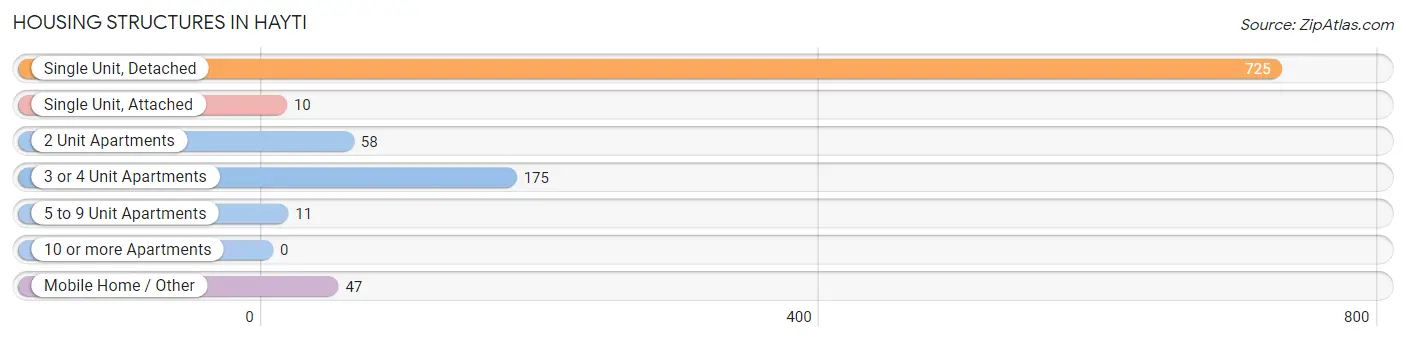
| Structure Type | # Housing Units | % Housing Units |
| Single Unit, Detached | 725 | 70.7% |
| Single Unit, Attached | 10 | 1.0% |
| 2 Unit Apartments | 58 | 5.7% |
| 3 or 4 Unit Apartments | 175 | 17.1% |
| 5 to 9 Unit Apartments | 11 | 1.1% |
| 10 or more Apartments | 0 | 0.0% |
| Mobile Home / Other | 47 | 4.6% |
| Total | 1,026 | 100.0% |
Housing Structures by Occupancy in Hayti
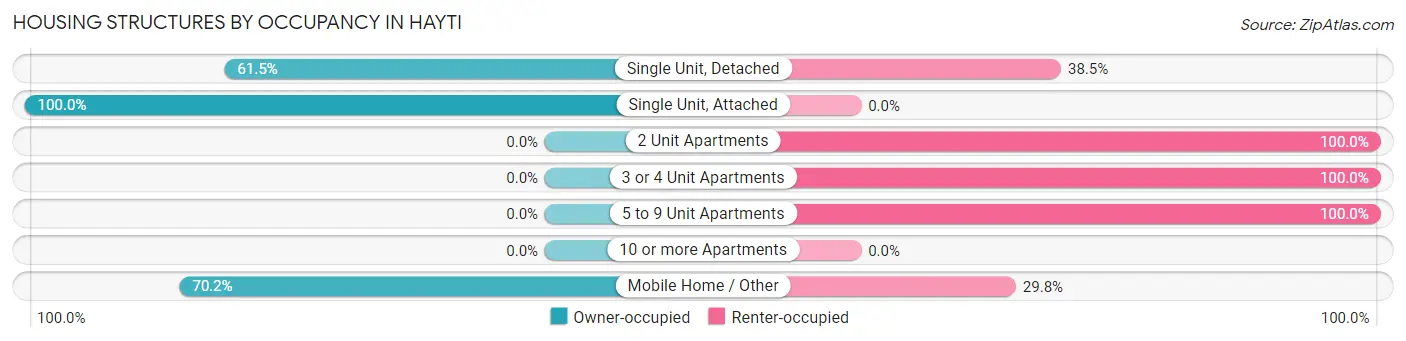
| Structure Type | Owner-occupied | Renter-occupied |
| Single Unit, Detached | 446 (61.5%) | 279 (38.5%) |
| Single Unit, Attached | 10 (100.0%) | 0 (0.0%) |
| 2 Unit Apartments | 0 (0.0%) | 58 (100.0%) |
| 3 or 4 Unit Apartments | 0 (0.0%) | 175 (100.0%) |
| 5 to 9 Unit Apartments | 0 (0.0%) | 11 (100.0%) |
| 10 or more Apartments | 0 (0.0%) | 0 (0.0%) |
| Mobile Home / Other | 33 (70.2%) | 14 (29.8%) |
| Total | 489 (47.7%) | 537 (52.3%) |
Housing Structures by Number of Rooms in Hayti
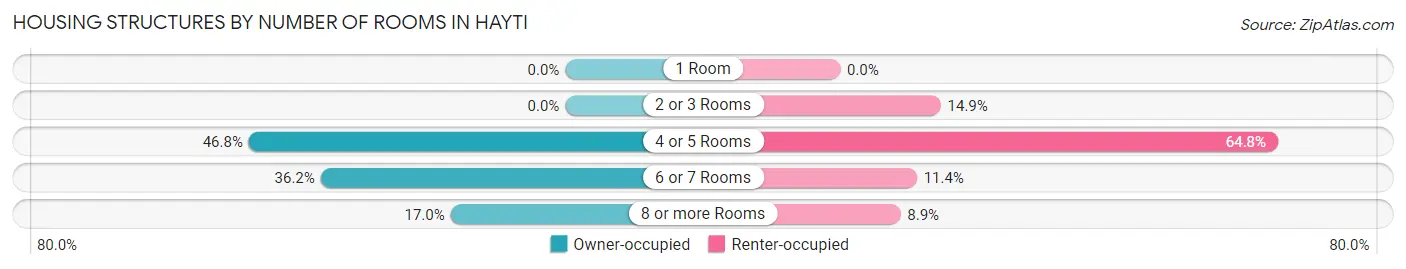
| Number of Rooms | Owner-occupied | Renter-occupied |
| 1 Room | 0 (0.0%) | 0 (0.0%) |
| 2 or 3 Rooms | 0 (0.0%) | 80 (14.9%) |
| 4 or 5 Rooms | 229 (46.8%) | 348 (64.8%) |
| 6 or 7 Rooms | 177 (36.2%) | 61 (11.4%) |
| 8 or more Rooms | 83 (17.0%) | 48 (8.9%) |
| Total | 489 (100.0%) | 537 (100.0%) |
Housing Structure by Heating Type in Hayti
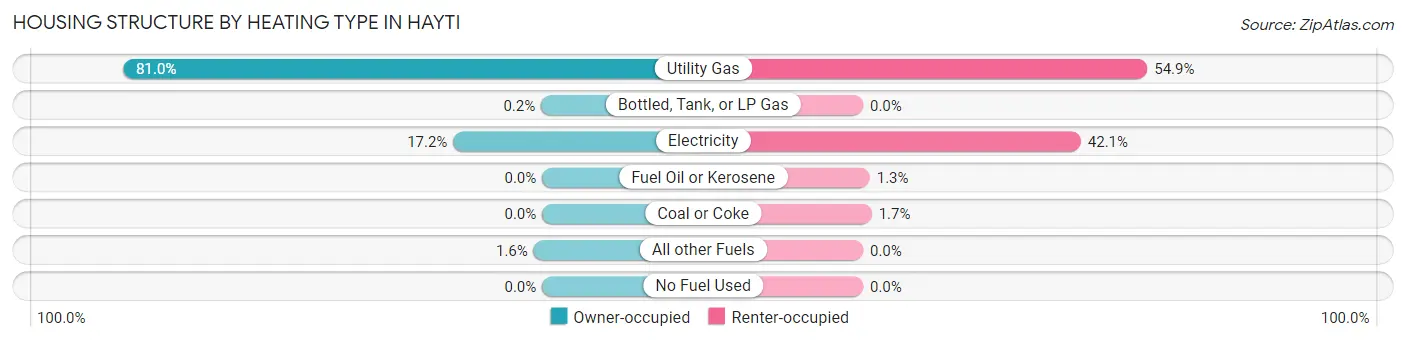
| Heating Type | Owner-occupied | Renter-occupied |
| Utility Gas | 396 (81.0%) | 295 (54.9%) |
| Bottled, Tank, or LP Gas | 1 (0.2%) | 0 (0.0%) |
| Electricity | 84 (17.2%) | 226 (42.1%) |
| Fuel Oil or Kerosene | 0 (0.0%) | 7 (1.3%) |
| Coal or Coke | 0 (0.0%) | 9 (1.7%) |
| All other Fuels | 8 (1.6%) | 0 (0.0%) |
| No Fuel Used | 0 (0.0%) | 0 (0.0%) |
| Total | 489 (100.0%) | 537 (100.0%) |
Household Vehicle Usage in Hayti
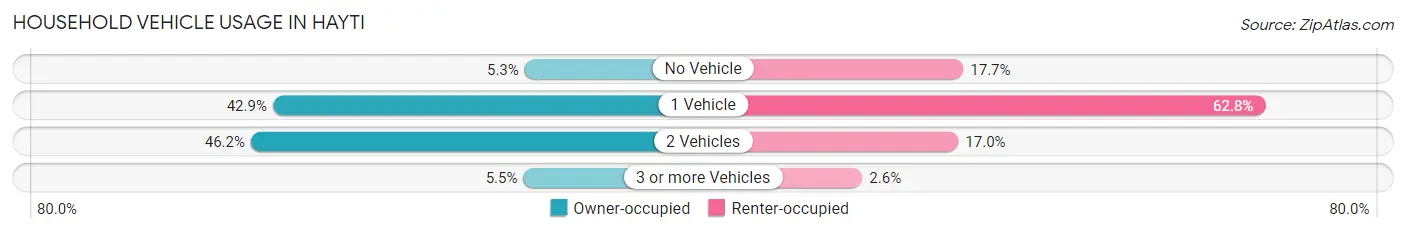
| Vehicles per Household | Owner-occupied | Renter-occupied |
| No Vehicle | 26 (5.3%) | 95 (17.7%) |
| 1 Vehicle | 210 (42.9%) | 337 (62.8%) |
| 2 Vehicles | 226 (46.2%) | 91 (17.0%) |
| 3 or more Vehicles | 27 (5.5%) | 14 (2.6%) |
| Total | 489 (100.0%) | 537 (100.0%) |
Real Estate & Mortgages in Hayti
Real Estate and Mortgage Overview in Hayti
| Characteristic | Without Mortgage | With Mortgage |
| Housing Units | 286 | 203 |
| Median Property Value | $50,600 | $70,500 |
| Median Household Income | $22,143 | $0 |
| Monthly Housing Costs | $426 | $0 |
| Real Estate Taxes | $503 | $0 |
Property Value by Mortgage Status in Hayti
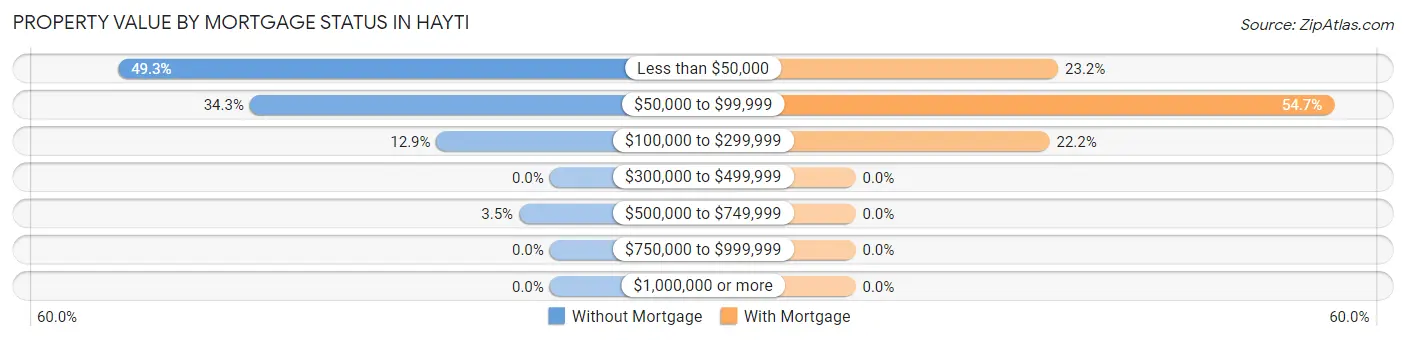
| Property Value | Without Mortgage | With Mortgage |
| Less than $50,000 | 141 (49.3%) | 47 (23.2%) |
| $50,000 to $99,999 | 98 (34.3%) | 111 (54.7%) |
| $100,000 to $299,999 | 37 (12.9%) | 45 (22.2%) |
| $300,000 to $499,999 | 0 (0.0%) | 0 (0.0%) |
| $500,000 to $749,999 | 10 (3.5%) | 0 (0.0%) |
| $750,000 to $999,999 | 0 (0.0%) | 0 (0.0%) |
| $1,000,000 or more | 0 (0.0%) | 0 (0.0%) |
| Total | 286 (100.0%) | 203 (100.0%) |
Household Income by Mortgage Status in Hayti
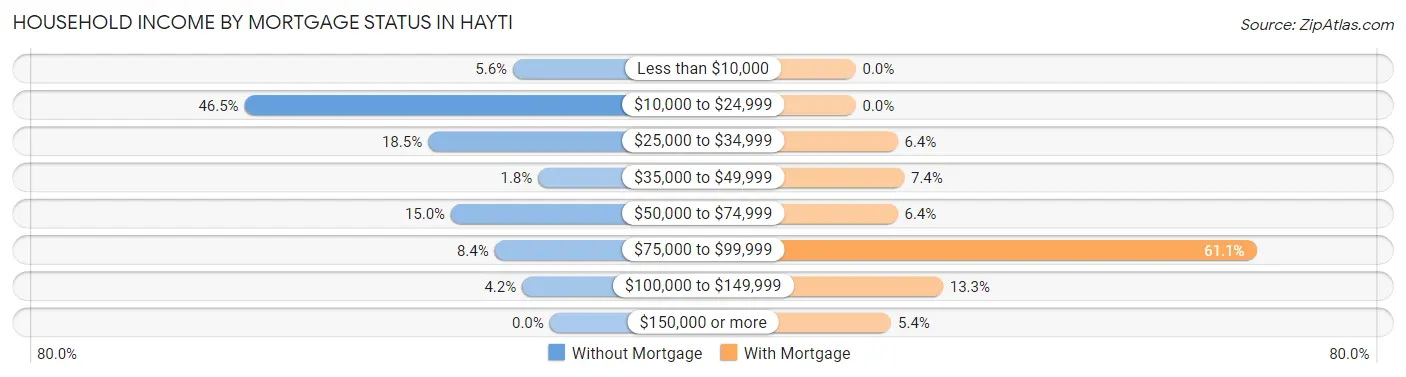
| Household Income | Without Mortgage | With Mortgage |
| Less than $10,000 | 16 (5.6%) | 0 (0.0%) |
| $10,000 to $24,999 | 133 (46.5%) | 0 (0.0%) |
| $25,000 to $34,999 | 53 (18.5%) | 13 (6.4%) |
| $35,000 to $49,999 | 5 (1.8%) | 15 (7.4%) |
| $50,000 to $74,999 | 43 (15.0%) | 13 (6.4%) |
| $75,000 to $99,999 | 24 (8.4%) | 124 (61.1%) |
| $100,000 to $149,999 | 12 (4.2%) | 27 (13.3%) |
| $150,000 or more | 0 (0.0%) | 11 (5.4%) |
| Total | 286 (100.0%) | 203 (100.0%) |
Property Value to Household Income Ratio in Hayti
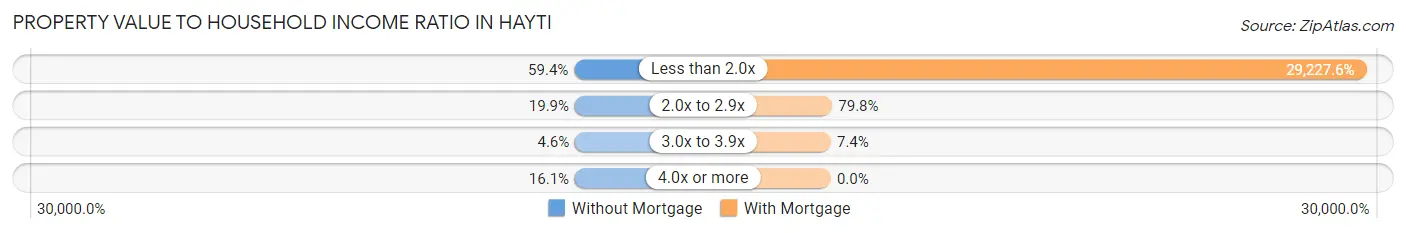
| Value-to-Income Ratio | Without Mortgage | With Mortgage |
| Less than 2.0x | 170 (59.4%) | 59,332 (29,227.6%) |
| 2.0x to 2.9x | 57 (19.9%) | 162 (79.8%) |
| 3.0x to 3.9x | 13 (4.5%) | 15 (7.4%) |
| 4.0x or more | 46 (16.1%) | 0 (0.0%) |
| Total | 286 (100.0%) | 203 (100.0%) |
Real Estate Taxes by Mortgage Status in Hayti
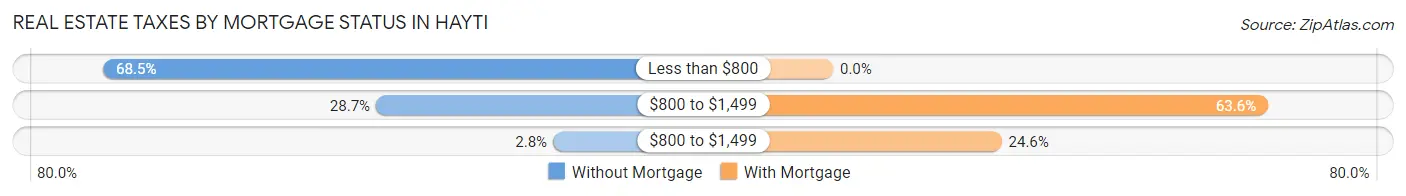
| Property Taxes | Without Mortgage | With Mortgage |
| Less than $800 | 196 (68.5%) | 0 (0.0%) |
| $800 to $1,499 | 82 (28.7%) | 129 (63.5%) |
| $800 to $1,499 | 8 (2.8%) | 50 (24.6%) |
| Total | 286 (100.0%) | 203 (100.0%) |
Health & Disability in Hayti
Health Insurance Coverage by Age in Hayti
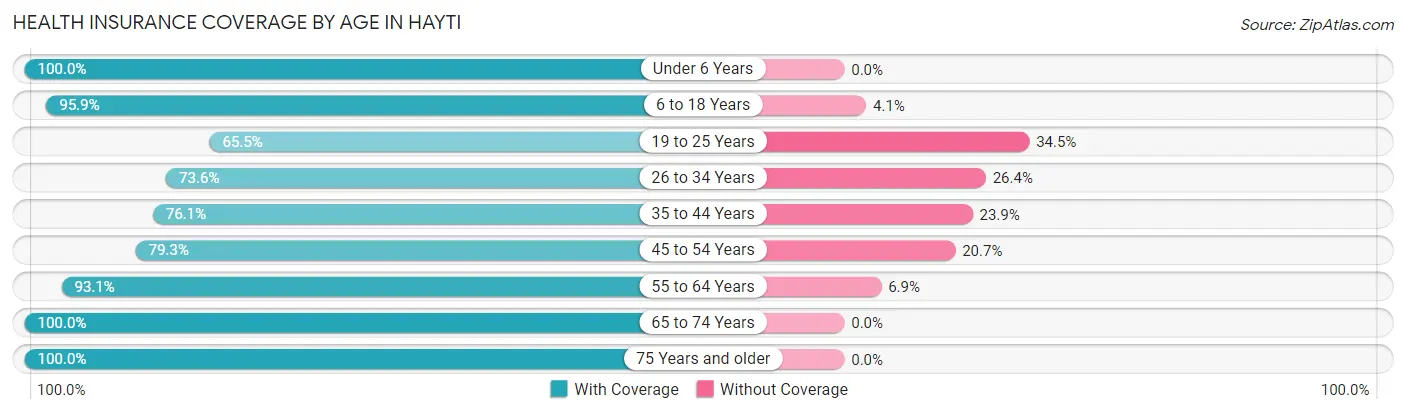
| Age Bracket | With Coverage | Without Coverage |
| Under 6 Years | 243 (100.0%) | 0 (0.0%) |
| 6 to 18 Years | 543 (95.9%) | 23 (4.1%) |
| 19 to 25 Years | 57 (65.5%) | 30 (34.5%) |
| 26 to 34 Years | 120 (73.6%) | 43 (26.4%) |
| 35 to 44 Years | 210 (76.1%) | 66 (23.9%) |
| 45 to 54 Years | 184 (79.3%) | 48 (20.7%) |
| 55 to 64 Years | 379 (93.1%) | 28 (6.9%) |
| 65 to 74 Years | 175 (100.0%) | 0 (0.0%) |
| 75 Years and older | 191 (100.0%) | 0 (0.0%) |
| Total | 2,102 (89.8%) | 238 (10.2%) |
Health Insurance Coverage by Citizenship Status in Hayti
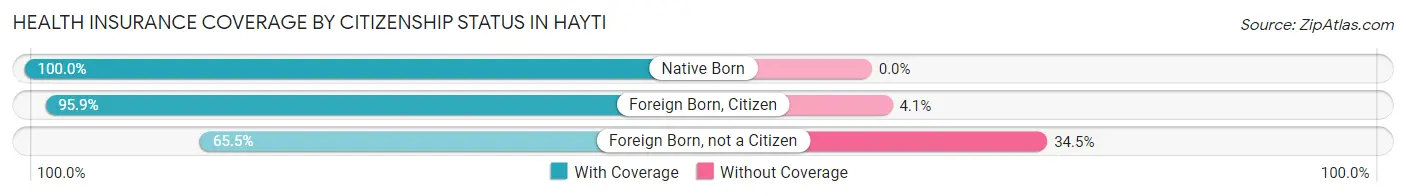
| Citizenship Status | With Coverage | Without Coverage |
| Native Born | 243 (100.0%) | 0 (0.0%) |
| Foreign Born, Citizen | 543 (95.9%) | 23 (4.1%) |
| Foreign Born, not a Citizen | 57 (65.5%) | 30 (34.5%) |
Health Insurance Coverage by Household Income in Hayti
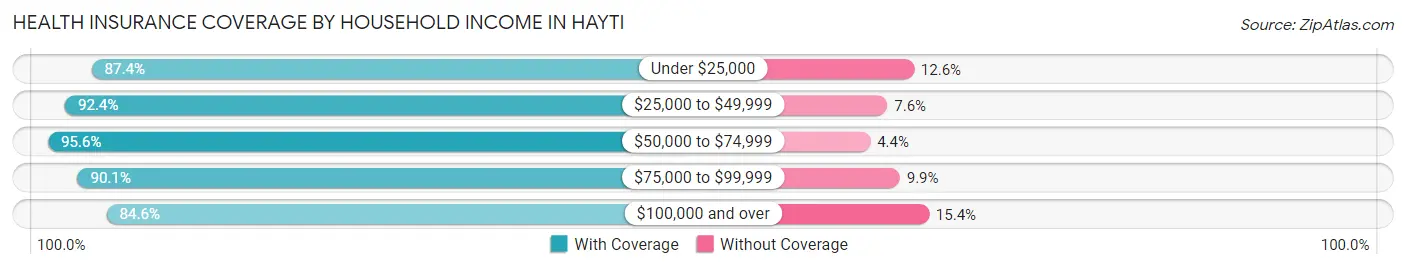
| Household Income | With Coverage | Without Coverage |
| Under $25,000 | 1,113 (87.4%) | 160 (12.6%) |
| $25,000 to $49,999 | 280 (92.4%) | 23 (7.6%) |
| $50,000 to $74,999 | 479 (95.6%) | 22 (4.4%) |
| $75,000 to $99,999 | 127 (90.1%) | 14 (9.9%) |
| $100,000 and over | 88 (84.6%) | 16 (15.4%) |
Public vs Private Health Insurance Coverage by Age in Hayti
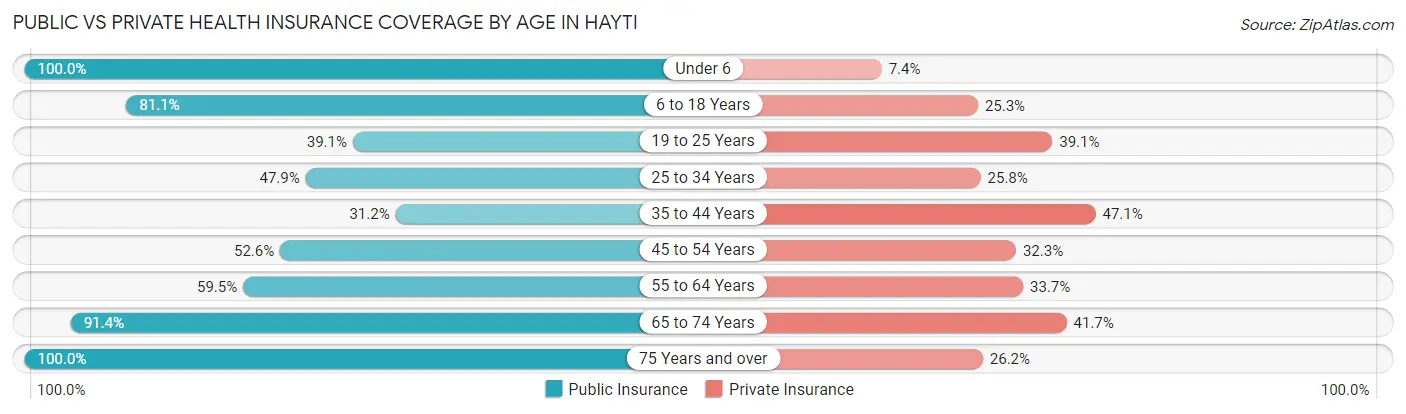
| Age Bracket | Public Insurance | Private Insurance |
| Under 6 | 243 (100.0%) | 18 (7.4%) |
| 6 to 18 Years | 459 (81.1%) | 143 (25.3%) |
| 19 to 25 Years | 34 (39.1%) | 34 (39.1%) |
| 25 to 34 Years | 78 (47.8%) | 42 (25.8%) |
| 35 to 44 Years | 86 (31.2%) | 130 (47.1%) |
| 45 to 54 Years | 122 (52.6%) | 75 (32.3%) |
| 55 to 64 Years | 242 (59.5%) | 137 (33.7%) |
| 65 to 74 Years | 160 (91.4%) | 73 (41.7%) |
| 75 Years and over | 191 (100.0%) | 50 (26.2%) |
| Total | 1,615 (69.0%) | 702 (30.0%) |
Disability Status by Sex by Age in Hayti
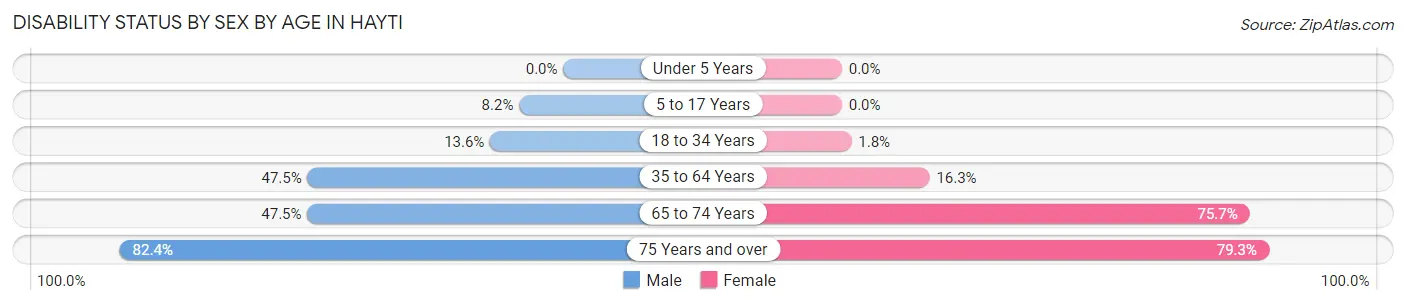
| Age Bracket | Male | Female |
| Under 5 Years | 0 (0.0%) | 0 (0.0%) |
| 5 to 17 Years | 33 (8.2%) | 0 (0.0%) |
| 18 to 34 Years | 11 (13.6%) | 3 (1.8%) |
| 35 to 64 Years | 198 (47.5%) | 81 (16.3%) |
| 65 to 74 Years | 48 (47.5%) | 56 (75.7%) |
| 75 Years and over | 70 (82.4%) | 84 (79.2%) |
Disability Class by Sex by Age in Hayti
Disability Class: Hearing Difficulty
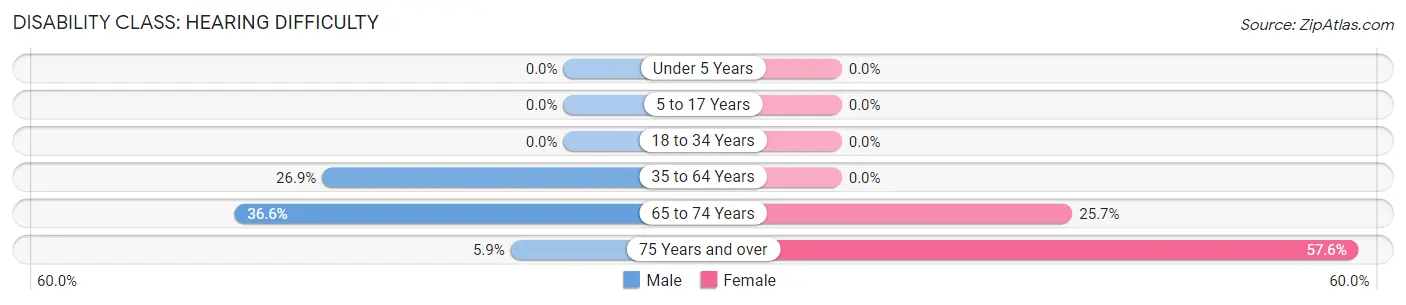
| Age Bracket | Male | Female |
| Under 5 Years | 0 (0.0%) | 0 (0.0%) |
| 5 to 17 Years | 0 (0.0%) | 0 (0.0%) |
| 18 to 34 Years | 0 (0.0%) | 0 (0.0%) |
| 35 to 64 Years | 112 (26.9%) | 0 (0.0%) |
| 65 to 74 Years | 37 (36.6%) | 19 (25.7%) |
| 75 Years and over | 5 (5.9%) | 61 (57.6%) |
Disability Class: Vision Difficulty
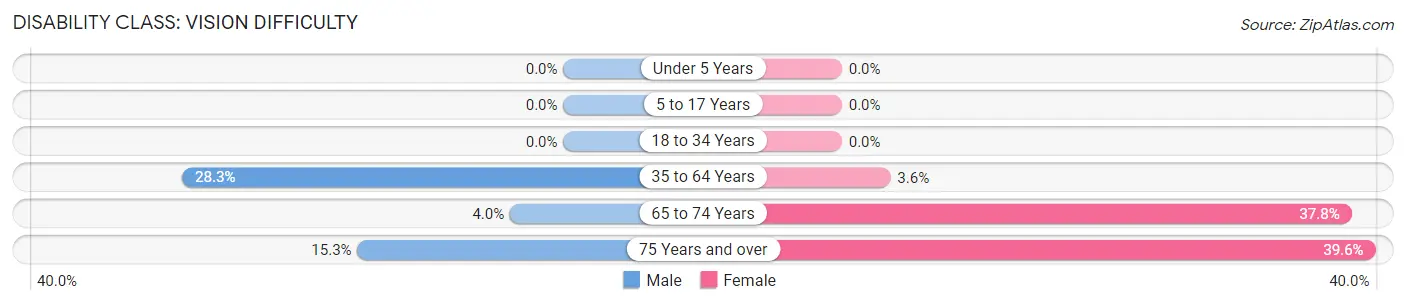
| Age Bracket | Male | Female |
| Under 5 Years | 0 (0.0%) | 0 (0.0%) |
| 5 to 17 Years | 0 (0.0%) | 0 (0.0%) |
| 18 to 34 Years | 0 (0.0%) | 0 (0.0%) |
| 35 to 64 Years | 118 (28.3%) | 18 (3.6%) |
| 65 to 74 Years | 4 (4.0%) | 28 (37.8%) |
| 75 Years and over | 13 (15.3%) | 42 (39.6%) |
Disability Class: Cognitive Difficulty
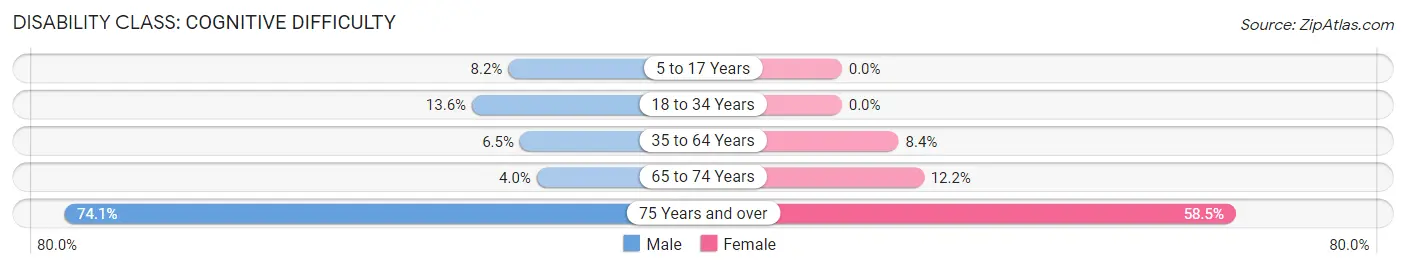
| Age Bracket | Male | Female |
| 5 to 17 Years | 33 (8.2%) | 0 (0.0%) |
| 18 to 34 Years | 11 (13.6%) | 0 (0.0%) |
| 35 to 64 Years | 27 (6.5%) | 42 (8.4%) |
| 65 to 74 Years | 4 (4.0%) | 9 (12.2%) |
| 75 Years and over | 63 (74.1%) | 62 (58.5%) |
Disability Class: Ambulatory Difficulty
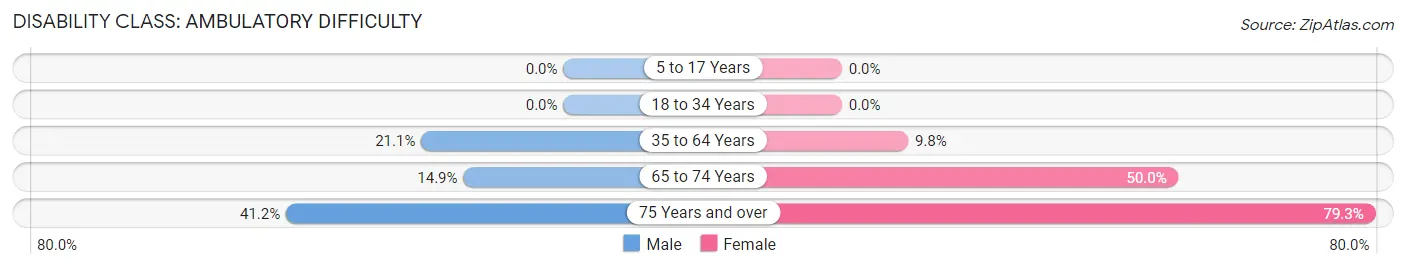
| Age Bracket | Male | Female |
| 5 to 17 Years | 0 (0.0%) | 0 (0.0%) |
| 18 to 34 Years | 0 (0.0%) | 0 (0.0%) |
| 35 to 64 Years | 88 (21.1%) | 49 (9.8%) |
| 65 to 74 Years | 15 (14.8%) | 37 (50.0%) |
| 75 Years and over | 35 (41.2%) | 84 (79.2%) |
Disability Class: Self-Care Difficulty
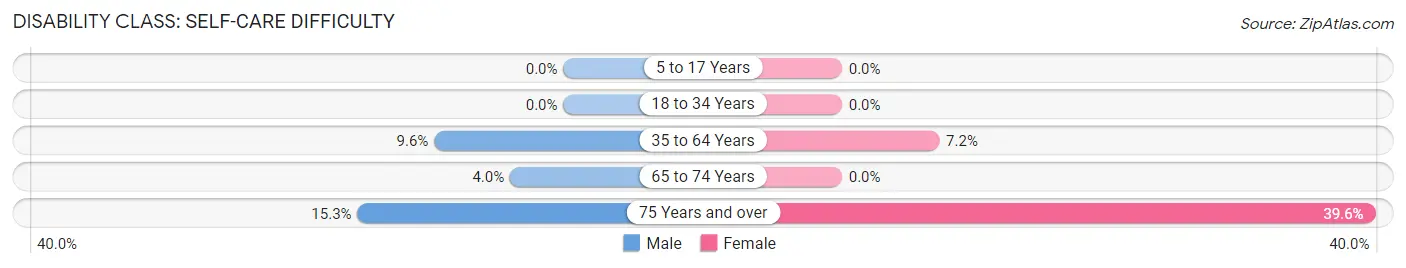
| Age Bracket | Male | Female |
| 5 to 17 Years | 0 (0.0%) | 0 (0.0%) |
| 18 to 34 Years | 0 (0.0%) | 0 (0.0%) |
| 35 to 64 Years | 40 (9.6%) | 36 (7.2%) |
| 65 to 74 Years | 4 (4.0%) | 0 (0.0%) |
| 75 Years and over | 13 (15.3%) | 42 (39.6%) |
Technology Access in Hayti
Computing Device Access in Hayti
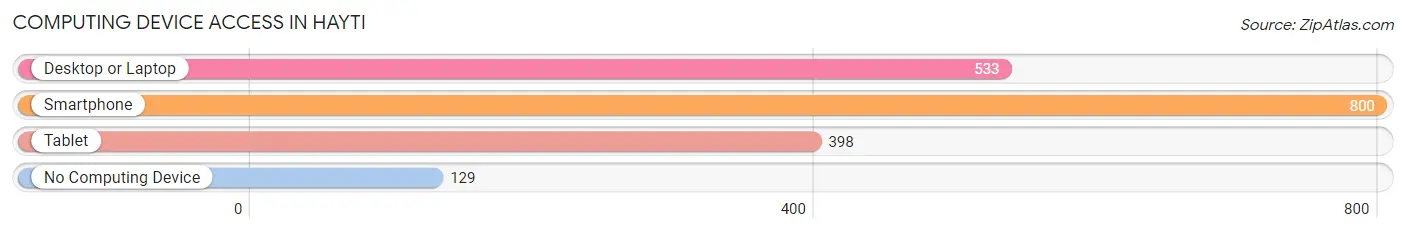
| Device Type | # Households | % Households |
| Desktop or Laptop | 533 | 51.9% |
| Smartphone | 800 | 78.0% |
| Tablet | 398 | 38.8% |
| No Computing Device | 129 | 12.6% |
| Total | 1,026 | 100.0% |
Internet Access in Hayti
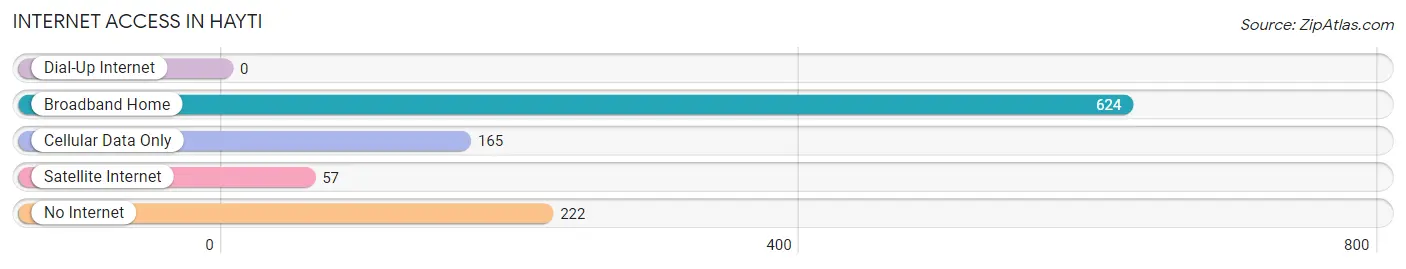
| Internet Type | # Households | % Households |
| Dial-Up Internet | 0 | 0.0% |
| Broadband Home | 624 | 60.8% |
| Cellular Data Only | 165 | 16.1% |
| Satellite Internet | 57 | 5.6% |
| No Internet | 222 | 21.6% |
| Total | 1,026 | 100.0% |
Hayti Summary
HISTORY
The small town of Hayti, Missouri is located in the southeastern corner of the state, in Pemiscot County. It is situated on the banks of the Mississippi River, and is part of the Bootheel region of Missouri. The town was founded in 1882 by the St. Louis and Iron Mountain Railroad, and was named after the African nation of Haiti. The town was originally a railroad stop, and was a popular destination for African Americans who were looking for work in the area.
The town of Hayti was a thriving community in the early 20th century, with a population of over 2,000 people. It was home to a variety of businesses, including a bank, a hotel, a movie theater, and a variety of stores. The town was also home to a number of churches, including the First Baptist Church, which was founded in 1883.
In the early 1900s, Hayti was a center of African American culture and education. It was home to the Hayti Normal and Industrial Institute, which was founded in 1902 and was the first African American school in the state of Missouri. The school was a center of learning for African Americans, and was a major contributor to the development of the town.
The town of Hayti was also home to a number of prominent African American leaders, including Dr. George Washington Carver, who was born in the town in 1864. Carver was a renowned scientist and inventor, and is best known for his work with peanuts and other agricultural products.
In the mid-20th century, the town of Hayti began to decline. The railroad stopped running through the town, and the population began to dwindle. By the 1970s, the population had dropped to just over 1,000 people.
GEOGRAPHY
The town of Hayti is located in the southeastern corner of Missouri, in Pemiscot County. It is situated on the banks of the Mississippi River, and is part of the Bootheel region of Missouri. The town is located about 25 miles south of the city of Caruthersville, and about 50 miles north of Memphis, Tennessee.
The town of Hayti is located in a flat, low-lying area, and is surrounded by farmland. The town is located in a humid subtropical climate, with hot, humid summers and mild winters. The average annual temperature is around 64 degrees Fahrenheit, and the average annual precipitation is around 45 inches.
ECONOMY
The economy of Hayti is largely based on agriculture. The town is surrounded by farmland, and the main crops grown in the area are cotton, soybeans, and corn. The town is also home to a number of small businesses, including restaurants, convenience stores, and auto repair shops.
The town of Hayti is also home to a number of manufacturing companies, including a furniture factory and a plastics factory. The town is also home to a number of small businesses, including a grocery store, a hardware store, and a variety of other retail stores.
DEMOGRAPHICS
As of the 2010 census, the town of Hayti had a population of 1,092 people. The population is largely African American, with a small percentage of white and Hispanic residents. The median household income in the town is around $25,000, and the median home value is around $50,000. The town has a poverty rate of around 25%, and the unemployment rate is around 10%.
Common Questions
What is Per Capita Income in Hayti?
Per Capita income in Hayti is $15,589.
What is the Median Family Income in Hayti?
Median Family Income in Hayti is $27,583.
What is the Median Household income in Hayti?
Median Household Income in Hayti is $22,202.
What is Income or Wage Gap in Hayti?
Income or Wage Gap in Hayti is 58.8%.
Women in Hayti earn 41.2 cents for every dollar earned by a man.
What is Inequality or Gini Index in Hayti?
Inequality or Gini Index in Hayti is 0.43.
What is the Total Population of Hayti?
Total Population of Hayti is 2,367.
What is the Total Male Population of Hayti?
Total Male Population of Hayti is 1,164.
What is the Total Female Population of Hayti?
Total Female Population of Hayti is 1,203.
What is the Ratio of Males per 100 Females in Hayti?
There are 96.76 Males per 100 Females in Hayti.
What is the Ratio of Females per 100 Males in Hayti?
There are 103.35 Females per 100 Males in Hayti.
What is the Median Population Age in Hayti?
Median Population Age in Hayti is 42.7 Years.
What is the Average Family Size in Hayti
Average Family Size in Hayti is 3.0 People.
What is the Average Household Size in Hayti
Average Household Size in Hayti is 2.3 People.
How Large is the Labor Force in Hayti?
There are 697 People in the Labor Forcein in Hayti.
What is the Percentage of People in the Labor Force in Hayti?
41.2% of People are in the Labor Force in Hayti.
What is the Unemployment Rate in Hayti?
Unemployment Rate in Hayti is 12.5%.