Bismarck, MO Map & Demographics
Bismarck Map
Bismarck Overview
$18,838
PER CAPITA INCOME
$58,966
AVG FAMILY INCOME
$42,188
AVG HOUSEHOLD INCOME
2.6%
WAGE / INCOME GAP [ % ]
97.4¢/ $1
WAGE / INCOME GAP [ $ ]
$8,676
FAMILY INCOME DEFICIT
0.37
INEQUALITY / GINI INDEX
1,617
TOTAL POPULATION
738
MALE POPULATION
879
FEMALE POPULATION
83.96
MALES / 100 FEMALES
119.11
FEMALES / 100 MALES
35.1
MEDIAN AGE
3.5
AVG FAMILY SIZE
2.7
AVG HOUSEHOLD SIZE
662
LABOR FORCE [ PEOPLE ]
55.5%
PERCENT IN LABOR FORCE
3.9%
UNEMPLOYMENT RATE
Bismarck Zip Codes
Bismarck Area Codes
Income in Bismarck
Income Overview in Bismarck
Per Capita Income in Bismarck is $18,838, while median incomes of families and households are $58,966 and $42,188 respectively.
| Characteristic | Number | Measure |
| Per Capita Income | 1,617 | $18,838 |
| Median Family Income | 390 | $58,966 |
| Mean Family Income | 390 | $61,382 |
| Median Household Income | 589 | $42,188 |
| Mean Household Income | 589 | $50,634 |
| Income Deficit | 390 | $8,676 |
| Wage / Income Gap (%) | 1,617 | 2.56% |
| Wage / Income Gap ($) | 1,617 | 97.44¢ per $1 |
| Gini / Inequality Index | 1,617 | 0.37 |
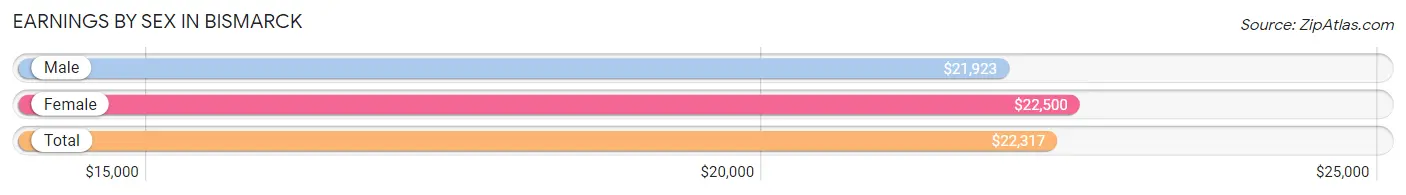
Earnings by Sex in Bismarck
Average Earnings in Bismarck are $22,317, $21,923 for men and $22,500 for women, a difference of 2.6%.
| Sex | Number | Average Earnings |
| Male | 304 (43.7%) | $21,923 |
| Female | 392 (56.3%) | $22,500 |
| Total | 696 (100.0%) | $22,317 |
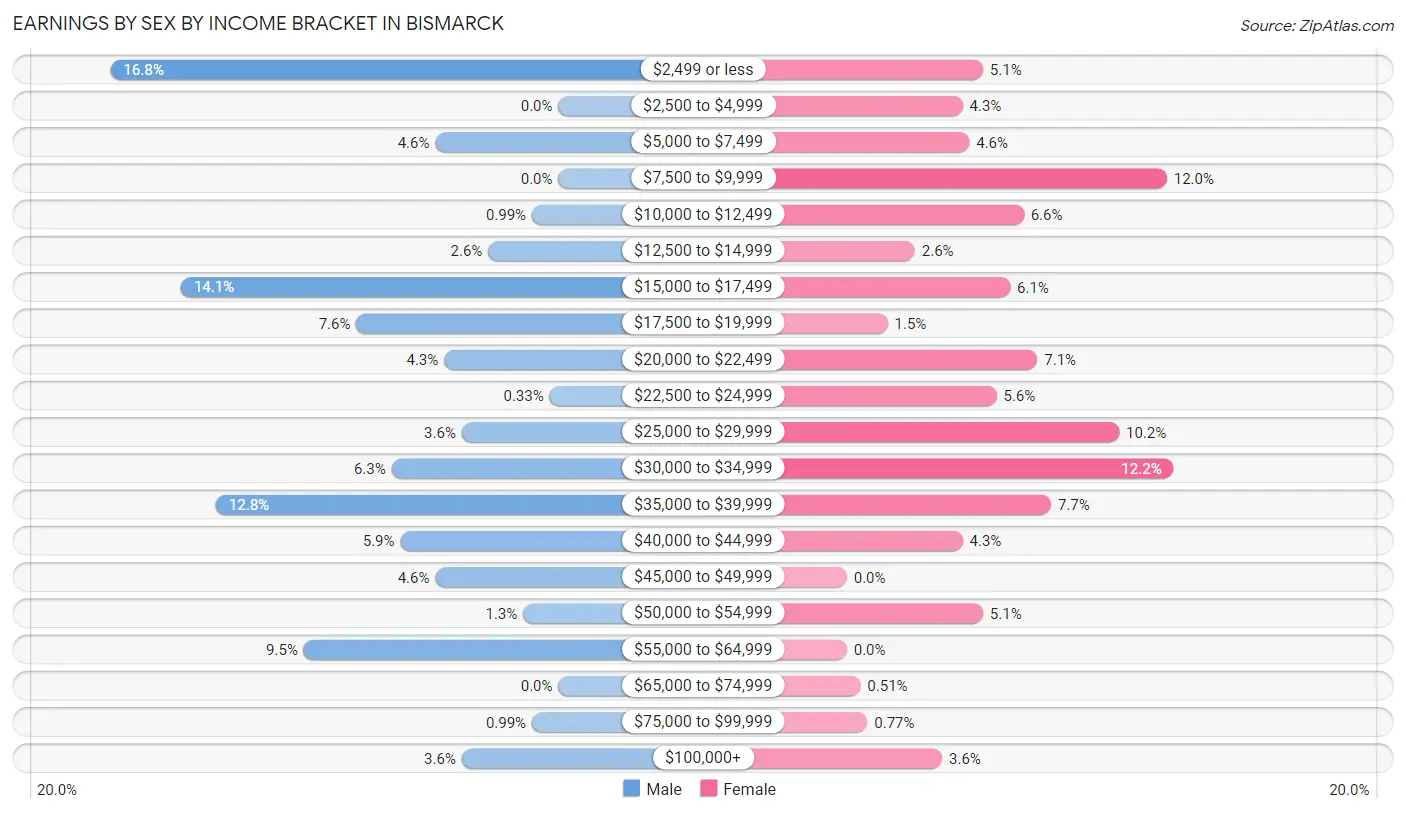
Earnings by Sex by Income Bracket in Bismarck
The most common earnings brackets in Bismarck are $2,499 or less for men (51 | 16.8%) and $30,000 to $34,999 for women (48 | 12.2%).
| Income | Male | Female |
| $2,499 or less | 51 (16.8%) | 20 (5.1%) |
| $2,500 to $4,999 | 0 (0.0%) | 17 (4.3%) |
| $5,000 to $7,499 | 14 (4.6%) | 18 (4.6%) |
| $7,500 to $9,999 | 0 (0.0%) | 47 (12.0%) |
| $10,000 to $12,499 | 3 (1.0%) | 26 (6.6%) |
| $12,500 to $14,999 | 8 (2.6%) | 10 (2.5%) |
| $15,000 to $17,499 | 43 (14.1%) | 24 (6.1%) |
| $17,500 to $19,999 | 23 (7.6%) | 6 (1.5%) |
| $20,000 to $22,499 | 13 (4.3%) | 28 (7.1%) |
| $22,500 to $24,999 | 1 (0.3%) | 22 (5.6%) |
| $25,000 to $29,999 | 11 (3.6%) | 40 (10.2%) |
| $30,000 to $34,999 | 19 (6.2%) | 48 (12.2%) |
| $35,000 to $39,999 | 39 (12.8%) | 30 (7.6%) |
| $40,000 to $44,999 | 18 (5.9%) | 17 (4.3%) |
| $45,000 to $49,999 | 14 (4.6%) | 0 (0.0%) |
| $50,000 to $54,999 | 4 (1.3%) | 20 (5.1%) |
| $55,000 to $64,999 | 29 (9.5%) | 0 (0.0%) |
| $65,000 to $74,999 | 0 (0.0%) | 2 (0.5%) |
| $75,000 to $99,999 | 3 (1.0%) | 3 (0.8%) |
| $100,000+ | 11 (3.6%) | 14 (3.6%) |
| Total | 304 (100.0%) | 392 (100.0%) |
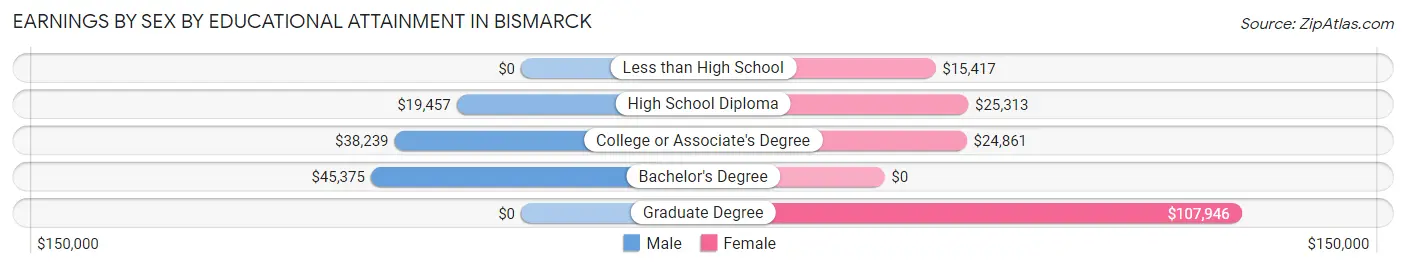
Earnings by Sex by Educational Attainment in Bismarck
Average earnings in Bismarck are $31,429 for men and $25,163 for women, a difference of 19.9%. Men with an educational attainment of bachelor's degree enjoy the highest average annual earnings of $45,375, while those with high school diploma education earn the least with $19,457. Women with an educational attainment of graduate degree earn the most with the average annual earnings of $107,946, while those with less than high school education have the smallest earnings of $15,417.
| Educational Attainment | Male Income | Female Income |
| Less than High School | - | - |
| High School Diploma | $19,457 | $25,313 |
| College or Associate's Degree | $38,239 | $24,861 |
| Bachelor's Degree | $45,375 | $0 |
| Graduate Degree | - | - |
| Total | $31,429 | $25,163 |
Family Income in Bismarck
Family Income Brackets in Bismarck
According to the Bismarck family income data, there are 107 families falling into the $50,000 to $74,999 income range, which is the most common income bracket and makes up 27.4% of all families.
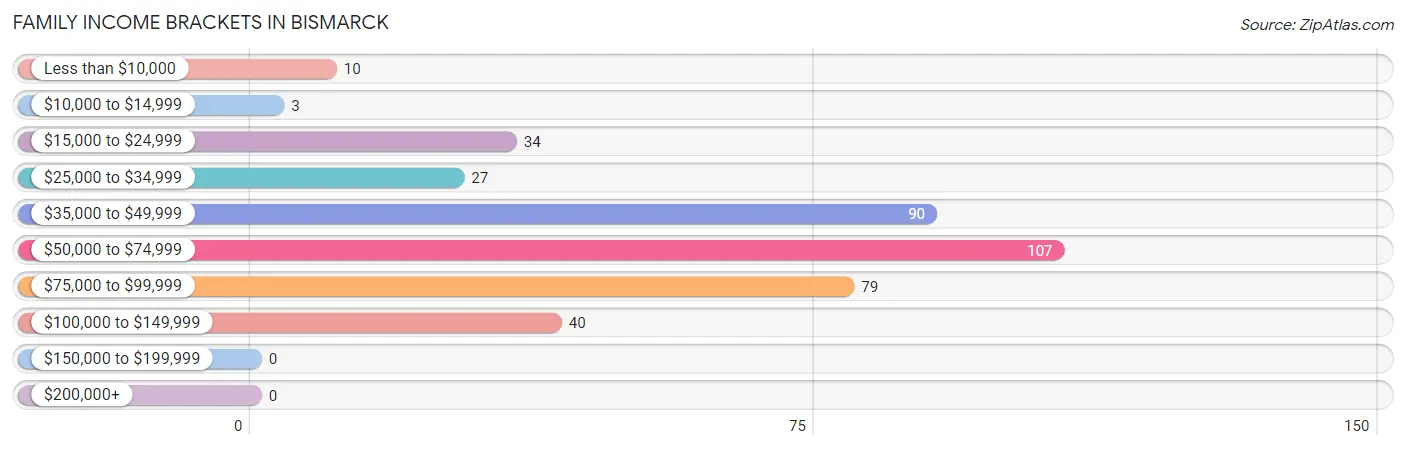
| Income Bracket | # Families | % Families |
| Less than $10,000 | 10 | 2.6% |
| $10,000 to $14,999 | 3 | 0.8% |
| $15,000 to $24,999 | 34 | 8.7% |
| $25,000 to $34,999 | 27 | 6.9% |
| $35,000 to $49,999 | 90 | 23.1% |
| $50,000 to $74,999 | 107 | 27.4% |
| $75,000 to $99,999 | 79 | 20.3% |
| $100,000 to $149,999 | 40 | 10.3% |
| $150,000 to $199,999 | 0 | 0.0% |
| $200,000+ | 0 | 0.0% |
Family Income by Famaliy Size in Bismarck
2-person families (139 | 35.6%) account for the highest median family income in Bismarck with $79,375 per family, while 2-person families (139 | 35.6%) have the highest median income of $39,688 per family member.
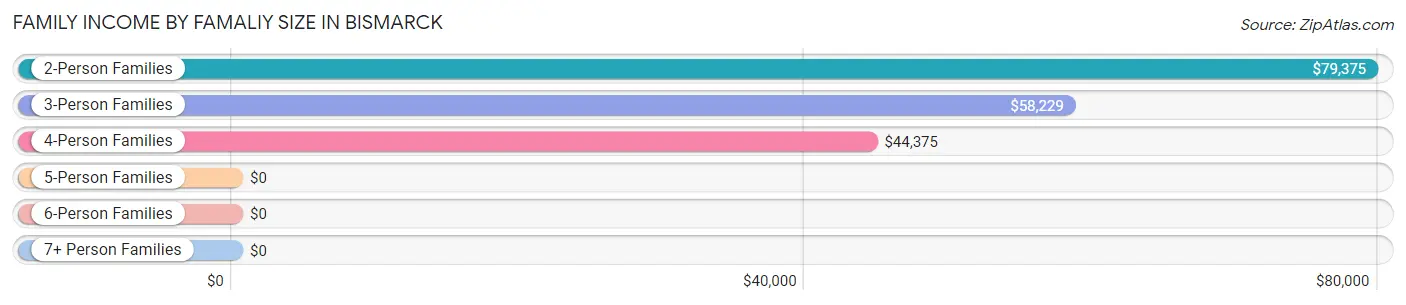
| Income Bracket | # Families | Median Income |
| 2-Person Families | 139 (35.6%) | $79,375 |
| 3-Person Families | 85 (21.8%) | $58,229 |
| 4-Person Families | 105 (26.9%) | $44,375 |
| 5-Person Families | 44 (11.3%) | $0 |
| 6-Person Families | 11 (2.8%) | $0 |
| 7+ Person Families | 6 (1.5%) | $0 |
| Total | 390 (100.0%) | $58,966 |
Family Income by Number of Earners in Bismarck
The median family income in Bismarck is $58,966, with families comprising 2 earners (144) having the highest median family income of $66,250, while families with 1 earner (172) have the lowest median family income of $42,250, accounting for 36.9% and 44.1% of families, respectively.
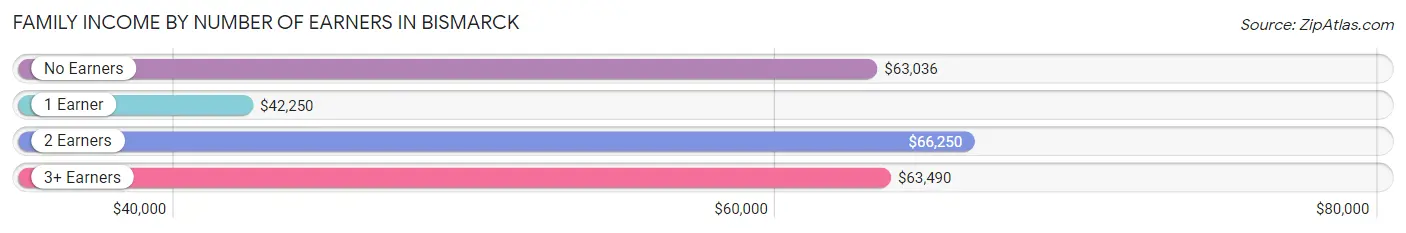
| Number of Earners | # Families | Median Income |
| No Earners | 37 (9.5%) | $63,036 |
| 1 Earner | 172 (44.1%) | $42,250 |
| 2 Earners | 144 (36.9%) | $66,250 |
| 3+ Earners | 37 (9.5%) | $63,490 |
| Total | 390 (100.0%) | $58,966 |
Household Income in Bismarck
Household Income Brackets in Bismarck
With 120 households falling in the category, the $50,000 to $74,999 income range is the most frequent in Bismarck, accounting for 20.4% of all households.
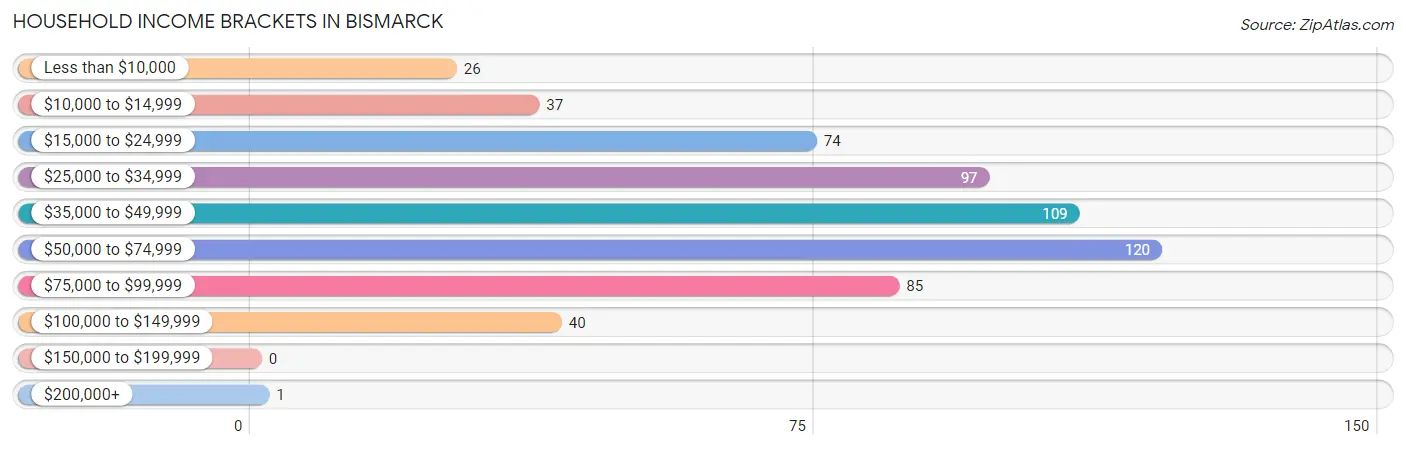
| Income Bracket | # Households | % Households |
| Less than $10,000 | 26 | 4.4% |
| $10,000 to $14,999 | 37 | 6.3% |
| $15,000 to $24,999 | 74 | 12.6% |
| $25,000 to $34,999 | 97 | 16.5% |
| $35,000 to $49,999 | 109 | 18.5% |
| $50,000 to $74,999 | 120 | 20.4% |
| $75,000 to $99,999 | 85 | 14.4% |
| $100,000 to $149,999 | 40 | 6.8% |
| $150,000 to $199,999 | 0 | 0.0% |
| $200,000+ | 1 | 0.2% |
Household Income by Householder Age in Bismarck
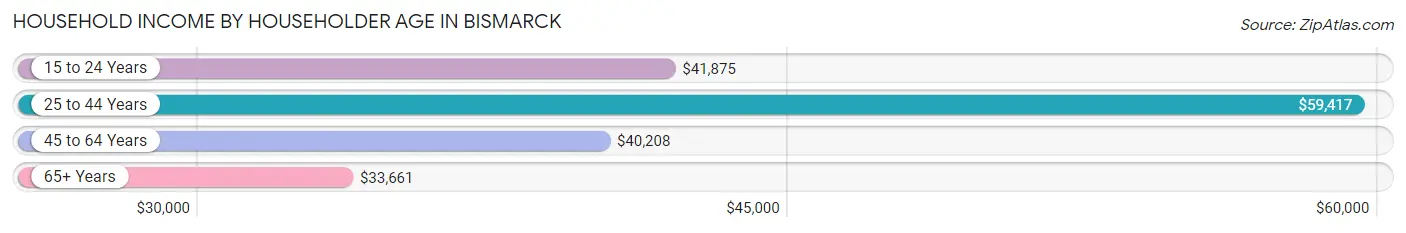
The median household income in Bismarck is $42,188, with the highest median household income of $59,417 found in the 25 to 44 years age bracket for the primary householder. A total of 179 households (30.4%) fall into this category. Meanwhile, the 65+ years age bracket for the primary householder has the lowest median household income of $33,661, with 173 households (29.4%) in this group.
| Income Bracket | # Households | Median Income |
| 15 to 24 Years | 12 (2.0%) | $41,875 |
| 25 to 44 Years | 179 (30.4%) | $59,417 |
| 45 to 64 Years | 225 (38.2%) | $40,208 |
| 65+ Years | 173 (29.4%) | $33,661 |
| Total | 589 (100.0%) | $42,188 |
Poverty in Bismarck
Income Below Poverty by Sex and Age in Bismarck
With 21.0% poverty level for males and 11.2% for females among the residents of Bismarck, 15 year old males and 45 to 54 year old females are the most vulnerable to poverty, with 24 males (100.0%) and 28 females (38.9%) in their respective age groups living below the poverty level.
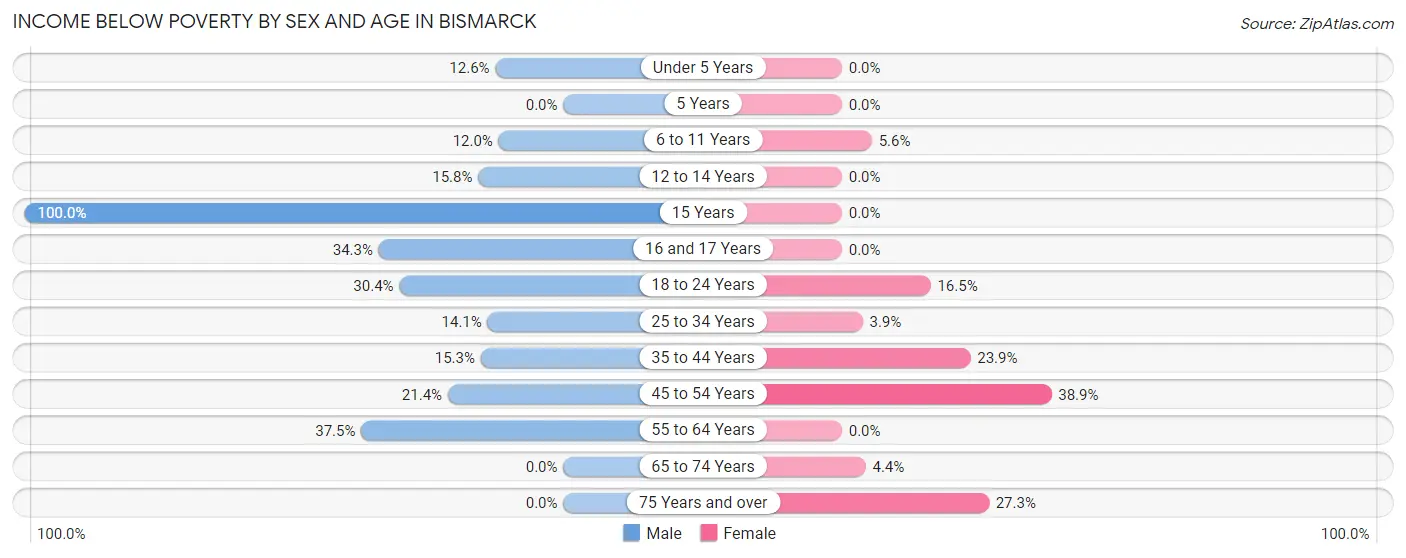
| Age Bracket | Male | Female |
| Under 5 Years | 14 (12.6%) | 0 (0.0%) |
| 5 Years | 0 (0.0%) | 0 (0.0%) |
| 6 to 11 Years | 6 (12.0%) | 3 (5.6%) |
| 12 to 14 Years | 3 (15.8%) | 0 (0.0%) |
| 15 Years | 24 (100.0%) | 0 (0.0%) |
| 16 and 17 Years | 25 (34.3%) | 0 (0.0%) |
| 18 to 24 Years | 7 (30.4%) | 13 (16.5%) |
| 25 to 34 Years | 9 (14.1%) | 5 (3.8%) |
| 35 to 44 Years | 19 (15.3%) | 31 (23.8%) |
| 45 to 54 Years | 18 (21.4%) | 28 (38.9%) |
| 55 to 64 Years | 30 (37.5%) | 0 (0.0%) |
| 65 to 74 Years | 0 (0.0%) | 3 (4.4%) |
| 75 Years and over | 0 (0.0%) | 15 (27.3%) |
| Total | 155 (21.0%) | 98 (11.2%) |
Income Above Poverty by Sex and Age in Bismarck
According to the poverty statistics in Bismarck, males aged 5 years and females aged under 5 years are the age groups that are most secure financially, with 100.0% of males and 100.0% of females in these age groups living above the poverty line.
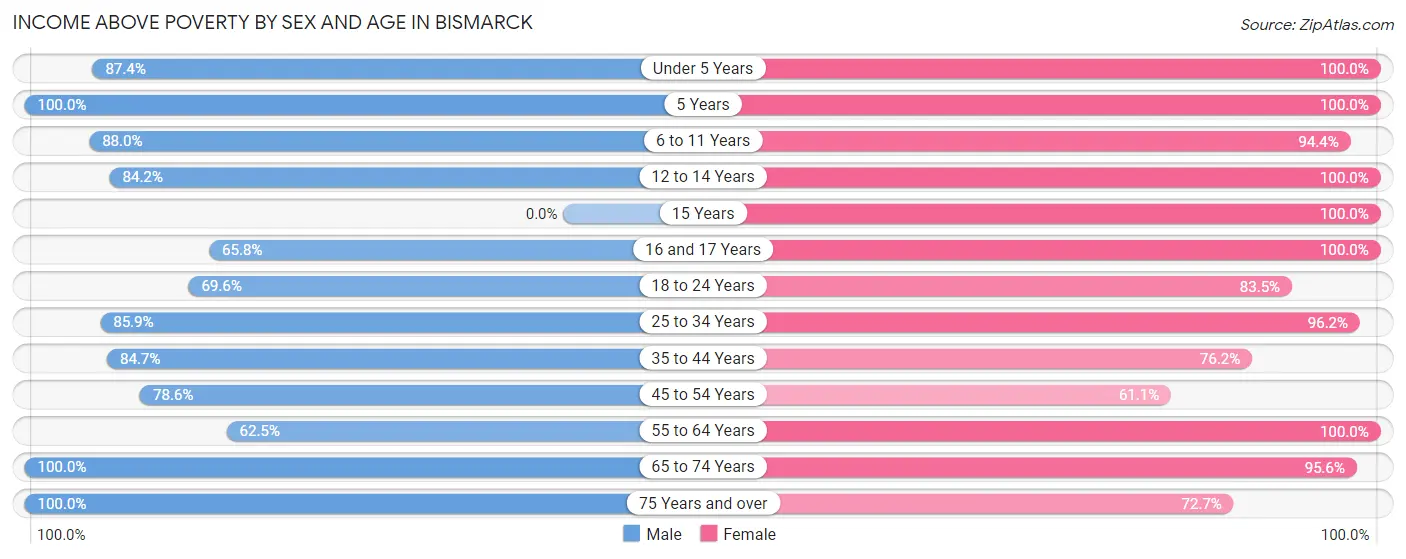
| Age Bracket | Male | Female |
| Under 5 Years | 97 (87.4%) | 41 (100.0%) |
| 5 Years | 5 (100.0%) | 16 (100.0%) |
| 6 to 11 Years | 44 (88.0%) | 51 (94.4%) |
| 12 to 14 Years | 16 (84.2%) | 72 (100.0%) |
| 15 Years | 0 (0.0%) | 29 (100.0%) |
| 16 and 17 Years | 48 (65.7%) | 13 (100.0%) |
| 18 to 24 Years | 16 (69.6%) | 66 (83.5%) |
| 25 to 34 Years | 55 (85.9%) | 125 (96.2%) |
| 35 to 44 Years | 105 (84.7%) | 99 (76.1%) |
| 45 to 54 Years | 66 (78.6%) | 44 (61.1%) |
| 55 to 64 Years | 50 (62.5%) | 116 (100.0%) |
| 65 to 74 Years | 74 (100.0%) | 65 (95.6%) |
| 75 Years and over | 7 (100.0%) | 40 (72.7%) |
| Total | 583 (79.0%) | 777 (88.8%) |
Income Below Poverty Among Married-Couple Families in Bismarck
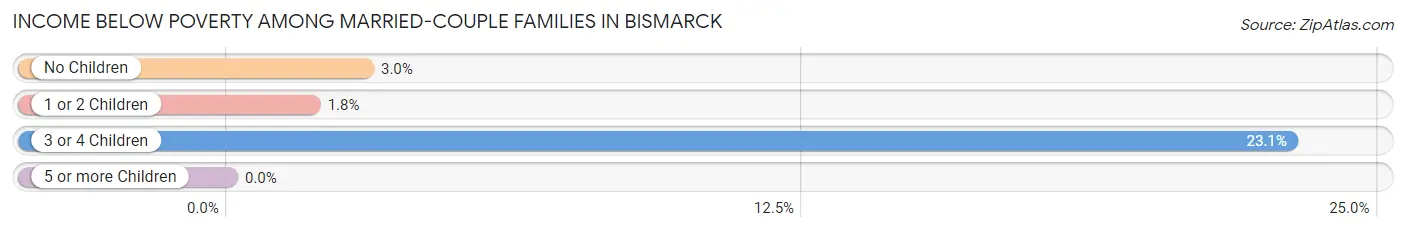
The poverty statistics for married-couple families in Bismarck show that 3.5% or 9 of the total 259 families live below the poverty line. Families with 3 or 4 children have the highest poverty rate of 23.1%, comprising of 3 families. On the other hand, families with 1 or 2 children have the lowest poverty rate of 1.8%, which includes 2 families.
| Children | Above Poverty | Below Poverty |
| No Children | 131 (97.0%) | 4 (3.0%) |
| 1 or 2 Children | 109 (98.2%) | 2 (1.8%) |
| 3 or 4 Children | 10 (76.9%) | 3 (23.1%) |
| 5 or more Children | 0 (0.0%) | 0 (0.0%) |
| Total | 250 (96.5%) | 9 (3.5%) |
Income Below Poverty Among Single-Parent Households in Bismarck
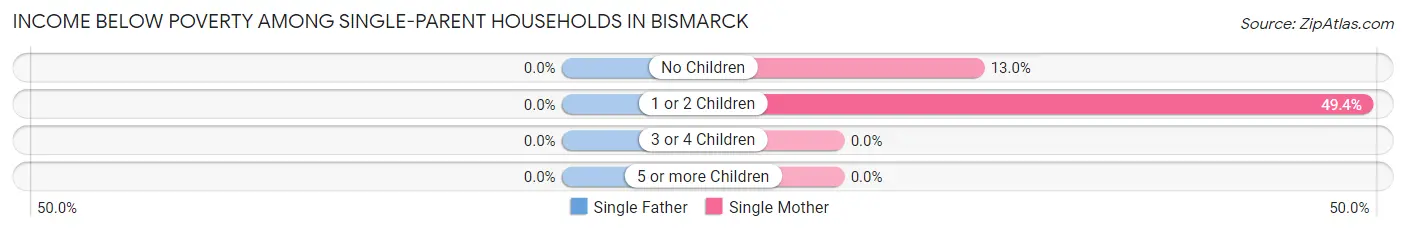
| Children | Single Father | Single Mother |
| No Children | 0 (0.0%) | 3 (13.0%) |
| 1 or 2 Children | 0 (0.0%) | 38 (49.3%) |
| 3 or 4 Children | 0 (0.0%) | 0 (0.0%) |
| 5 or more Children | 0 (0.0%) | 0 (0.0%) |
| Total | 0 (0.0%) | 41 (35.0%) |
Income Below Poverty Among Married-Couple vs Single-Parent Households in Bismarck
The poverty data for Bismarck shows that 9 of the married-couple family households (3.5%) and 41 of the single-parent households (31.3%) are living below the poverty level. Within the married-couple family households, those with 3 or 4 children have the highest poverty rate, with 3 households (23.1%) falling below the poverty line. Among the single-parent households, those with 1 or 2 children have the highest poverty rate, with 38 household (46.9%) living below poverty.
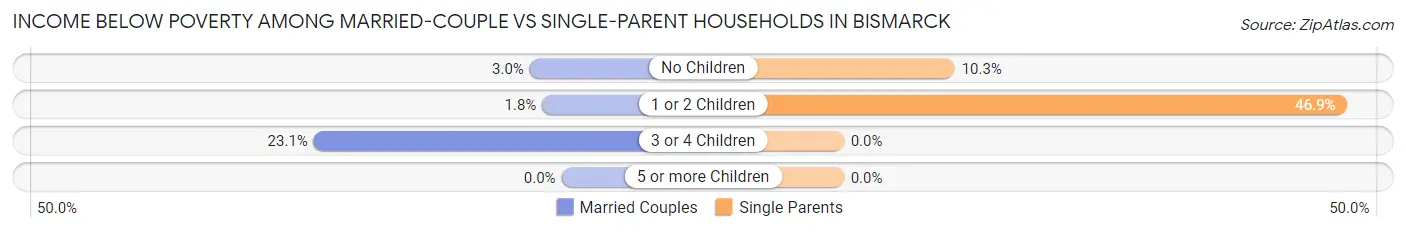
| Children | Married-Couple Families | Single-Parent Households |
| No Children | 4 (3.0%) | 3 (10.3%) |
| 1 or 2 Children | 2 (1.8%) | 38 (46.9%) |
| 3 or 4 Children | 3 (23.1%) | 0 (0.0%) |
| 5 or more Children | 0 (0.0%) | 0 (0.0%) |
| Total | 9 (3.5%) | 41 (31.3%) |
Race in Bismarck
The most populous races in Bismarck are White / Caucasian (1,482 | 91.6%), Two or more Races (108 | 6.7%), and Black / African American (27 | 1.7%).
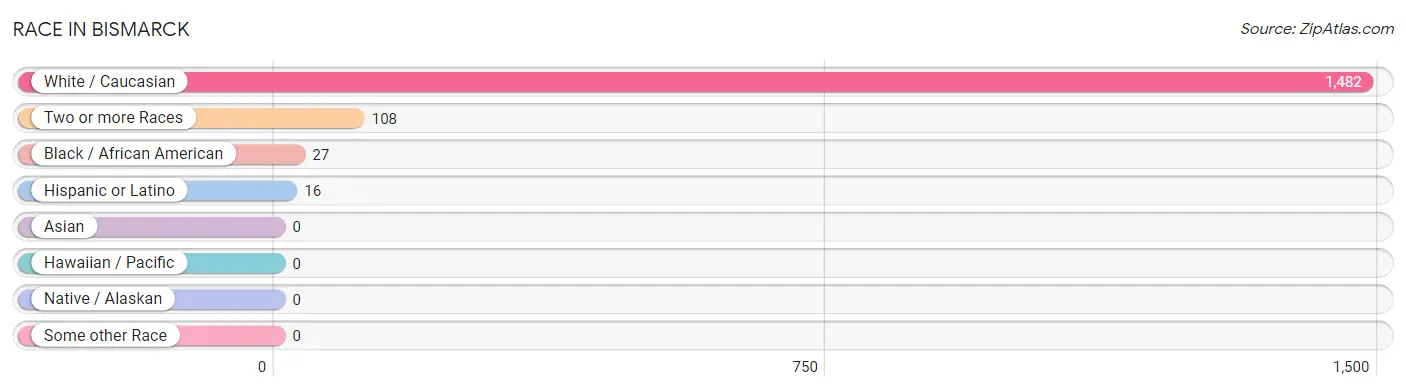
| Race | # Population | % Population |
| Asian | 0 | 0.0% |
| Black / African American | 27 | 1.7% |
| Hawaiian / Pacific | 0 | 0.0% |
| Hispanic or Latino | 16 | 1.0% |
| Native / Alaskan | 0 | 0.0% |
| White / Caucasian | 1,482 | 91.6% |
| Two or more Races | 108 | 6.7% |
| Some other Race | 0 | 0.0% |
| Total | 1,617 | 100.0% |
Ancestry in Bismarck
The most populous ancestries reported in Bismarck are American (264 | 16.3%), German (257 | 15.9%), Irish (224 | 13.9%), French (122 | 7.5%), and English (84 | 5.2%), together accounting for 58.8% of all Bismarck residents.
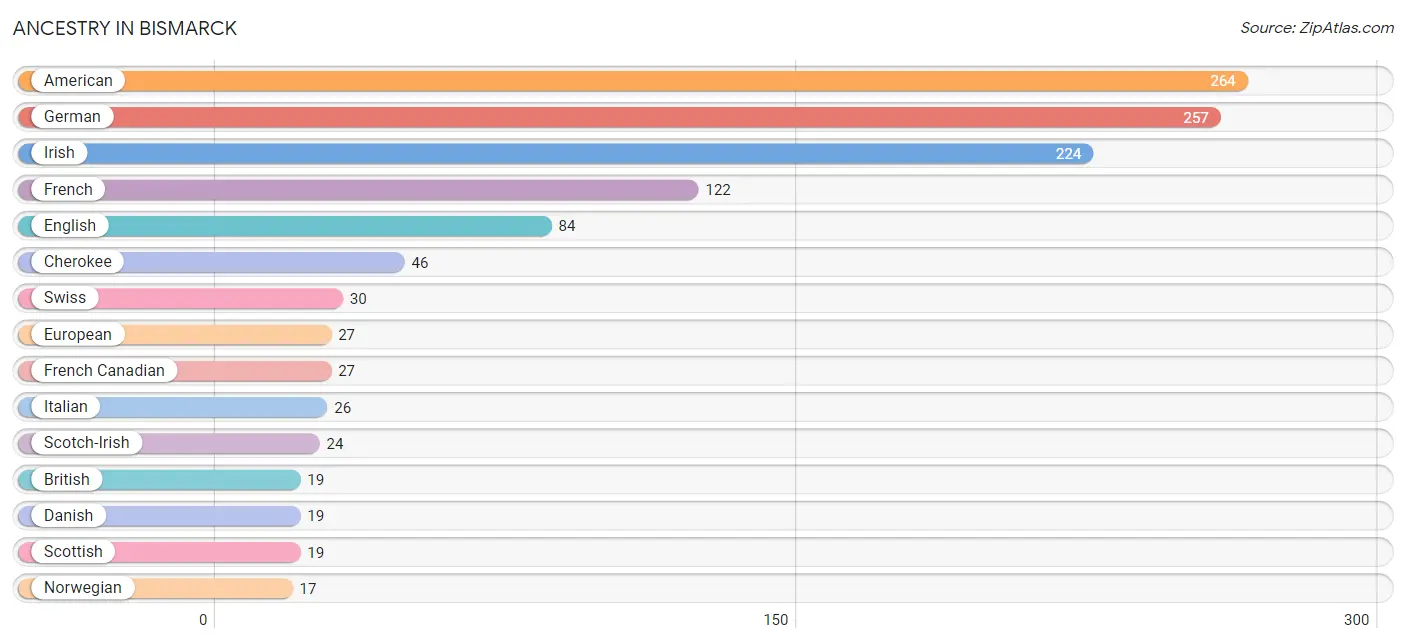
| Ancestry | # Population | % Population |
| American | 264 | 16.3% |
| British | 19 | 1.2% |
| Cherokee | 46 | 2.8% |
| Czech | 4 | 0.3% |
| Danish | 19 | 1.2% |
| Dutch | 3 | 0.2% |
| English | 84 | 5.2% |
| European | 27 | 1.7% |
| French | 122 | 7.5% |
| French Canadian | 27 | 1.7% |
| German | 257 | 15.9% |
| Hungarian | 4 | 0.3% |
| Irish | 224 | 13.9% |
| Italian | 26 | 1.6% |
| Mexican | 6 | 0.4% |
| Norwegian | 17 | 1.1% |
| Scotch-Irish | 24 | 1.5% |
| Scottish | 19 | 1.2% |
| Swedish | 5 | 0.3% |
| Swiss | 30 | 1.9% |
| Welsh | 3 | 0.2% | View All 21 Rows |
Immigrants in Bismarck
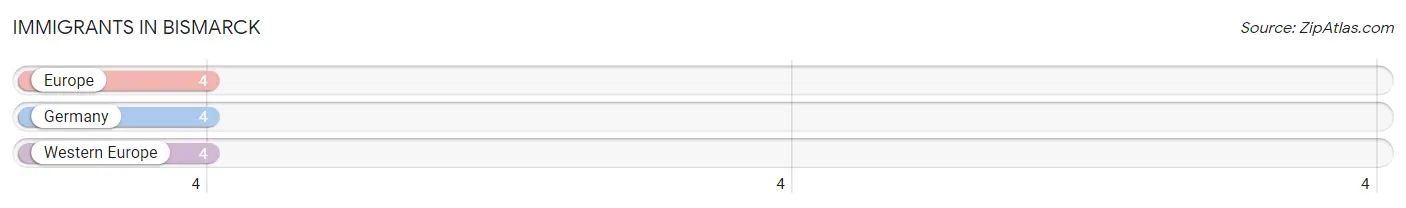
The most numerous immigrant groups reported in Bismarck came from Europe (4 | 0.3%), Germany (4 | 0.3%), and Western Europe (4 | 0.3%), together accounting for 0.7% of all Bismarck residents.
| Immigration Origin | # Population | % Population |
| Europe | 4 | 0.3% |
| Germany | 4 | 0.3% |
| Western Europe | 4 | 0.3% | View All 3 Rows |
Sex and Age in Bismarck
Sex and Age in Bismarck
The most populous age groups in Bismarck are Under 5 Years (111 | 15.0%) for men and 35 to 39 Years (86 | 9.8%) for women.
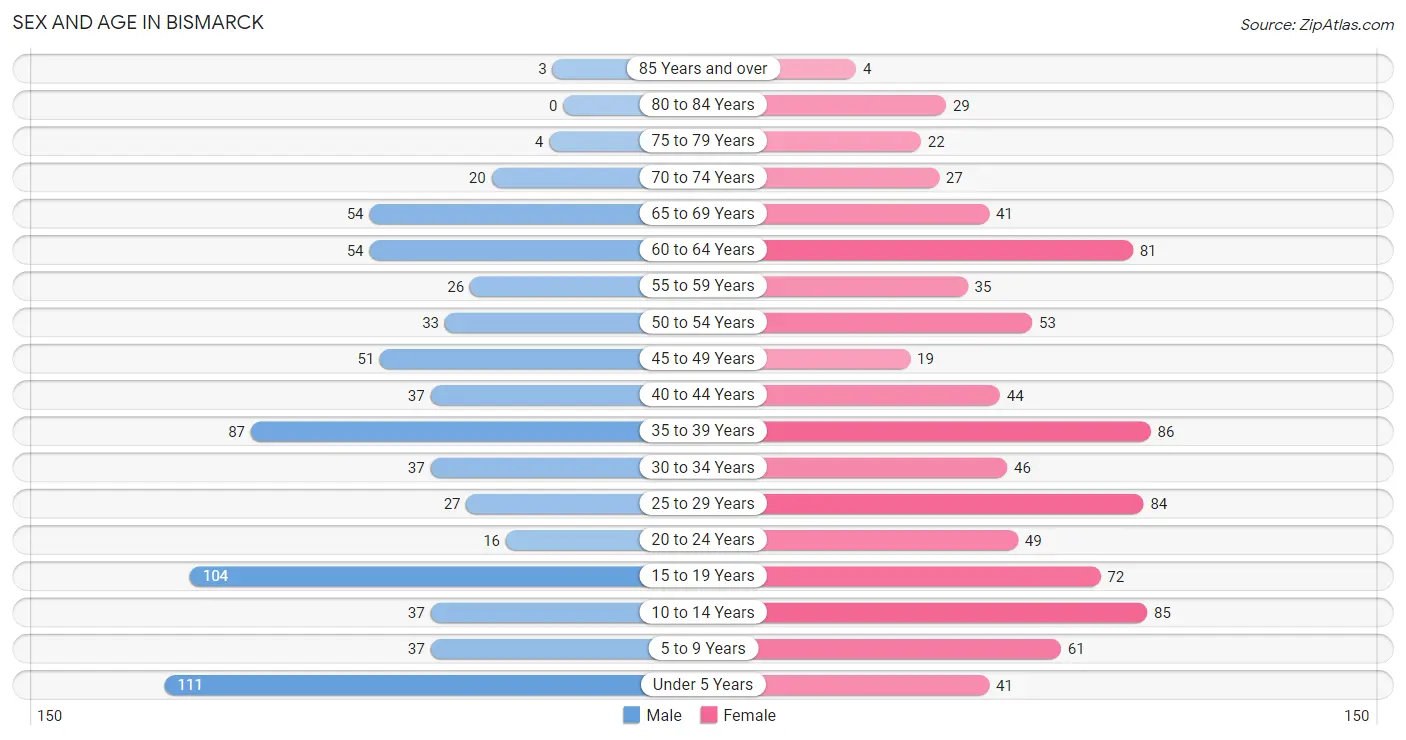
| Age Bracket | Male | Female |
| Under 5 Years | 111 (15.0%) | 41 (4.7%) |
| 5 to 9 Years | 37 (5.0%) | 61 (6.9%) |
| 10 to 14 Years | 37 (5.0%) | 85 (9.7%) |
| 15 to 19 Years | 104 (14.1%) | 72 (8.2%) |
| 20 to 24 Years | 16 (2.2%) | 49 (5.6%) |
| 25 to 29 Years | 27 (3.7%) | 84 (9.6%) |
| 30 to 34 Years | 37 (5.0%) | 46 (5.2%) |
| 35 to 39 Years | 87 (11.8%) | 86 (9.8%) |
| 40 to 44 Years | 37 (5.0%) | 44 (5.0%) |
| 45 to 49 Years | 51 (6.9%) | 19 (2.2%) |
| 50 to 54 Years | 33 (4.5%) | 53 (6.0%) |
| 55 to 59 Years | 26 (3.5%) | 35 (4.0%) |
| 60 to 64 Years | 54 (7.3%) | 81 (9.2%) |
| 65 to 69 Years | 54 (7.3%) | 41 (4.7%) |
| 70 to 74 Years | 20 (2.7%) | 27 (3.1%) |
| 75 to 79 Years | 4 (0.5%) | 22 (2.5%) |
| 80 to 84 Years | 0 (0.0%) | 29 (3.3%) |
| 85 Years and over | 3 (0.4%) | 4 (0.5%) |
| Total | 738 (100.0%) | 879 (100.0%) |
Families and Households in Bismarck
Median Family Size in Bismarck
The median family size in Bismarck is 3.45 persons per family, with single male/father families (14 | 3.6%) accounting for the largest median family size of 5.43 persons per family. On the other hand, married-couple families (259 | 66.4%) represent the smallest median family size with 3.09 persons per family.
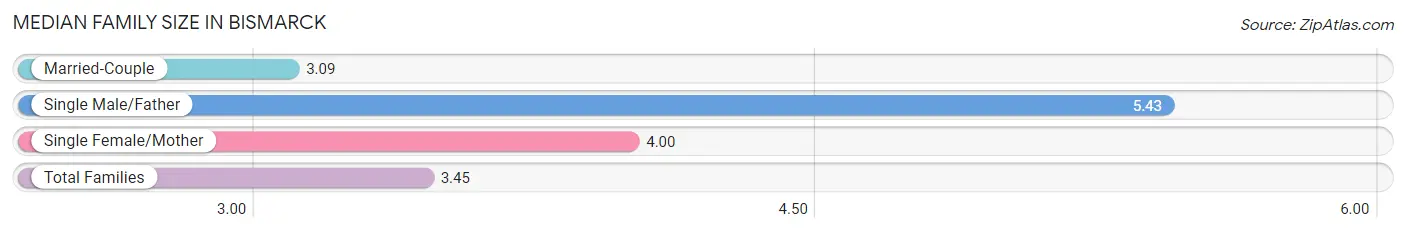
| Family Type | # Families | Family Size |
| Married-Couple | 259 (66.4%) | 3.09 |
| Single Male/Father | 14 (3.6%) | 5.43 |
| Single Female/Mother | 117 (30.0%) | 4.00 |
| Total Families | 390 (100.0%) | 3.45 |
Median Household Size in Bismarck
The median household size in Bismarck is 2.74 persons per household, with single male/father households (14 | 2.4%) accounting for the largest median household size of 6.5 persons per household. non-family households (199 | 33.8%) represent the smallest median household size with 1.10 persons per household.
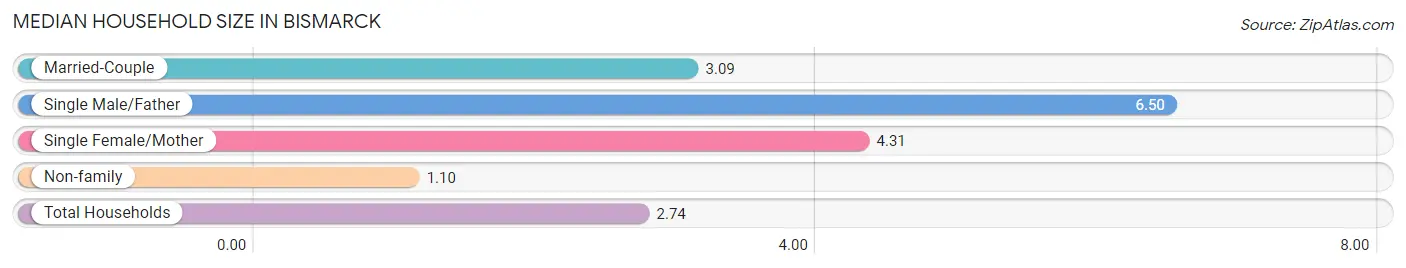
| Household Type | # Households | Household Size |
| Married-Couple | 259 (44.0%) | 3.09 |
| Single Male/Father | 14 (2.4%) | 6.50 |
| Single Female/Mother | 117 (19.9%) | 4.31 |
| Non-family | 199 (33.8%) | 1.10 |
| Total Households | 589 (100.0%) | 2.74 |
Household Size by Marriage Status in Bismarck
Out of a total of 589 households in Bismarck, 390 (66.2%) are family households, while 199 (33.8%) are nonfamily households. The most numerous type of family households are 2-person households, comprising 135, and the most common type of nonfamily households are 1-person households, comprising 184.
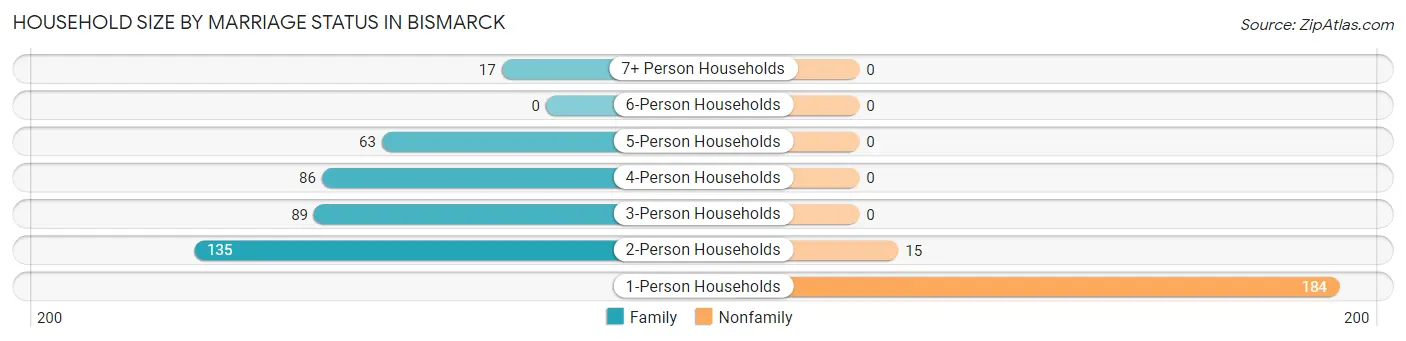
| Household Size | Family Households | Nonfamily Households |
| 1-Person Households | - | 184 (31.2%) |
| 2-Person Households | 135 (22.9%) | 15 (2.5%) |
| 3-Person Households | 89 (15.1%) | 0 (0.0%) |
| 4-Person Households | 86 (14.6%) | 0 (0.0%) |
| 5-Person Households | 63 (10.7%) | 0 (0.0%) |
| 6-Person Households | 0 (0.0%) | 0 (0.0%) |
| 7+ Person Households | 17 (2.9%) | 0 (0.0%) |
| Total | 390 (66.2%) | 199 (33.8%) |
Female Fertility in Bismarck
Fertility by Age in Bismarck
Average fertility rate in Bismarck is 42.0 births per 1,000 women. Women in the age bracket of 35 to 50 years have the highest fertility rate with 71.0 births per 1,000 women. Women in the age bracket of 35 to 50 years acount for 64.7% of all women with births.
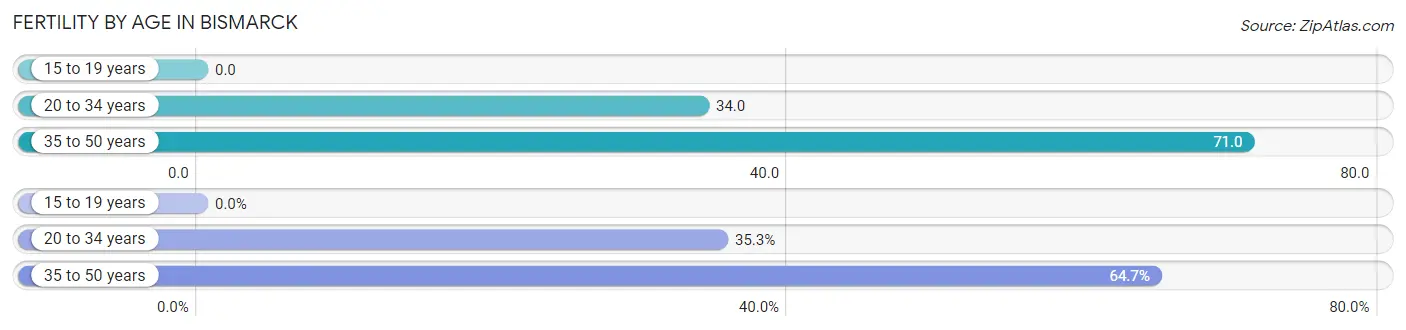
| Age Bracket | Women with Births | Births / 1,000 Women |
| 15 to 19 years | 0 (0.0%) | 0.0 |
| 20 to 34 years | 6 (35.3%) | 34.0 |
| 35 to 50 years | 11 (64.7%) | 71.0 |
| Total | 17 (100.0%) | 42.0 |
Fertility by Age by Marriage Status in Bismarck
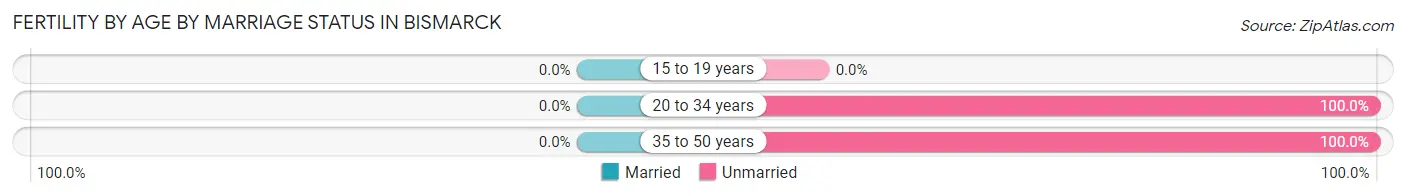
| Age Bracket | Married | Unmarried |
| 15 to 19 years | 0 (0.0%) | 0 (0.0%) |
| 20 to 34 years | 0 (0.0%) | 6 (100.0%) |
| 35 to 50 years | 0 (0.0%) | 11 (100.0%) |
| Total | 0 (0.0%) | 17 (100.0%) |
Fertility by Education in Bismarck
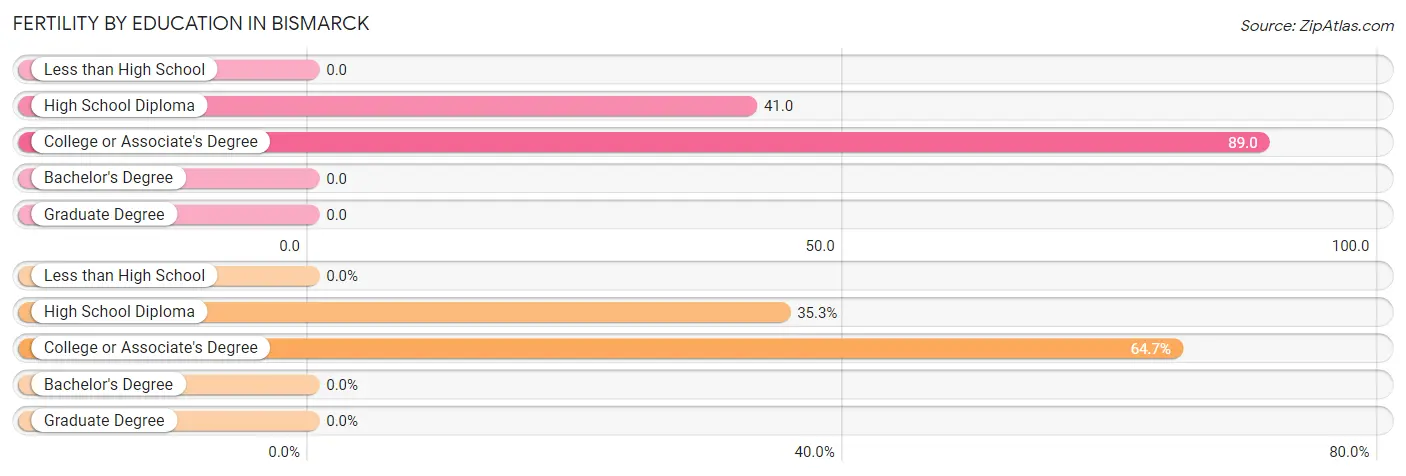
| Educational Attainment | Women with Births | Births / 1,000 Women |
| Less than High School | 0 (0.0%) | 0.0 |
| High School Diploma | 6 (35.3%) | 41.0 |
| College or Associate's Degree | 11 (64.7%) | 89.0 |
| Bachelor's Degree | 0 (0.0%) | 0.0 |
| Graduate Degree | 0 (0.0%) | 0.0 |
| Total | 17 (100.0%) | 42.0 |
Fertility by Education by Marriage Status in Bismarck
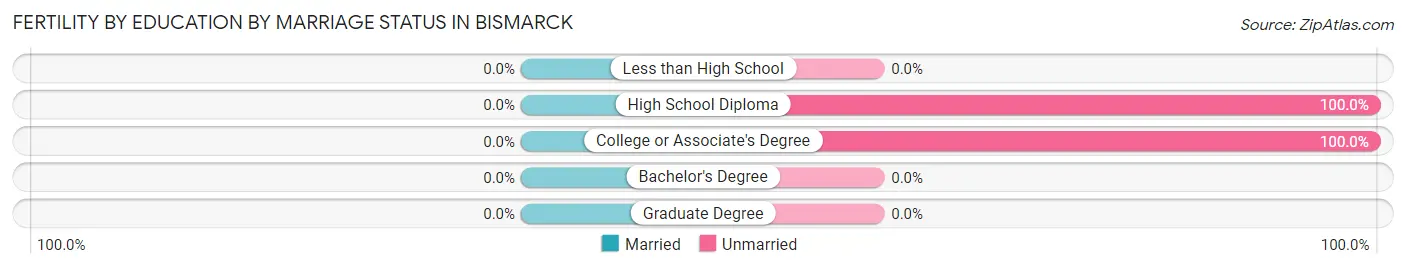
| Educational Attainment | Married | Unmarried |
| Less than High School | 0 (0.0%) | 0 (0.0%) |
| High School Diploma | 0 (0.0%) | 6 (100.0%) |
| College or Associate's Degree | 0 (0.0%) | 11 (100.0%) |
| Bachelor's Degree | 0 (0.0%) | 0 (0.0%) |
| Graduate Degree | 0 (0.0%) | 0 (0.0%) |
| Total | 0 (0.0%) | 17 (100.0%) |
Employment Characteristics in Bismarck
Employment by Class of Employer in Bismarck
Among the 615 employed individuals in Bismarck, private company employees (428 | 69.6%), state government employees (78 | 12.7%), and self-employed (not incorporated) (36 | 5.9%) make up the most common classes of employment.
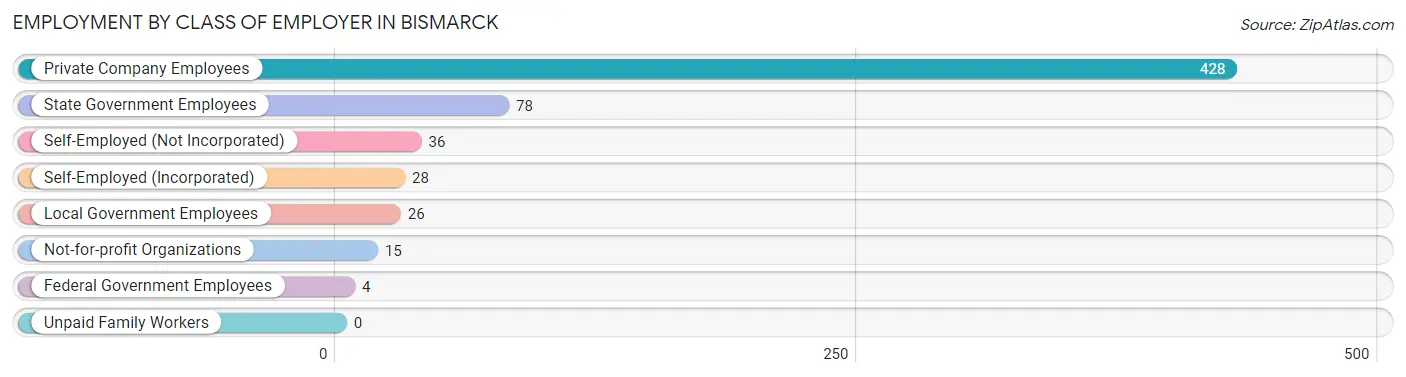
| Employer Class | # Employees | % Employees |
| Private Company Employees | 428 | 69.6% |
| Self-Employed (Incorporated) | 28 | 4.5% |
| Self-Employed (Not Incorporated) | 36 | 5.9% |
| Not-for-profit Organizations | 15 | 2.4% |
| Local Government Employees | 26 | 4.2% |
| State Government Employees | 78 | 12.7% |
| Federal Government Employees | 4 | 0.6% |
| Unpaid Family Workers | 0 | 0.0% |
| Total | 615 | 100.0% |
Employment Status by Age in Bismarck
According to the labor force statistics for Bismarck, out of the total population over 16 years of age (1,192), 55.5% or 662 individuals are in the labor force, with 3.9% or 26 of them unemployed. The age group with the highest labor force participation rate is 20 to 24 years, with 95.4% or 62 individuals in the labor force. Within the labor force, the 20 to 24 years age range has the highest percentage of unemployed individuals, with 17.7% or 11 of them being unemployed.
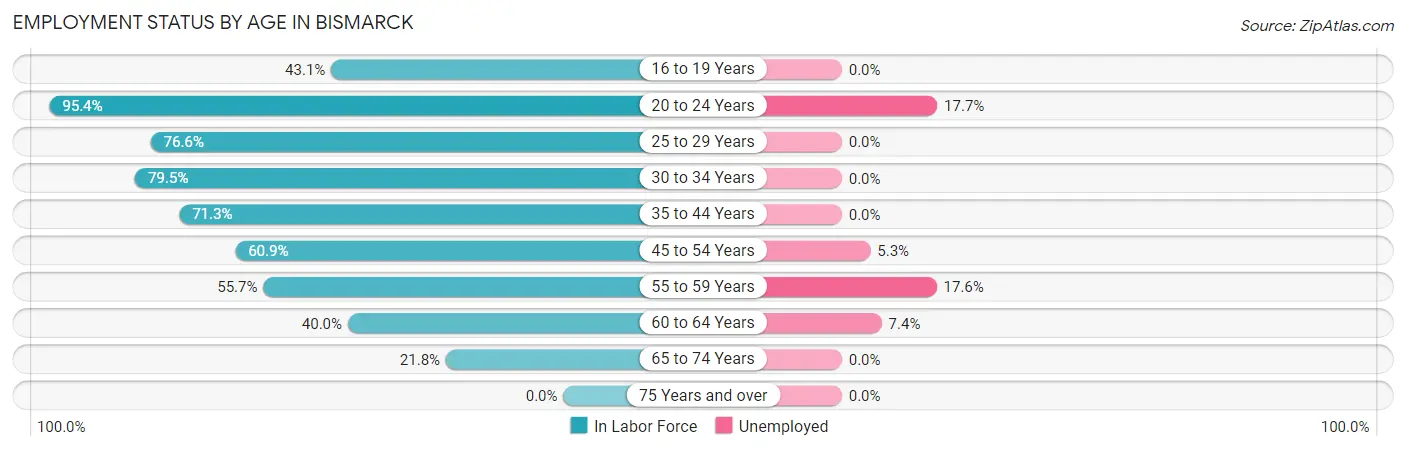
| Age Bracket | In Labor Force | Unemployed |
| 16 to 19 Years | 53 (43.1%) | 0 (0.0%) |
| 20 to 24 Years | 62 (95.4%) | 11 (17.7%) |
| 25 to 29 Years | 85 (76.6%) | 0 (0.0%) |
| 30 to 34 Years | 66 (79.5%) | 0 (0.0%) |
| 35 to 44 Years | 181 (71.3%) | 0 (0.0%) |
| 45 to 54 Years | 95 (60.9%) | 5 (5.3%) |
| 55 to 59 Years | 34 (55.7%) | 6 (17.6%) |
| 60 to 64 Years | 54 (40.0%) | 4 (7.4%) |
| 65 to 74 Years | 31 (21.8%) | 0 (0.0%) |
| 75 Years and over | 0 (0.0%) | 0 (0.0%) |
| Total | 662 (55.5%) | 26 (3.9%) |
Employment Status by Educational Attainment in Bismarck
According to labor force statistics for Bismarck, 64.4% of individuals (515) out of the total population between 25 and 64 years of age (800) are in the labor force, with 2.9% or 15 of them being unemployed. The group with the highest labor force participation rate are those with the educational attainment of bachelor's degree or higher, with 82.9% or 97 individuals in the labor force. Within the labor force, individuals with less than high school education have the highest percentage of unemployment, with 14.6% or 6 of them being unemployed.
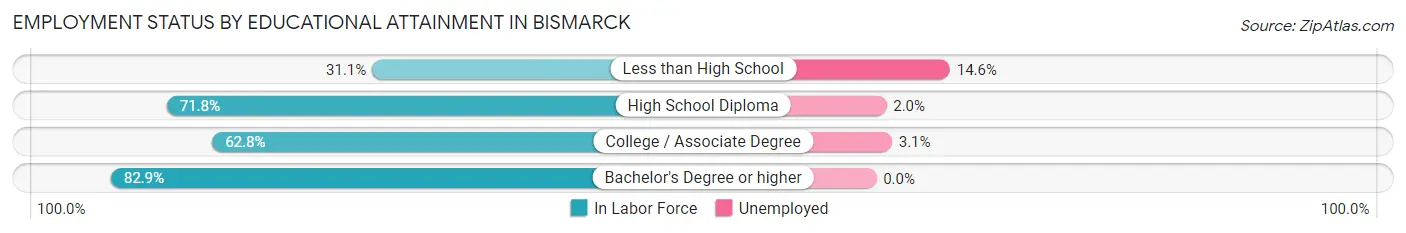
| Educational Attainment | In Labor Force | Unemployed |
| Less than High School | 41 (31.1%) | 19 (14.6%) |
| High School Diploma | 247 (71.8%) | 7 (2.0%) |
| College / Associate Degree | 130 (62.8%) | 6 (3.1%) |
| Bachelor's Degree or higher | 97 (82.9%) | 0 (0.0%) |
| Total | 515 (64.4%) | 23 (2.9%) |
Employment Occupations by Sex in Bismarck
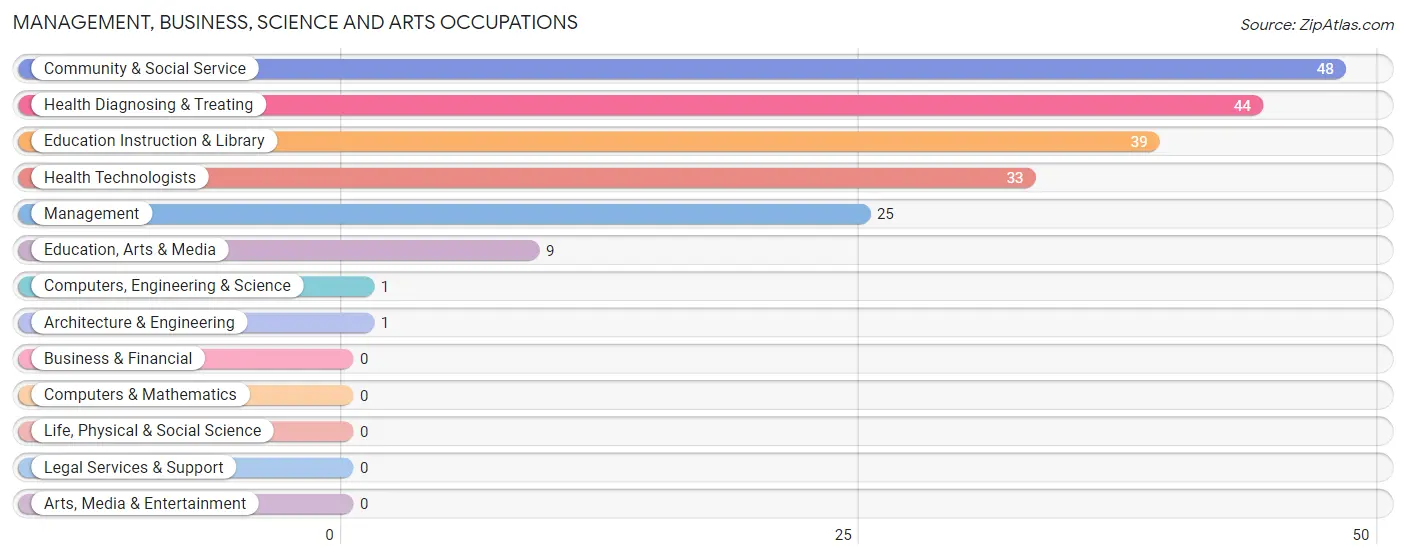
Management, Business, Science and Arts Occupations
The most common Management, Business, Science and Arts occupations in Bismarck are Community & Social Service (48 | 7.6%), Health Diagnosing & Treating (44 | 6.9%), Education Instruction & Library (39 | 6.1%), Health Technologists (33 | 5.2%), and Management (25 | 3.9%).
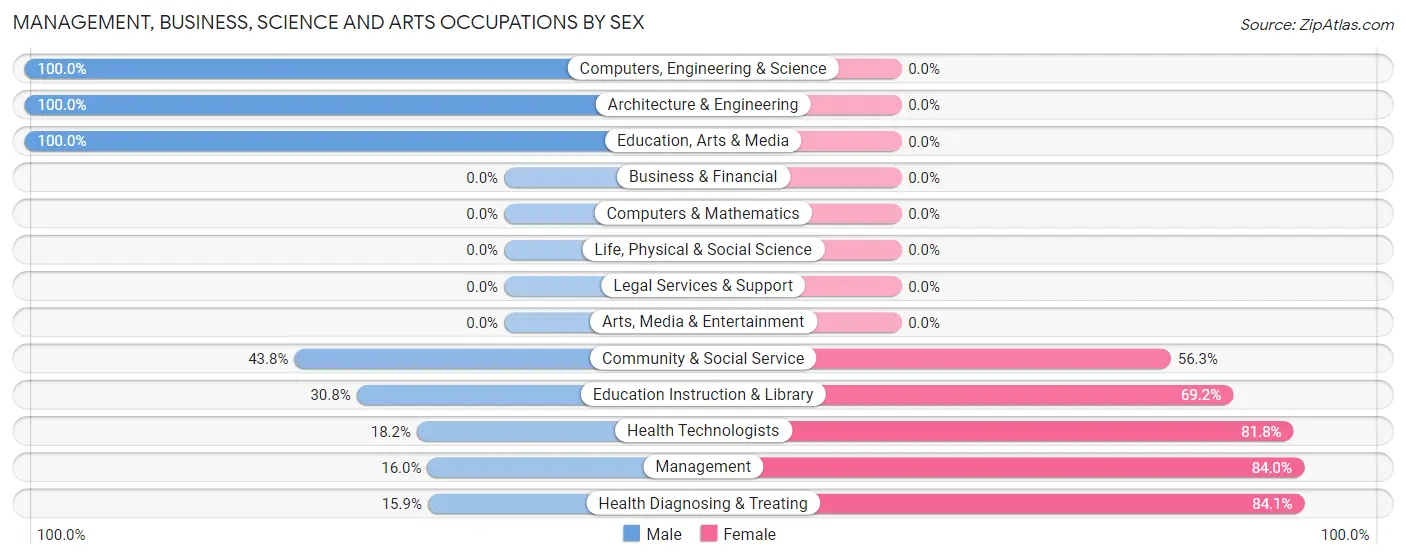
Management, Business, Science and Arts Occupations by Sex
Within the Management, Business, Science and Arts occupations in Bismarck, the most male-oriented occupations are Computers, Engineering & Science (100.0%), Architecture & Engineering (100.0%), and Education, Arts & Media (100.0%), while the most female-oriented occupations are Health Diagnosing & Treating (84.1%), Management (84.0%), and Health Technologists (81.8%).
| Occupation | Male | Female |
| Management | 4 (16.0%) | 21 (84.0%) |
| Business & Financial | 0 (0.0%) | 0 (0.0%) |
| Computers, Engineering & Science | 1 (100.0%) | 0 (0.0%) |
| Computers & Mathematics | 0 (0.0%) | 0 (0.0%) |
| Architecture & Engineering | 1 (100.0%) | 0 (0.0%) |
| Life, Physical & Social Science | 0 (0.0%) | 0 (0.0%) |
| Community & Social Service | 21 (43.8%) | 27 (56.2%) |
| Education, Arts & Media | 9 (100.0%) | 0 (0.0%) |
| Legal Services & Support | 0 (0.0%) | 0 (0.0%) |
| Education Instruction & Library | 12 (30.8%) | 27 (69.2%) |
| Arts, Media & Entertainment | 0 (0.0%) | 0 (0.0%) |
| Health Diagnosing & Treating | 7 (15.9%) | 37 (84.1%) |
| Health Technologists | 6 (18.2%) | 27 (81.8%) |
| Total (Category) | 33 (28.0%) | 85 (72.0%) |
| Total (Overall) | 297 (46.8%) | 338 (53.2%) |
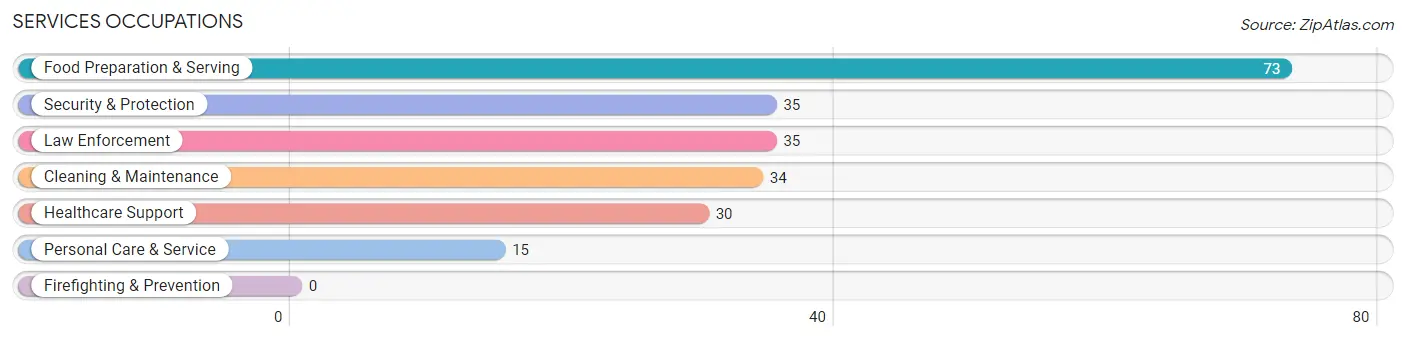
Services Occupations
The most common Services occupations in Bismarck are Food Preparation & Serving (73 | 11.5%), Security & Protection (35 | 5.5%), Law Enforcement (35 | 5.5%), Cleaning & Maintenance (34 | 5.3%), and Healthcare Support (30 | 4.7%).
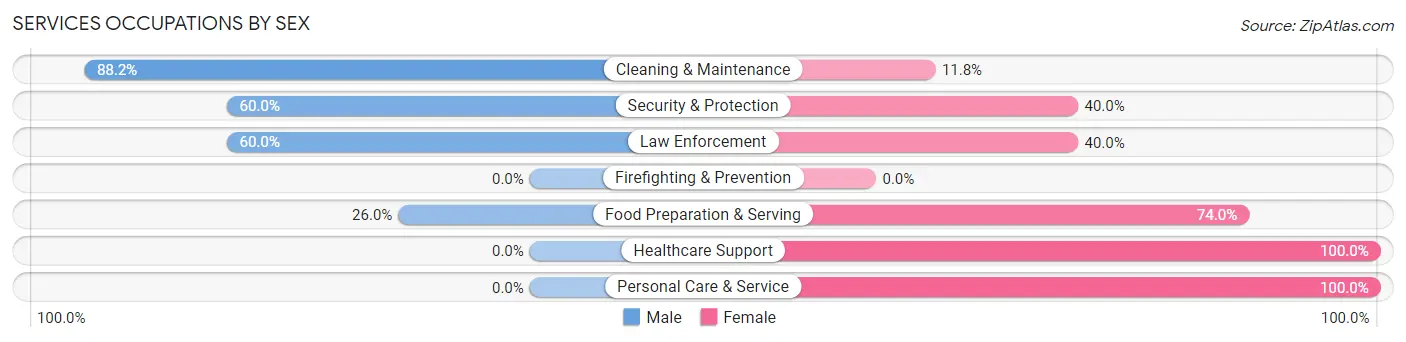
Services Occupations by Sex
Within the Services occupations in Bismarck, the most male-oriented occupations are Cleaning & Maintenance (88.2%), Security & Protection (60.0%), and Law Enforcement (60.0%), while the most female-oriented occupations are Healthcare Support (100.0%), Personal Care & Service (100.0%), and Food Preparation & Serving (74.0%).
| Occupation | Male | Female |
| Healthcare Support | 0 (0.0%) | 30 (100.0%) |
| Security & Protection | 21 (60.0%) | 14 (40.0%) |
| Firefighting & Prevention | 0 (0.0%) | 0 (0.0%) |
| Law Enforcement | 21 (60.0%) | 14 (40.0%) |
| Food Preparation & Serving | 19 (26.0%) | 54 (74.0%) |
| Cleaning & Maintenance | 30 (88.2%) | 4 (11.8%) |
| Personal Care & Service | 0 (0.0%) | 15 (100.0%) |
| Total (Category) | 70 (37.4%) | 117 (62.6%) |
| Total (Overall) | 297 (46.8%) | 338 (53.2%) |
Sales and Office Occupations
The most common Sales and Office occupations in Bismarck are Office & Administration (105 | 16.5%), and Sales & Related (61 | 9.6%).

Sales and Office Occupations by Sex
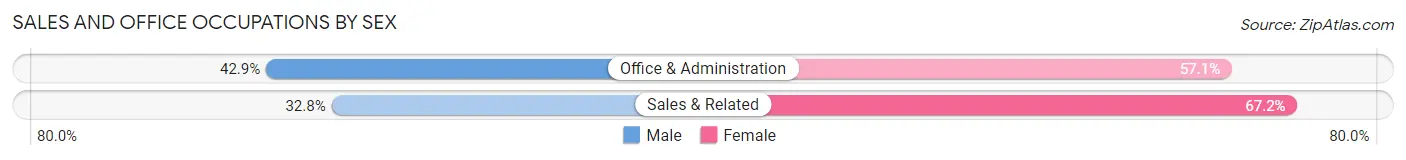
| Occupation | Male | Female |
| Sales & Related | 20 (32.8%) | 41 (67.2%) |
| Office & Administration | 45 (42.9%) | 60 (57.1%) |
| Total (Category) | 65 (39.2%) | 101 (60.8%) |
| Total (Overall) | 297 (46.8%) | 338 (53.2%) |
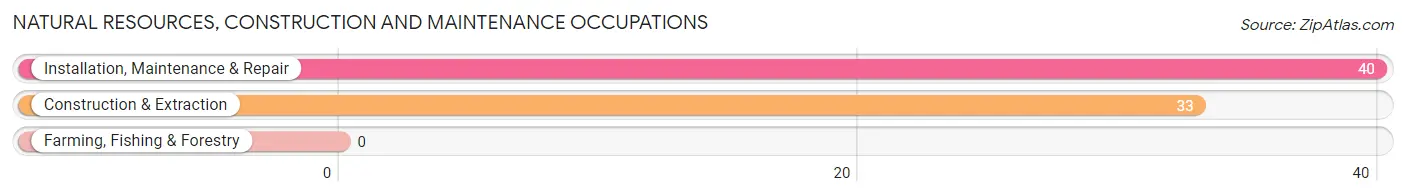
Natural Resources, Construction and Maintenance Occupations
The most common Natural Resources, Construction and Maintenance occupations in Bismarck are Installation, Maintenance & Repair (40 | 6.3%), and Construction & Extraction (33 | 5.2%).
Natural Resources, Construction and Maintenance Occupations by Sex
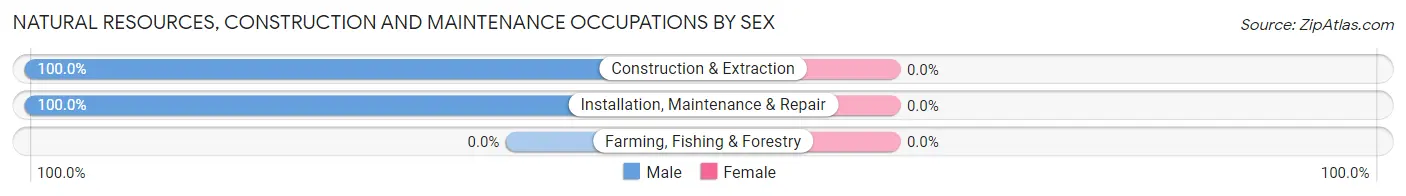
| Occupation | Male | Female |
| Farming, Fishing & Forestry | 0 (0.0%) | 0 (0.0%) |
| Construction & Extraction | 33 (100.0%) | 0 (0.0%) |
| Installation, Maintenance & Repair | 40 (100.0%) | 0 (0.0%) |
| Total (Category) | 73 (100.0%) | 0 (0.0%) |
| Total (Overall) | 297 (46.8%) | 338 (53.2%) |
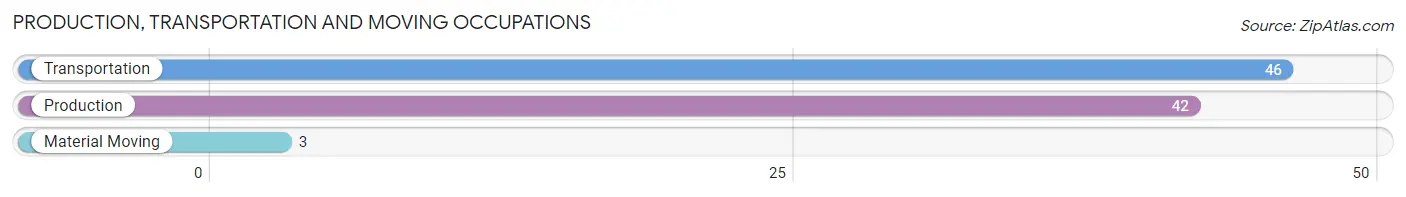
Production, Transportation and Moving Occupations
The most common Production, Transportation and Moving occupations in Bismarck are Transportation (46 | 7.2%), Production (42 | 6.6%), and Material Moving (3 | 0.5%).
Production, Transportation and Moving Occupations by Sex
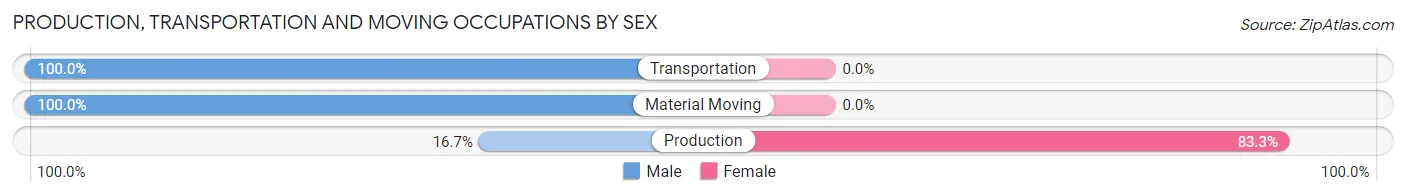
| Occupation | Male | Female |
| Production | 7 (16.7%) | 35 (83.3%) |
| Transportation | 46 (100.0%) | 0 (0.0%) |
| Material Moving | 3 (100.0%) | 0 (0.0%) |
| Total (Category) | 56 (61.5%) | 35 (38.5%) |
| Total (Overall) | 297 (46.8%) | 338 (53.2%) |
Employment Industries by Sex in Bismarck
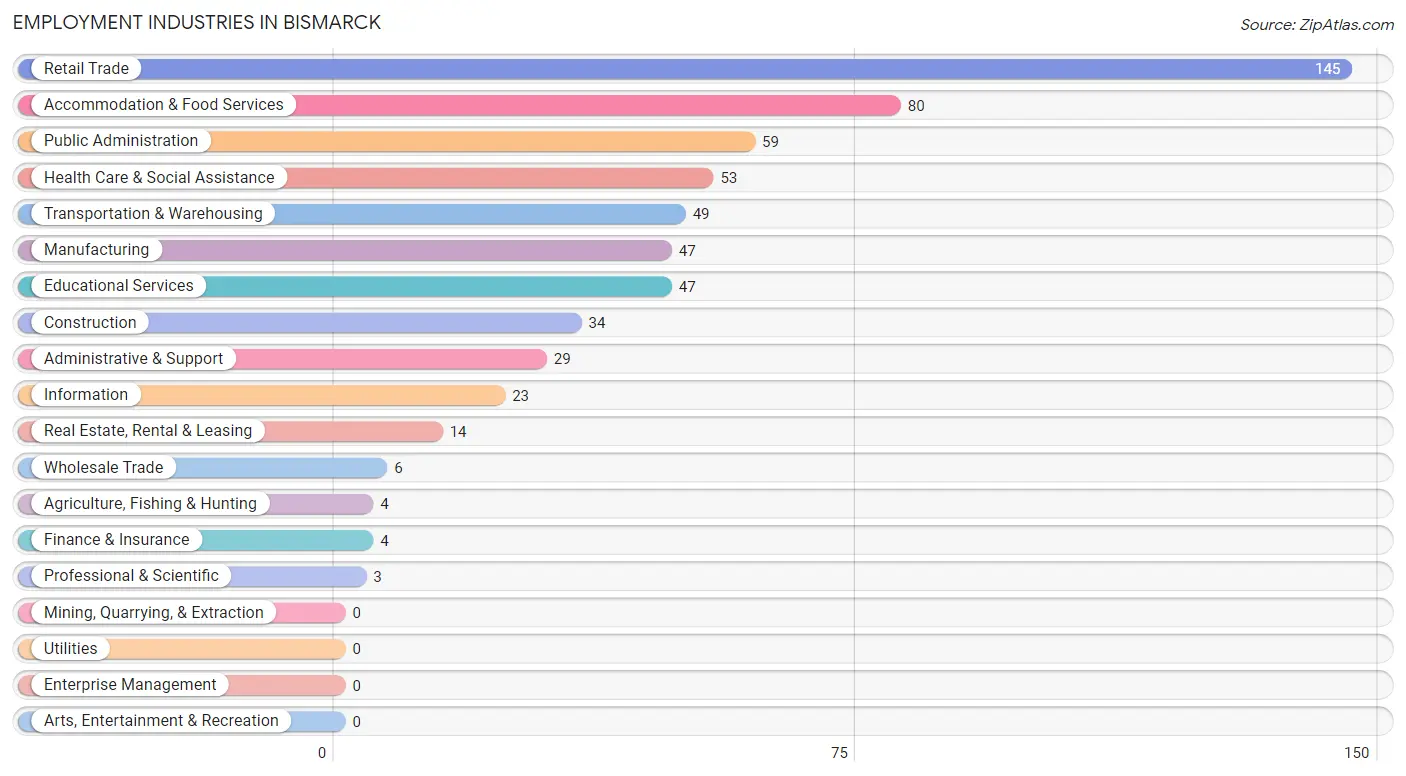
Employment Industries in Bismarck
The major employment industries in Bismarck include Retail Trade (145 | 22.8%), Accommodation & Food Services (80 | 12.6%), Public Administration (59 | 9.3%), Health Care & Social Assistance (53 | 8.4%), and Transportation & Warehousing (49 | 7.7%).
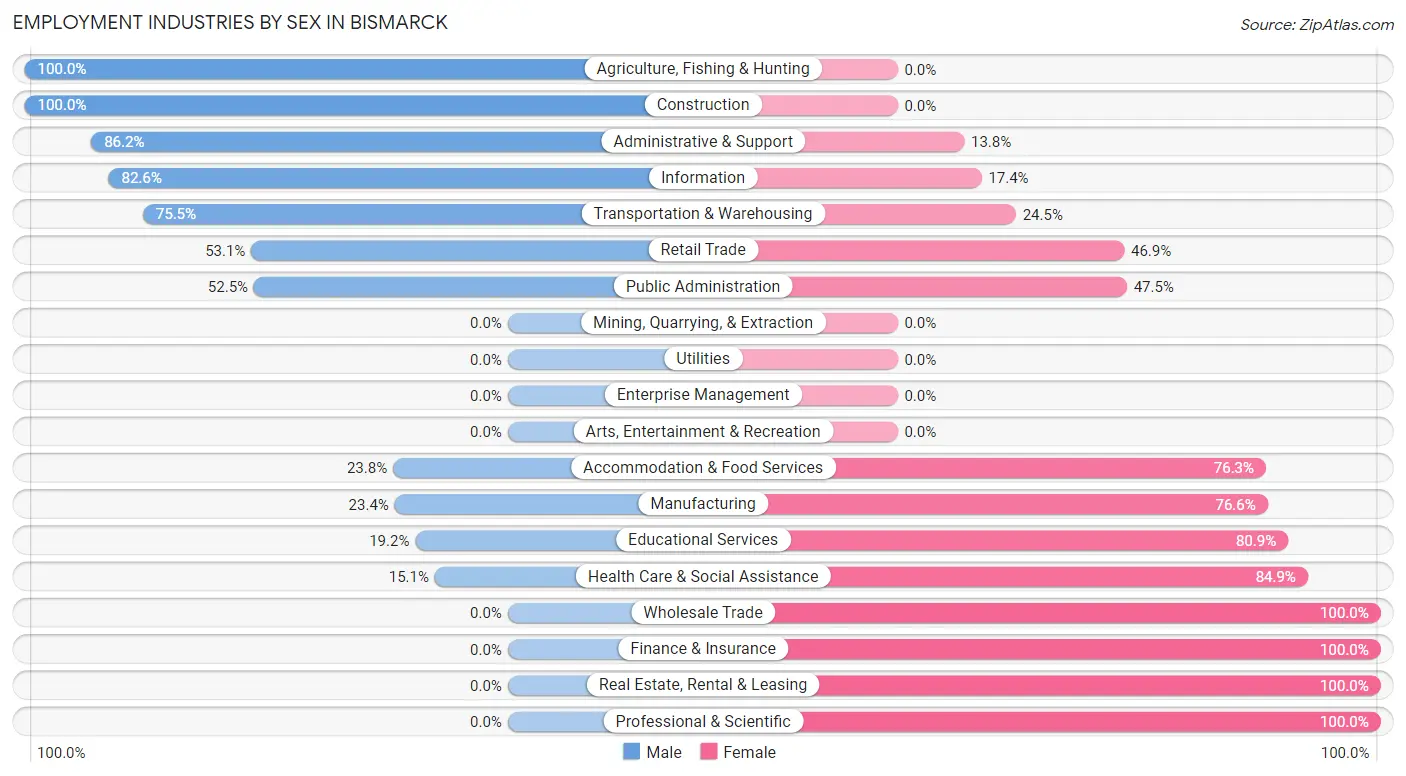
Employment Industries by Sex in Bismarck
The Bismarck industries that see more men than women are Agriculture, Fishing & Hunting (100.0%), Construction (100.0%), and Administrative & Support (86.2%), whereas the industries that tend to have a higher number of women are Wholesale Trade (100.0%), Finance & Insurance (100.0%), and Real Estate, Rental & Leasing (100.0%).
| Industry | Male | Female |
| Agriculture, Fishing & Hunting | 4 (100.0%) | 0 (0.0%) |
| Mining, Quarrying, & Extraction | 0 (0.0%) | 0 (0.0%) |
| Construction | 34 (100.0%) | 0 (0.0%) |
| Manufacturing | 11 (23.4%) | 36 (76.6%) |
| Wholesale Trade | 0 (0.0%) | 6 (100.0%) |
| Retail Trade | 77 (53.1%) | 68 (46.9%) |
| Transportation & Warehousing | 37 (75.5%) | 12 (24.5%) |
| Utilities | 0 (0.0%) | 0 (0.0%) |
| Information | 19 (82.6%) | 4 (17.4%) |
| Finance & Insurance | 0 (0.0%) | 4 (100.0%) |
| Real Estate, Rental & Leasing | 0 (0.0%) | 14 (100.0%) |
| Professional & Scientific | 0 (0.0%) | 3 (100.0%) |
| Enterprise Management | 0 (0.0%) | 0 (0.0%) |
| Administrative & Support | 25 (86.2%) | 4 (13.8%) |
| Educational Services | 9 (19.2%) | 38 (80.8%) |
| Health Care & Social Assistance | 8 (15.1%) | 45 (84.9%) |
| Arts, Entertainment & Recreation | 0 (0.0%) | 0 (0.0%) |
| Accommodation & Food Services | 19 (23.7%) | 61 (76.2%) |
| Public Administration | 31 (52.5%) | 28 (47.5%) |
| Total | 297 (46.8%) | 338 (53.2%) |
Education in Bismarck
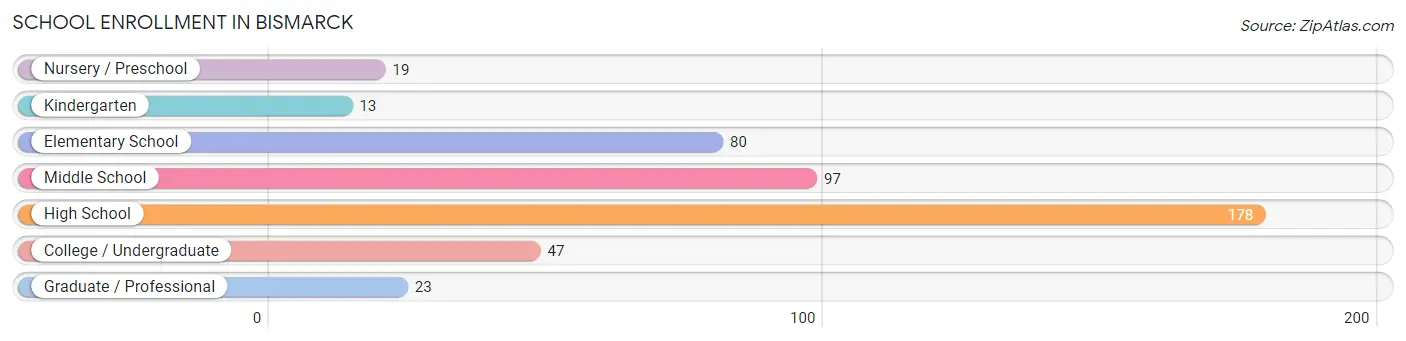
School Enrollment in Bismarck
The most common levels of schooling among the 457 students in Bismarck are high school (178 | 39.0%), middle school (97 | 21.2%), and elementary school (80 | 17.5%).
| School Level | # Students | % Students |
| Nursery / Preschool | 19 | 4.2% |
| Kindergarten | 13 | 2.8% |
| Elementary School | 80 | 17.5% |
| Middle School | 97 | 21.2% |
| High School | 178 | 39.0% |
| College / Undergraduate | 47 | 10.3% |
| Graduate / Professional | 23 | 5.0% |
| Total | 457 | 100.0% |
School Enrollment by Age by Funding Source in Bismarck
Out of a total of 457 students who are enrolled in schools in Bismarck, 34 (7.4%) attend a private institution, while the remaining 423 (92.6%) are enrolled in public schools. The age group of 20 to 24 year olds has the highest likelihood of being enrolled in private schools, with 3 (42.9% in the age bracket) enrolled. Conversely, the age group of 3 to 4 year olds has the lowest likelihood of being enrolled in a private school, with 7 (100.0% in the age bracket) attending a public institution.
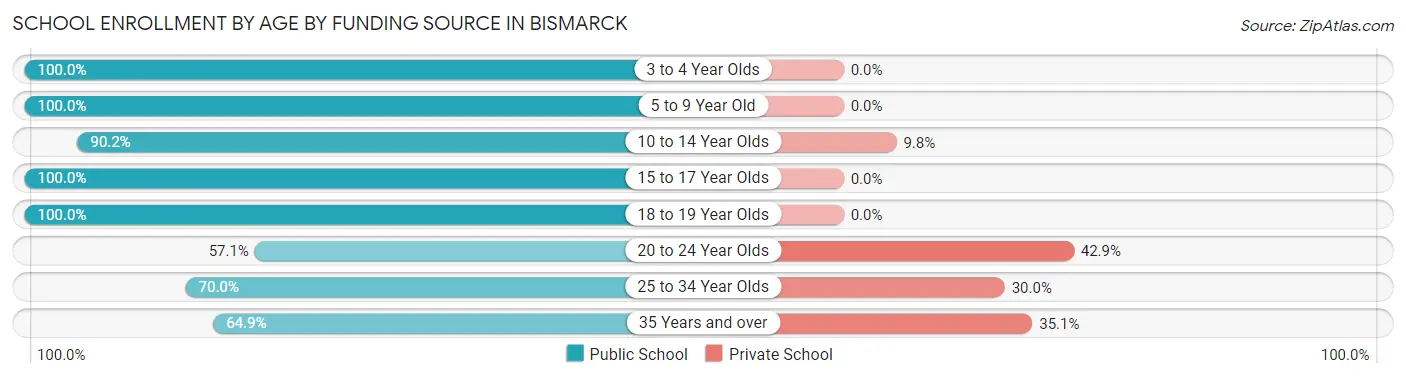
| Age Bracket | Public School | Private School |
| 3 to 4 Year Olds | 7 (100.0%) | 0 (0.0%) |
| 5 to 9 Year Old | 98 (100.0%) | 0 (0.0%) |
| 10 to 14 Year Olds | 110 (90.2%) | 12 (9.8%) |
| 15 to 17 Year Olds | 139 (100.0%) | 0 (0.0%) |
| 18 to 19 Year Olds | 27 (100.0%) | 0 (0.0%) |
| 20 to 24 Year Olds | 4 (57.1%) | 3 (42.9%) |
| 25 to 34 Year Olds | 14 (70.0%) | 6 (30.0%) |
| 35 Years and over | 24 (64.9%) | 13 (35.1%) |
| Total | 423 (92.6%) | 34 (7.4%) |
Educational Attainment by Field of Study in Bismarck
Education (51 | 31.1%), science & technology (31 | 18.9%), liberal arts & history (16 | 9.8%), bio, nature & agricultural (15 | 9.1%), and physical & health sciences (15 | 9.1%) are the most common fields of study among 164 individuals in Bismarck who have obtained a bachelor's degree or higher.
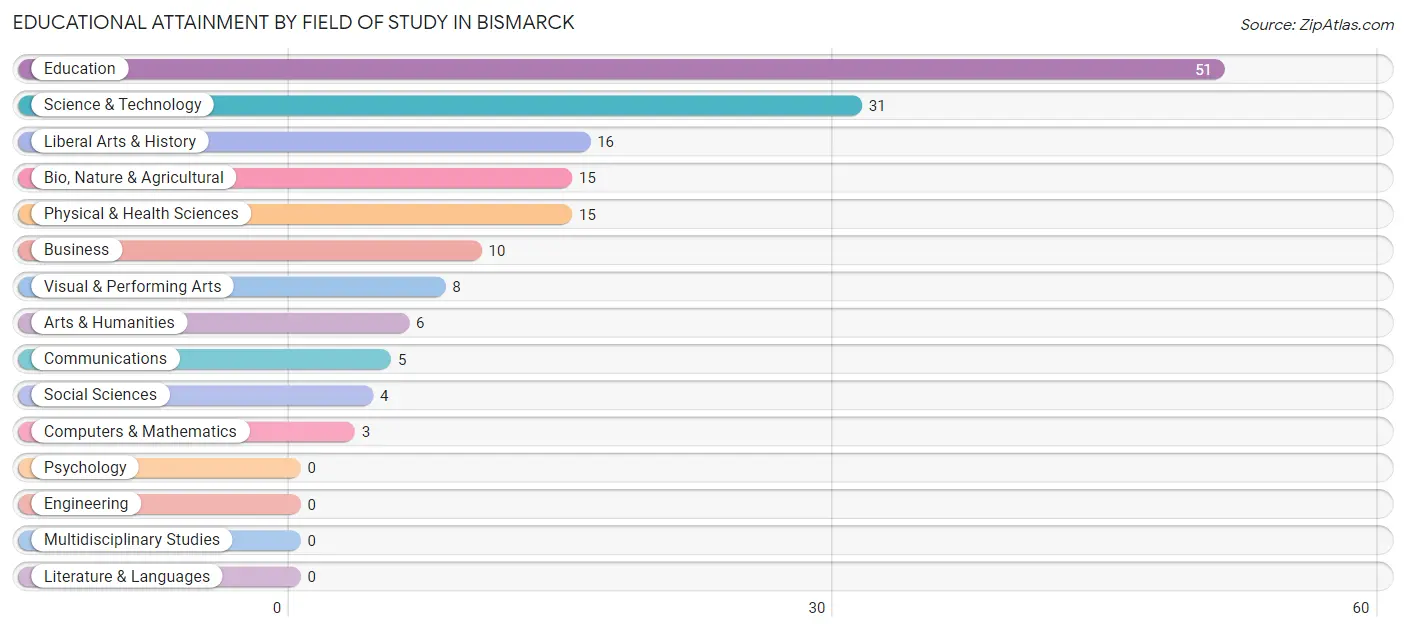
| Field of Study | # Graduates | % Graduates |
| Computers & Mathematics | 3 | 1.8% |
| Bio, Nature & Agricultural | 15 | 9.1% |
| Physical & Health Sciences | 15 | 9.1% |
| Psychology | 0 | 0.0% |
| Social Sciences | 4 | 2.4% |
| Engineering | 0 | 0.0% |
| Multidisciplinary Studies | 0 | 0.0% |
| Science & Technology | 31 | 18.9% |
| Business | 10 | 6.1% |
| Education | 51 | 31.1% |
| Literature & Languages | 0 | 0.0% |
| Liberal Arts & History | 16 | 9.8% |
| Visual & Performing Arts | 8 | 4.9% |
| Communications | 5 | 3.0% |
| Arts & Humanities | 6 | 3.7% |
| Total | 164 | 100.0% |
Transportation & Commute in Bismarck
Vehicle Availability by Sex in Bismarck
The most prevalent vehicle ownership categories in Bismarck are males with 2 vehicles (136, accounting for 47.4%) and females with 2 vehicles (122, making up 41.6%).
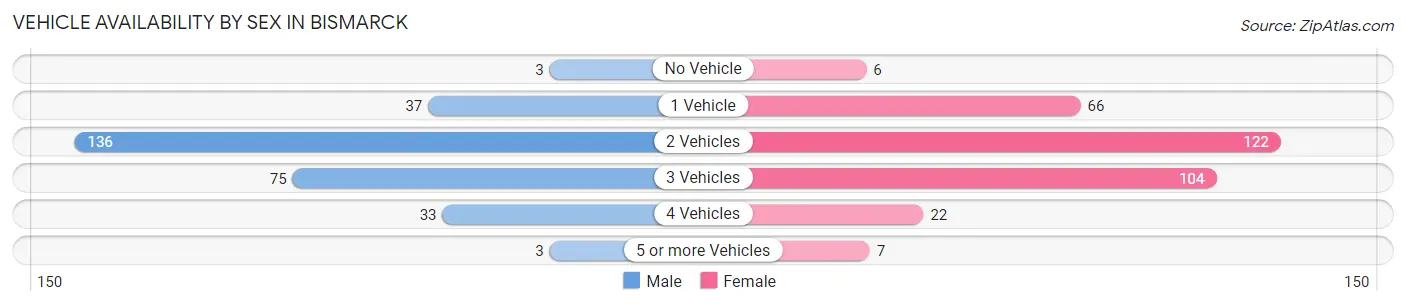
| Vehicles Available | Male | Female |
| No Vehicle | 3 (1.1%) | 6 (1.8%) |
| 1 Vehicle | 37 (12.9%) | 66 (20.2%) |
| 2 Vehicles | 136 (47.4%) | 122 (37.3%) |
| 3 Vehicles | 75 (26.1%) | 104 (31.8%) |
| 4 Vehicles | 33 (11.5%) | 22 (6.7%) |
| 5 or more Vehicles | 3 (1.1%) | 7 (2.1%) |
| Total | 287 (100.0%) | 327 (100.0%) |
Commute Time in Bismarck
The most frequently occuring commute durations in Bismarck are 20 to 24 minutes (140 commuters, 23.3%), 15 to 19 minutes (75 commuters, 12.5%), and less than 5 minutes (66 commuters, 11.0%).
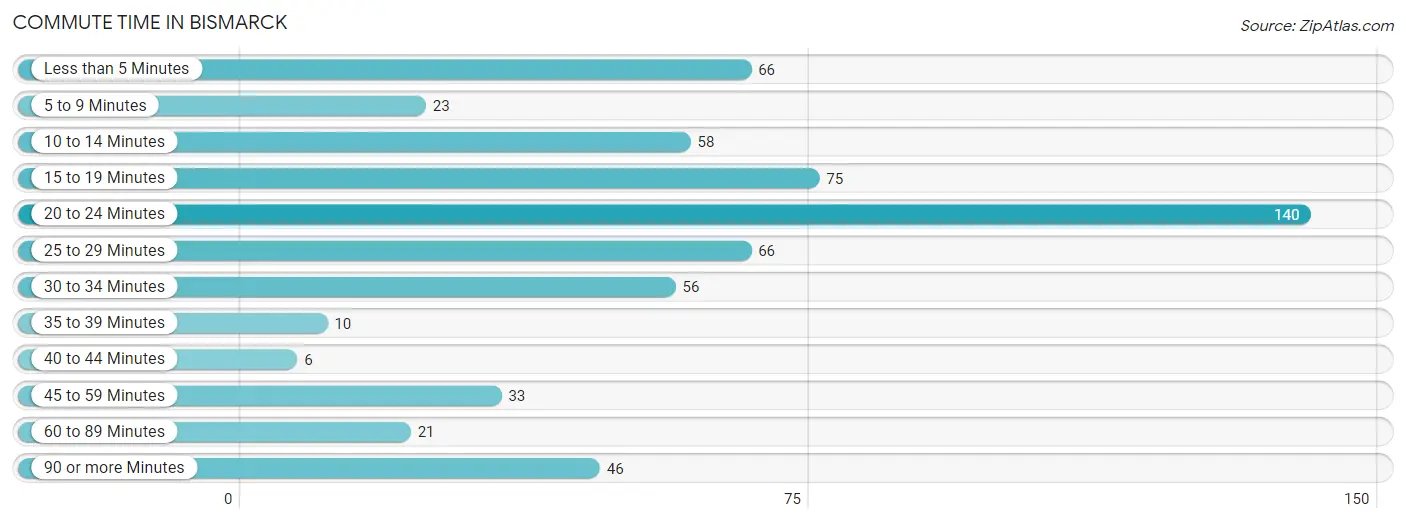
| Commute Time | # Commuters | % Commuters |
| Less than 5 Minutes | 66 | 11.0% |
| 5 to 9 Minutes | 23 | 3.8% |
| 10 to 14 Minutes | 58 | 9.7% |
| 15 to 19 Minutes | 75 | 12.5% |
| 20 to 24 Minutes | 140 | 23.3% |
| 25 to 29 Minutes | 66 | 11.0% |
| 30 to 34 Minutes | 56 | 9.3% |
| 35 to 39 Minutes | 10 | 1.7% |
| 40 to 44 Minutes | 6 | 1.0% |
| 45 to 59 Minutes | 33 | 5.5% |
| 60 to 89 Minutes | 21 | 3.5% |
| 90 or more Minutes | 46 | 7.7% |
Commute Time by Sex in Bismarck
The most common commute times in Bismarck are less than 5 minutes (56 commuters, 19.9%) for males and 20 to 24 minutes (89 commuters, 27.9%) for females.
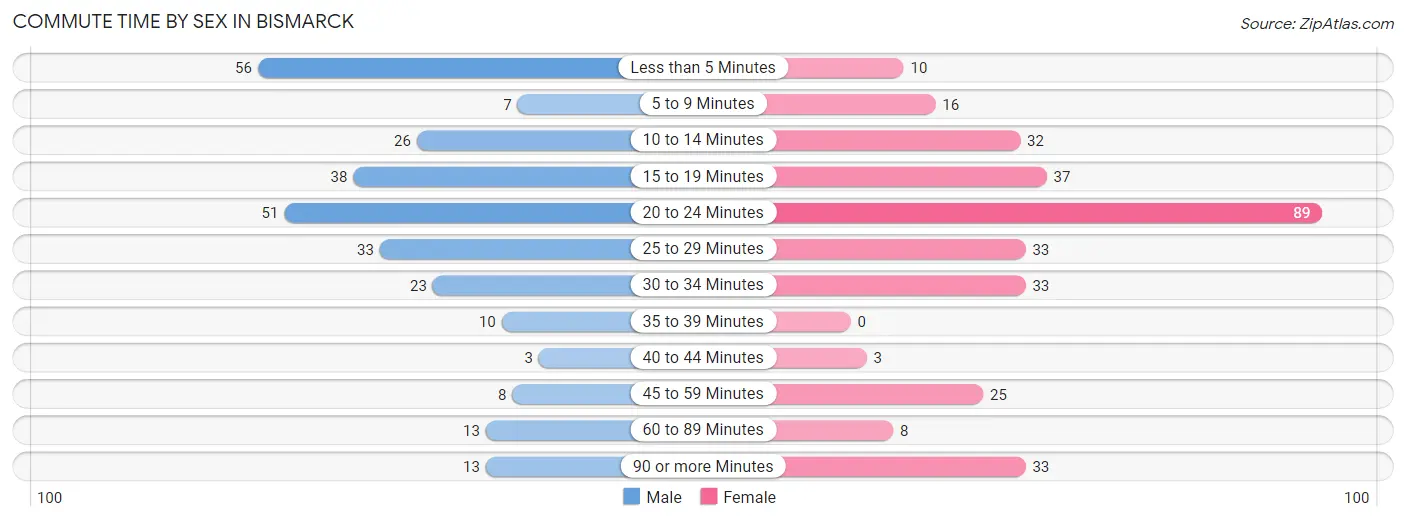
| Commute Time | Male | Female |
| Less than 5 Minutes | 56 (19.9%) | 10 (3.1%) |
| 5 to 9 Minutes | 7 (2.5%) | 16 (5.0%) |
| 10 to 14 Minutes | 26 (9.2%) | 32 (10.0%) |
| 15 to 19 Minutes | 38 (13.5%) | 37 (11.6%) |
| 20 to 24 Minutes | 51 (18.1%) | 89 (27.9%) |
| 25 to 29 Minutes | 33 (11.7%) | 33 (10.3%) |
| 30 to 34 Minutes | 23 (8.2%) | 33 (10.3%) |
| 35 to 39 Minutes | 10 (3.6%) | 0 (0.0%) |
| 40 to 44 Minutes | 3 (1.1%) | 3 (0.9%) |
| 45 to 59 Minutes | 8 (2.9%) | 25 (7.8%) |
| 60 to 89 Minutes | 13 (4.6%) | 8 (2.5%) |
| 90 or more Minutes | 13 (4.6%) | 33 (10.3%) |
Time of Departure to Work by Sex in Bismarck
The most frequent times of departure to work in Bismarck are 12:00 AM to 4:59 AM (46, 16.4%) for males and 7:30 AM to 7:59 AM (70, 21.9%) for females.
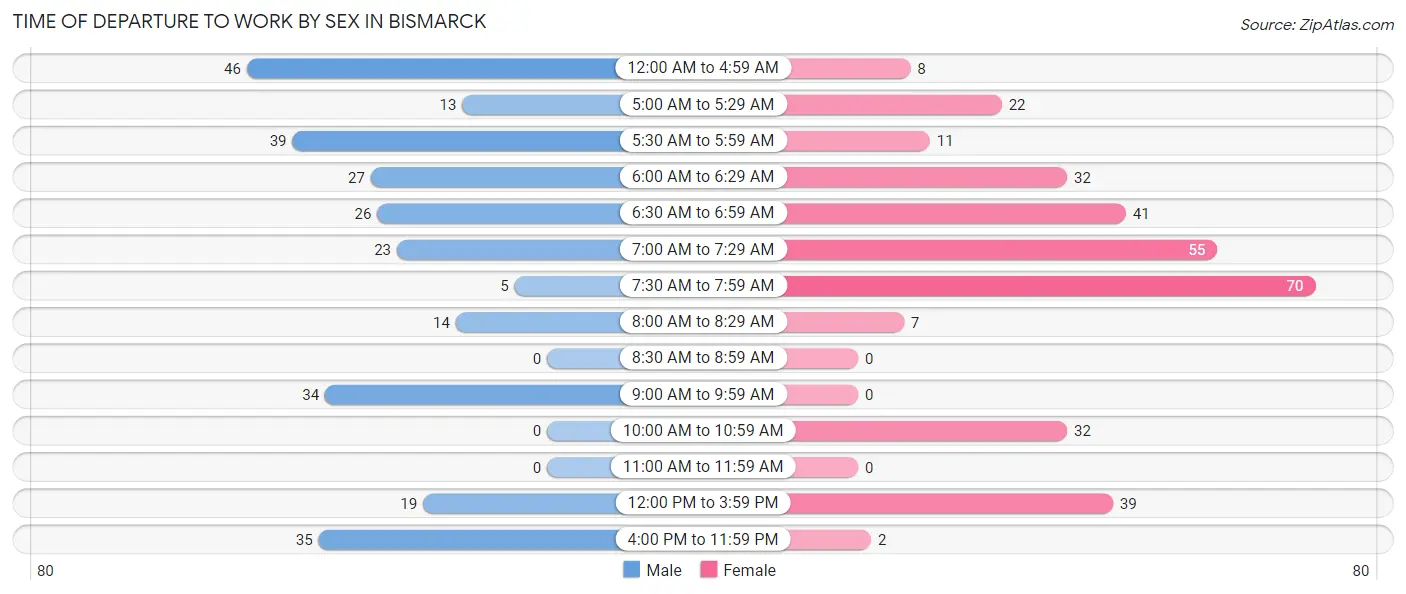
| Time of Departure | Male | Female |
| 12:00 AM to 4:59 AM | 46 (16.4%) | 8 (2.5%) |
| 5:00 AM to 5:29 AM | 13 (4.6%) | 22 (6.9%) |
| 5:30 AM to 5:59 AM | 39 (13.9%) | 11 (3.5%) |
| 6:00 AM to 6:29 AM | 27 (9.6%) | 32 (10.0%) |
| 6:30 AM to 6:59 AM | 26 (9.2%) | 41 (12.9%) |
| 7:00 AM to 7:29 AM | 23 (8.2%) | 55 (17.2%) |
| 7:30 AM to 7:59 AM | 5 (1.8%) | 70 (21.9%) |
| 8:00 AM to 8:29 AM | 14 (5.0%) | 7 (2.2%) |
| 8:30 AM to 8:59 AM | 0 (0.0%) | 0 (0.0%) |
| 9:00 AM to 9:59 AM | 34 (12.1%) | 0 (0.0%) |
| 10:00 AM to 10:59 AM | 0 (0.0%) | 32 (10.0%) |
| 11:00 AM to 11:59 AM | 0 (0.0%) | 0 (0.0%) |
| 12:00 PM to 3:59 PM | 19 (6.8%) | 39 (12.2%) |
| 4:00 PM to 11:59 PM | 35 (12.5%) | 2 (0.6%) |
| Total | 281 (100.0%) | 319 (100.0%) |
Housing Occupancy in Bismarck
Occupancy by Ownership in Bismarck
Of the total 589 dwellings in Bismarck, owner-occupied units account for 405 (68.8%), while renter-occupied units make up 184 (31.2%).
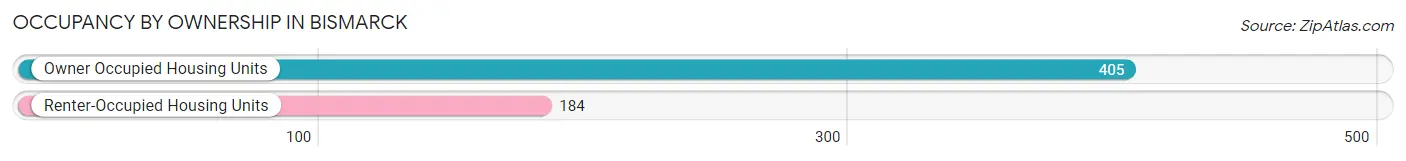
| Occupancy | # Housing Units | % Housing Units |
| Owner Occupied Housing Units | 405 | 68.8% |
| Renter-Occupied Housing Units | 184 | 31.2% |
| Total Occupied Housing Units | 589 | 100.0% |
Occupancy by Household Size in Bismarck
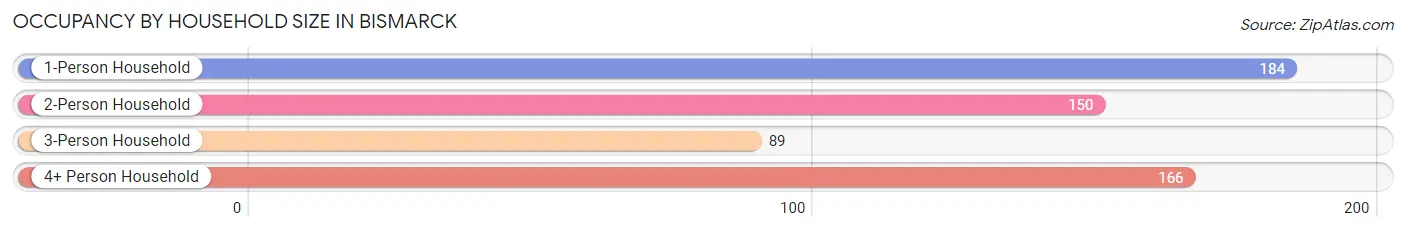
| Household Size | # Housing Units | % Housing Units |
| 1-Person Household | 184 | 31.2% |
| 2-Person Household | 150 | 25.5% |
| 3-Person Household | 89 | 15.1% |
| 4+ Person Household | 166 | 28.2% |
| Total Housing Units | 589 | 100.0% |
Occupancy by Ownership by Household Size in Bismarck
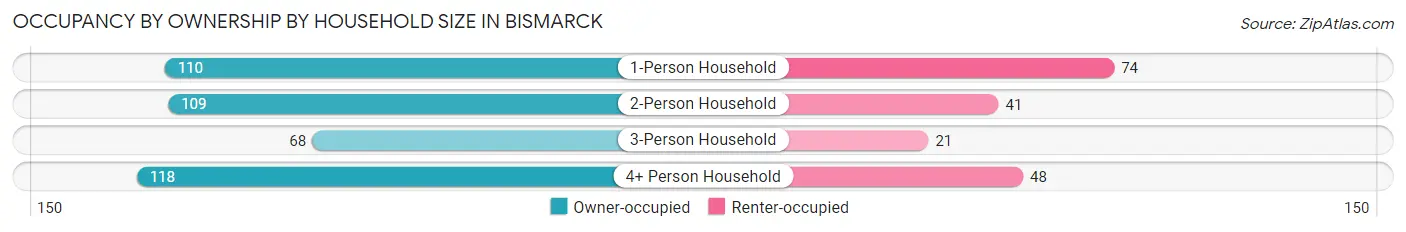
| Household Size | Owner-occupied | Renter-occupied |
| 1-Person Household | 110 (59.8%) | 74 (40.2%) |
| 2-Person Household | 109 (72.7%) | 41 (27.3%) |
| 3-Person Household | 68 (76.4%) | 21 (23.6%) |
| 4+ Person Household | 118 (71.1%) | 48 (28.9%) |
| Total Housing Units | 405 (68.8%) | 184 (31.2%) |
Occupancy by Educational Attainment in Bismarck
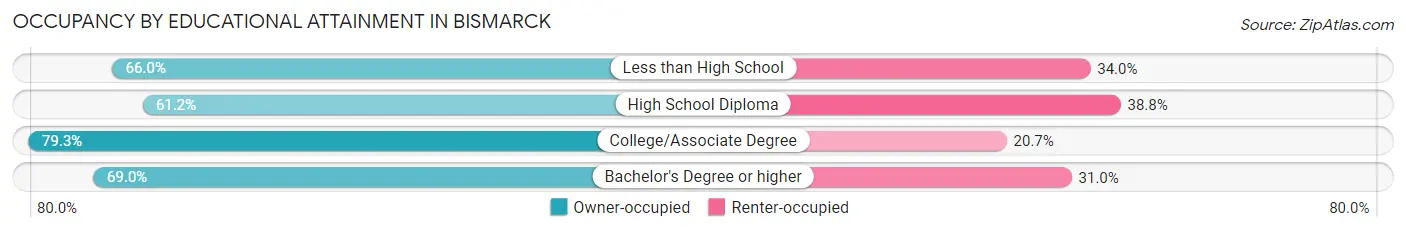
| Household Size | Owner-occupied | Renter-occupied |
| Less than High School | 70 (66.0%) | 36 (34.0%) |
| High School Diploma | 128 (61.2%) | 81 (38.8%) |
| College/Associate Degree | 138 (79.3%) | 36 (20.7%) |
| Bachelor's Degree or higher | 69 (69.0%) | 31 (31.0%) |
Occupancy by Age of Householder in Bismarck
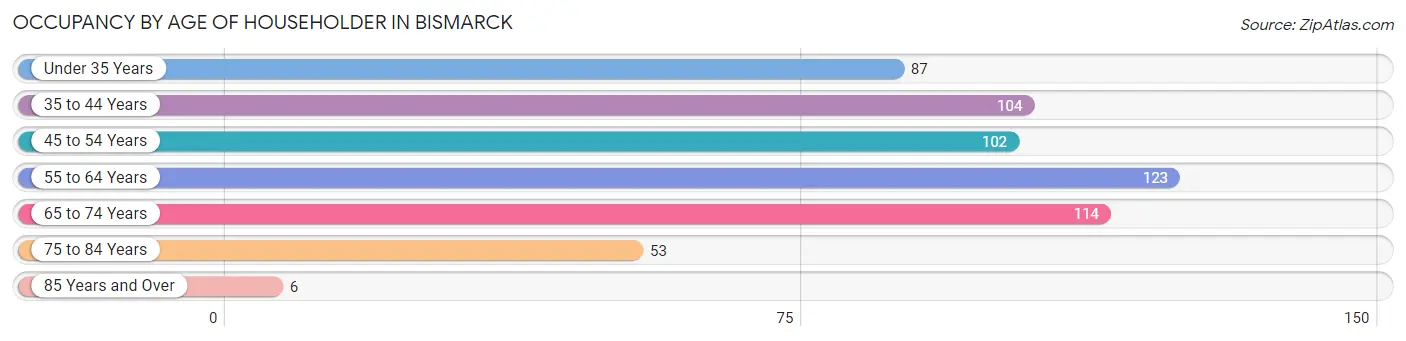
| Age Bracket | # Households | % Households |
| Under 35 Years | 87 | 14.8% |
| 35 to 44 Years | 104 | 17.7% |
| 45 to 54 Years | 102 | 17.3% |
| 55 to 64 Years | 123 | 20.9% |
| 65 to 74 Years | 114 | 19.4% |
| 75 to 84 Years | 53 | 9.0% |
| 85 Years and Over | 6 | 1.0% |
| Total | 589 | 100.0% |
Housing Finances in Bismarck
Median Income by Occupancy in Bismarck
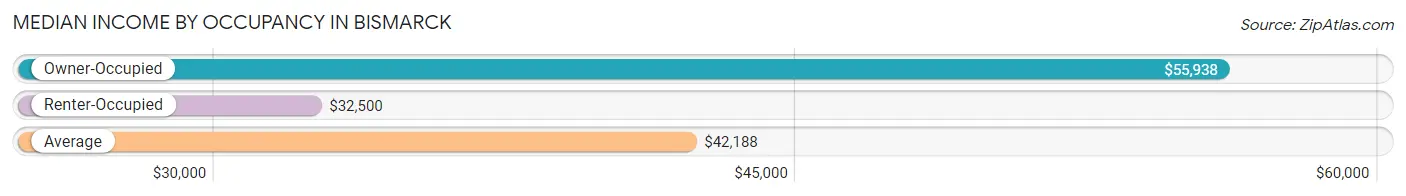
| Occupancy Type | # Households | Median Income |
| Owner-Occupied | 405 (68.8%) | $55,938 |
| Renter-Occupied | 184 (31.2%) | $32,500 |
| Average | 589 (100.0%) | $42,188 |
Occupancy by Householder Income Bracket in Bismarck
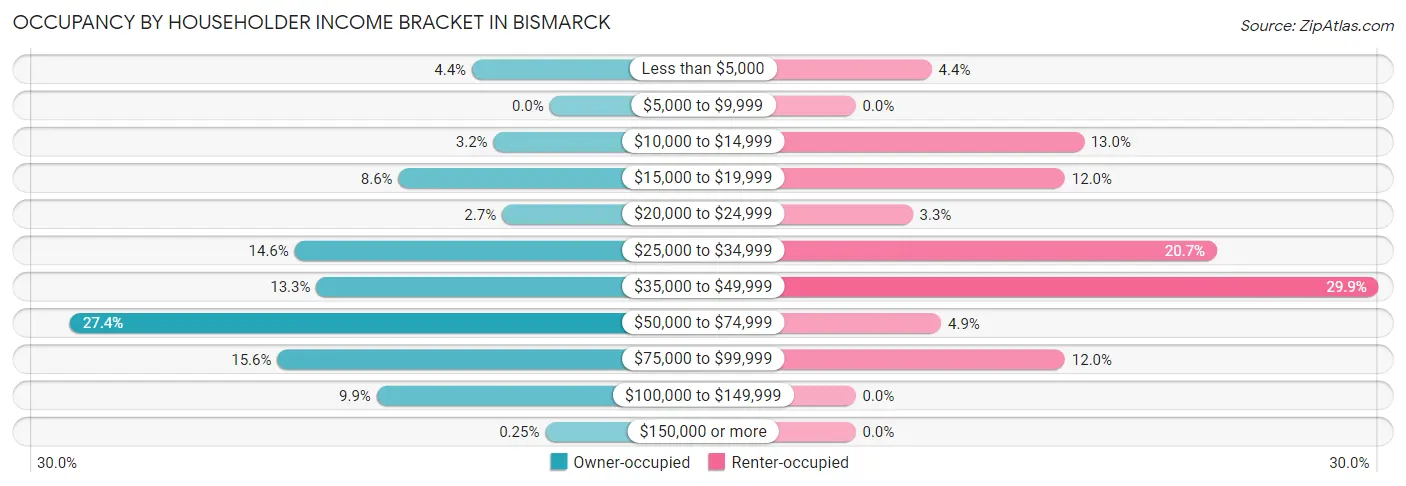
| Income Bracket | Owner-occupied | Renter-occupied |
| Less than $5,000 | 18 (4.4%) | 8 (4.3%) |
| $5,000 to $9,999 | 0 (0.0%) | 0 (0.0%) |
| $10,000 to $14,999 | 13 (3.2%) | 24 (13.0%) |
| $15,000 to $19,999 | 35 (8.6%) | 22 (12.0%) |
| $20,000 to $24,999 | 11 (2.7%) | 6 (3.3%) |
| $25,000 to $34,999 | 59 (14.6%) | 38 (20.6%) |
| $35,000 to $49,999 | 54 (13.3%) | 55 (29.9%) |
| $50,000 to $74,999 | 111 (27.4%) | 9 (4.9%) |
| $75,000 to $99,999 | 63 (15.6%) | 22 (12.0%) |
| $100,000 to $149,999 | 40 (9.9%) | 0 (0.0%) |
| $150,000 or more | 1 (0.3%) | 0 (0.0%) |
| Total | 405 (100.0%) | 184 (100.0%) |
Monthly Housing Cost Tiers in Bismarck
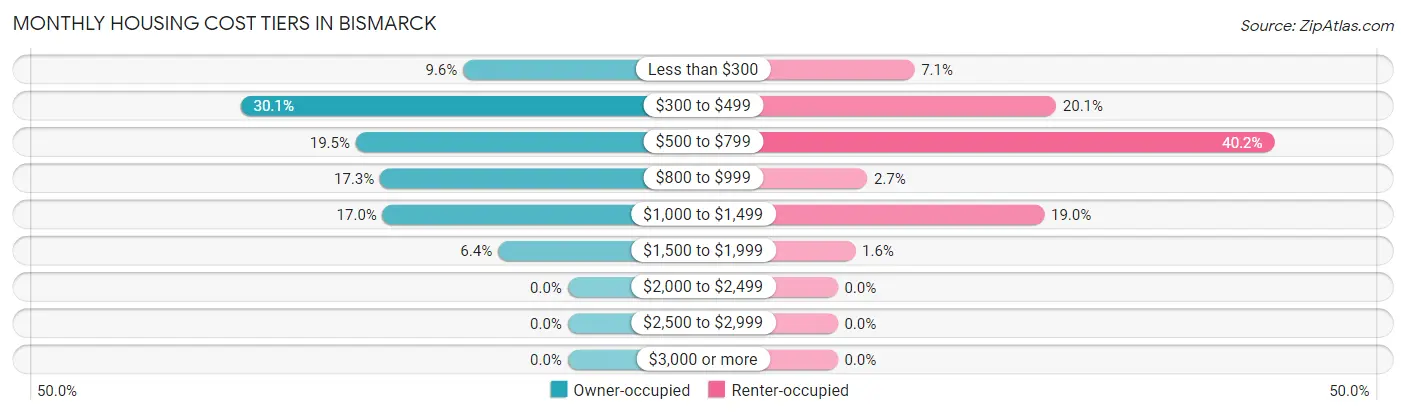
| Monthly Cost | Owner-occupied | Renter-occupied |
| Less than $300 | 39 (9.6%) | 13 (7.1%) |
| $300 to $499 | 122 (30.1%) | 37 (20.1%) |
| $500 to $799 | 79 (19.5%) | 74 (40.2%) |
| $800 to $999 | 70 (17.3%) | 5 (2.7%) |
| $1,000 to $1,499 | 69 (17.0%) | 35 (19.0%) |
| $1,500 to $1,999 | 26 (6.4%) | 3 (1.6%) |
| $2,000 to $2,499 | 0 (0.0%) | 0 (0.0%) |
| $2,500 to $2,999 | 0 (0.0%) | 0 (0.0%) |
| $3,000 or more | 0 (0.0%) | 0 (0.0%) |
| Total | 405 (100.0%) | 184 (100.0%) |
Physical Housing Characteristics in Bismarck
Housing Structures in Bismarck
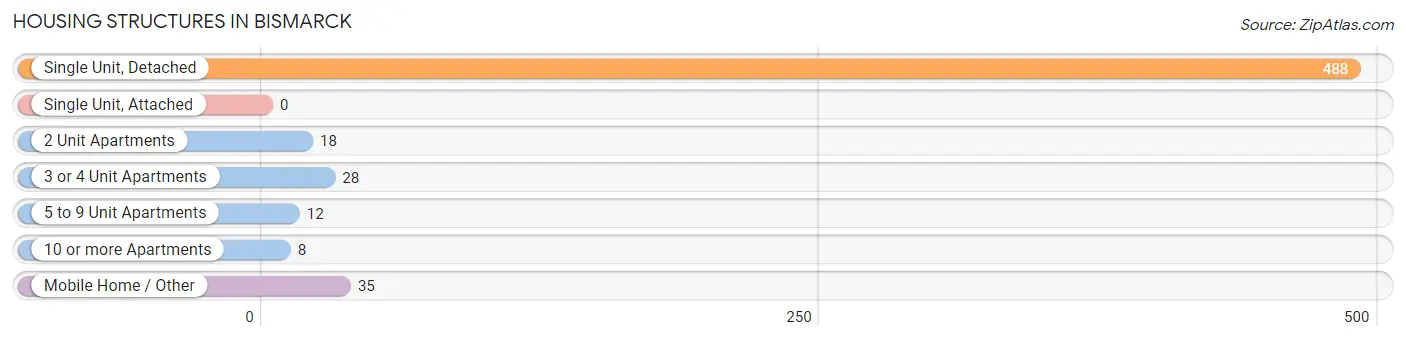
| Structure Type | # Housing Units | % Housing Units |
| Single Unit, Detached | 488 | 82.9% |
| Single Unit, Attached | 0 | 0.0% |
| 2 Unit Apartments | 18 | 3.1% |
| 3 or 4 Unit Apartments | 28 | 4.8% |
| 5 to 9 Unit Apartments | 12 | 2.0% |
| 10 or more Apartments | 8 | 1.4% |
| Mobile Home / Other | 35 | 5.9% |
| Total | 589 | 100.0% |
Housing Structures by Occupancy in Bismarck
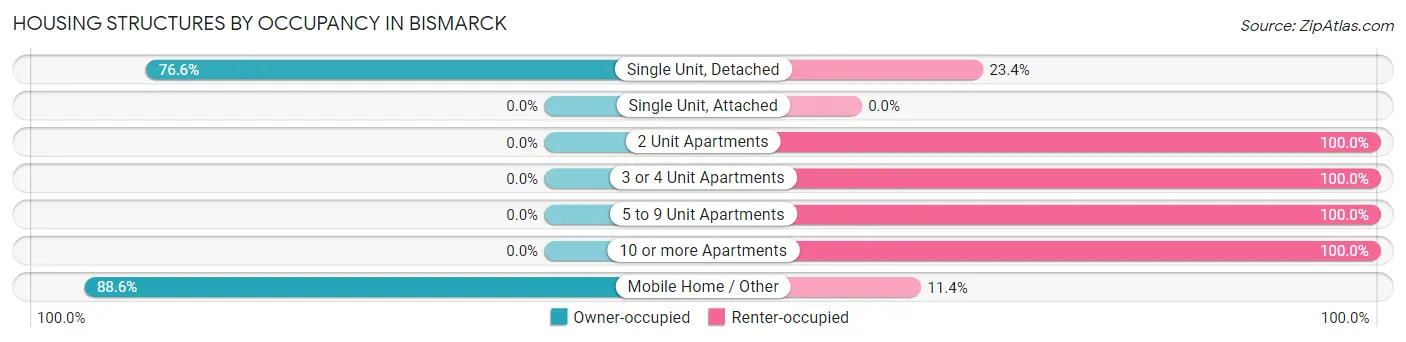
| Structure Type | Owner-occupied | Renter-occupied |
| Single Unit, Detached | 374 (76.6%) | 114 (23.4%) |
| Single Unit, Attached | 0 (0.0%) | 0 (0.0%) |
| 2 Unit Apartments | 0 (0.0%) | 18 (100.0%) |
| 3 or 4 Unit Apartments | 0 (0.0%) | 28 (100.0%) |
| 5 to 9 Unit Apartments | 0 (0.0%) | 12 (100.0%) |
| 10 or more Apartments | 0 (0.0%) | 8 (100.0%) |
| Mobile Home / Other | 31 (88.6%) | 4 (11.4%) |
| Total | 405 (68.8%) | 184 (31.2%) |
Housing Structures by Number of Rooms in Bismarck
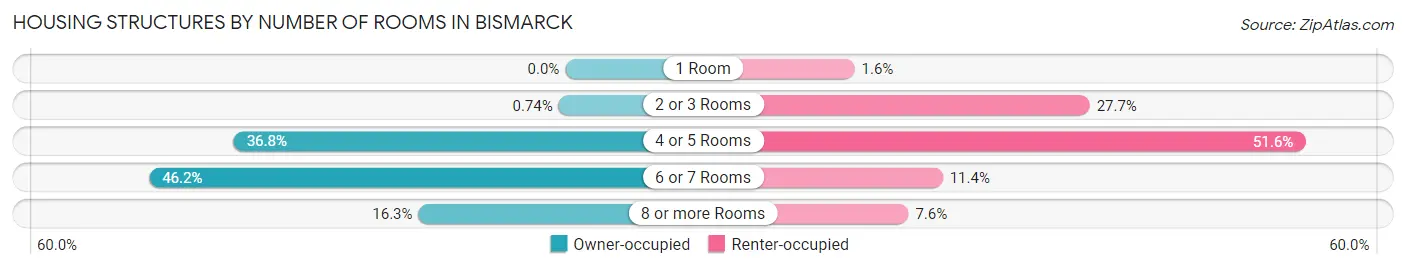
| Number of Rooms | Owner-occupied | Renter-occupied |
| 1 Room | 0 (0.0%) | 3 (1.6%) |
| 2 or 3 Rooms | 3 (0.7%) | 51 (27.7%) |
| 4 or 5 Rooms | 149 (36.8%) | 95 (51.6%) |
| 6 or 7 Rooms | 187 (46.2%) | 21 (11.4%) |
| 8 or more Rooms | 66 (16.3%) | 14 (7.6%) |
| Total | 405 (100.0%) | 184 (100.0%) |
Housing Structure by Heating Type in Bismarck
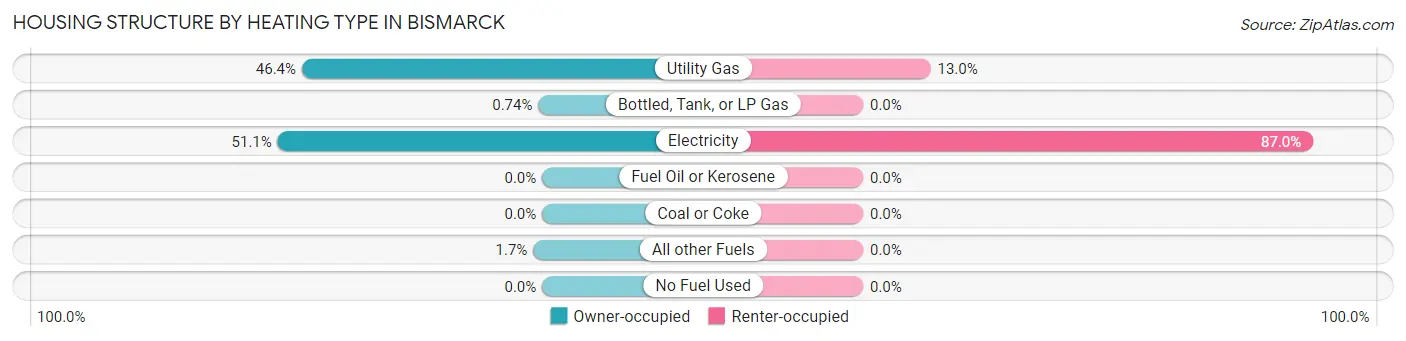
| Heating Type | Owner-occupied | Renter-occupied |
| Utility Gas | 188 (46.4%) | 24 (13.0%) |
| Bottled, Tank, or LP Gas | 3 (0.7%) | 0 (0.0%) |
| Electricity | 207 (51.1%) | 160 (87.0%) |
| Fuel Oil or Kerosene | 0 (0.0%) | 0 (0.0%) |
| Coal or Coke | 0 (0.0%) | 0 (0.0%) |
| All other Fuels | 7 (1.7%) | 0 (0.0%) |
| No Fuel Used | 0 (0.0%) | 0 (0.0%) |
| Total | 405 (100.0%) | 184 (100.0%) |
Household Vehicle Usage in Bismarck
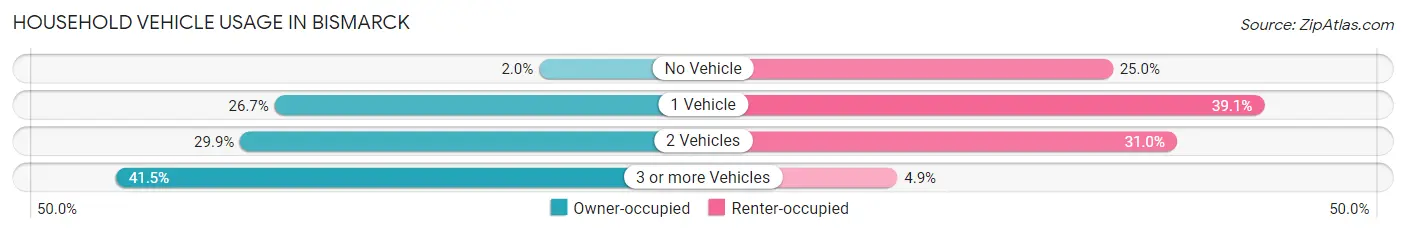
| Vehicles per Household | Owner-occupied | Renter-occupied |
| No Vehicle | 8 (2.0%) | 46 (25.0%) |
| 1 Vehicle | 108 (26.7%) | 72 (39.1%) |
| 2 Vehicles | 121 (29.9%) | 57 (31.0%) |
| 3 or more Vehicles | 168 (41.5%) | 9 (4.9%) |
| Total | 405 (100.0%) | 184 (100.0%) |
Real Estate & Mortgages in Bismarck
Real Estate and Mortgage Overview in Bismarck
| Characteristic | Without Mortgage | With Mortgage |
| Housing Units | 188 | 217 |
| Median Property Value | $102,500 | $97,000 |
| Median Household Income | $31,818 | $0 |
| Monthly Housing Costs | $342 | $0 |
| Real Estate Taxes | $714 | $0 |
Property Value by Mortgage Status in Bismarck
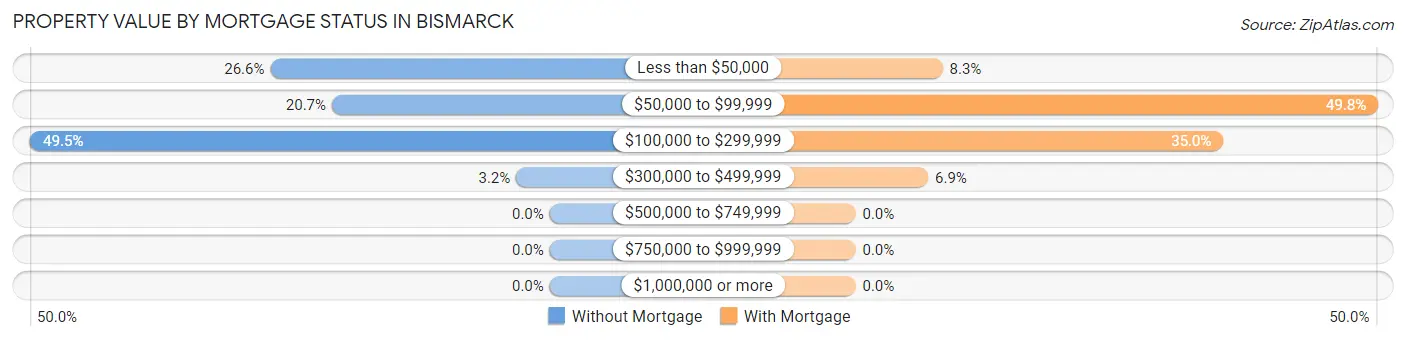
| Property Value | Without Mortgage | With Mortgage |
| Less than $50,000 | 50 (26.6%) | 18 (8.3%) |
| $50,000 to $99,999 | 39 (20.7%) | 108 (49.8%) |
| $100,000 to $299,999 | 93 (49.5%) | 76 (35.0%) |
| $300,000 to $499,999 | 6 (3.2%) | 15 (6.9%) |
| $500,000 to $749,999 | 0 (0.0%) | 0 (0.0%) |
| $750,000 to $999,999 | 0 (0.0%) | 0 (0.0%) |
| $1,000,000 or more | 0 (0.0%) | 0 (0.0%) |
| Total | 188 (100.0%) | 217 (100.0%) |
Household Income by Mortgage Status in Bismarck
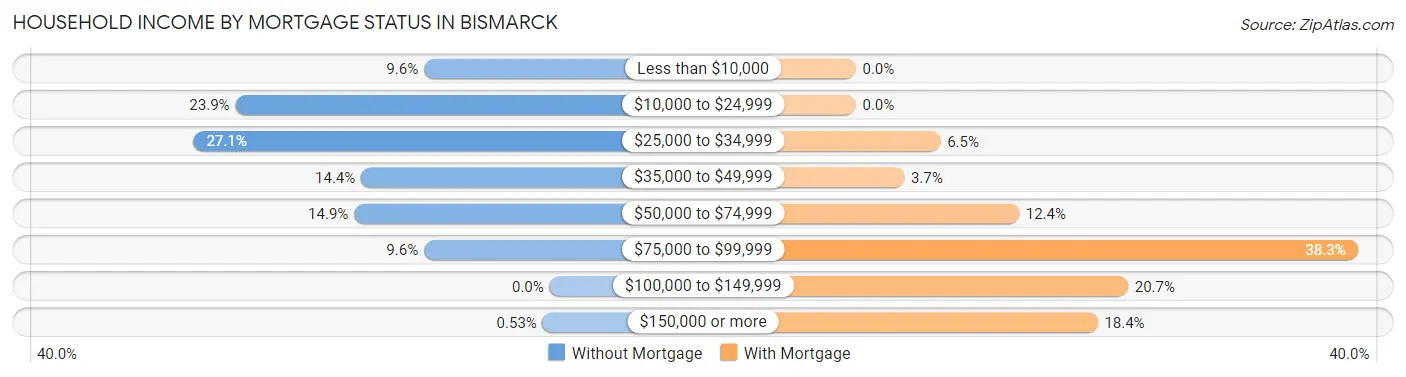
| Household Income | Without Mortgage | With Mortgage |
| Less than $10,000 | 18 (9.6%) | 0 (0.0%) |
| $10,000 to $24,999 | 45 (23.9%) | 0 (0.0%) |
| $25,000 to $34,999 | 51 (27.1%) | 14 (6.5%) |
| $35,000 to $49,999 | 27 (14.4%) | 8 (3.7%) |
| $50,000 to $74,999 | 28 (14.9%) | 27 (12.4%) |
| $75,000 to $99,999 | 18 (9.6%) | 83 (38.3%) |
| $100,000 to $149,999 | 0 (0.0%) | 45 (20.7%) |
| $150,000 or more | 1 (0.5%) | 40 (18.4%) |
| Total | 188 (100.0%) | 217 (100.0%) |
Property Value to Household Income Ratio in Bismarck
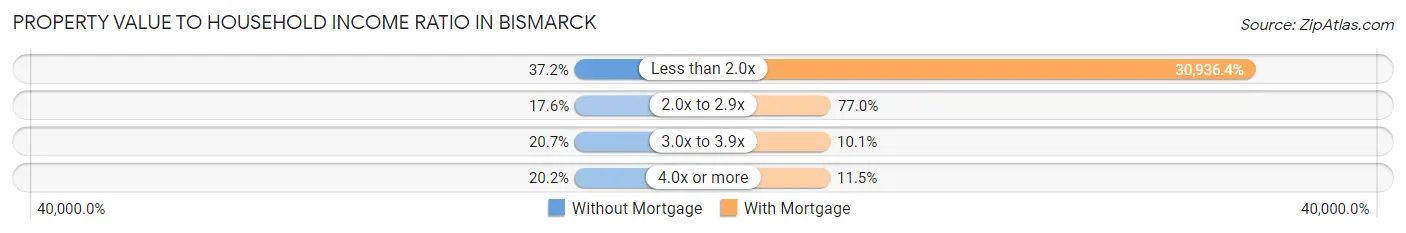
| Value-to-Income Ratio | Without Mortgage | With Mortgage |
| Less than 2.0x | 70 (37.2%) | 67,132 (30,936.4%) |
| 2.0x to 2.9x | 33 (17.5%) | 167 (77.0%) |
| 3.0x to 3.9x | 39 (20.7%) | 22 (10.1%) |
| 4.0x or more | 38 (20.2%) | 25 (11.5%) |
| Total | 188 (100.0%) | 217 (100.0%) |
Real Estate Taxes by Mortgage Status in Bismarck
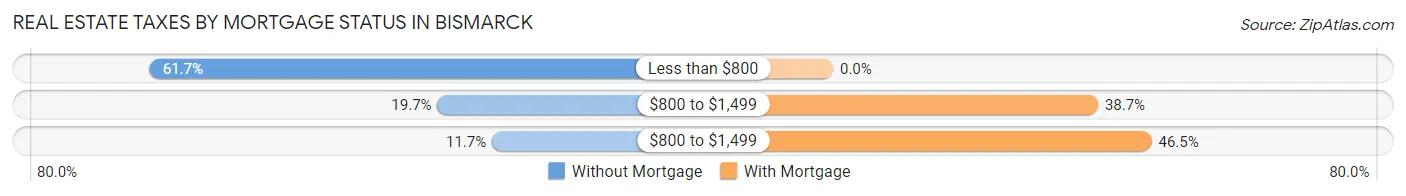
| Property Taxes | Without Mortgage | With Mortgage |
| Less than $800 | 116 (61.7%) | 0 (0.0%) |
| $800 to $1,499 | 37 (19.7%) | 84 (38.7%) |
| $800 to $1,499 | 22 (11.7%) | 101 (46.5%) |
| Total | 188 (100.0%) | 217 (100.0%) |
Health & Disability in Bismarck
Health Insurance Coverage by Age in Bismarck
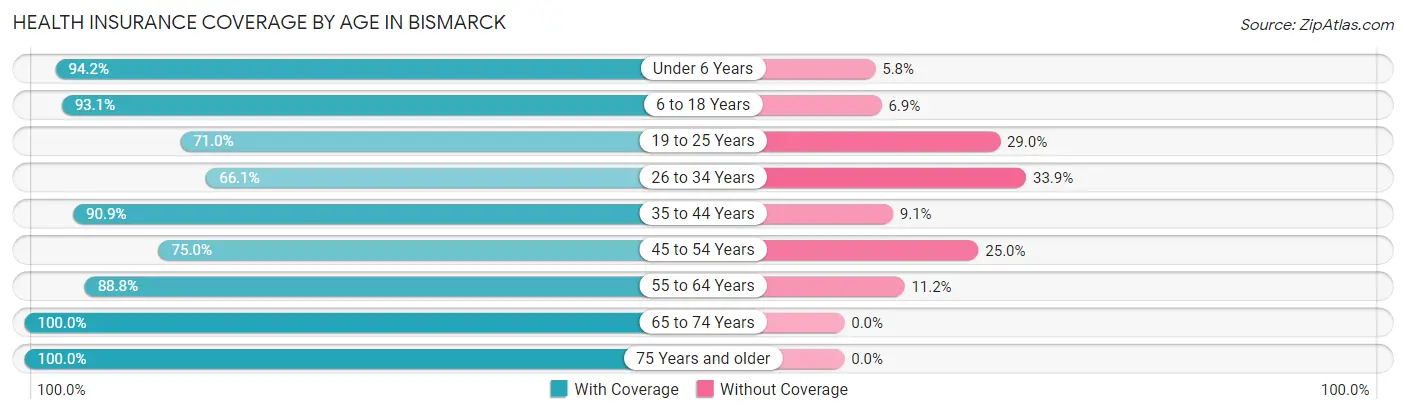
| Age Bracket | With Coverage | Without Coverage |
| Under 6 Years | 163 (94.2%) | 10 (5.8%) |
| 6 to 18 Years | 336 (93.1%) | 25 (6.9%) |
| 19 to 25 Years | 66 (71.0%) | 27 (29.0%) |
| 26 to 34 Years | 119 (66.1%) | 61 (33.9%) |
| 35 to 44 Years | 231 (90.9%) | 23 (9.1%) |
| 45 to 54 Years | 117 (75.0%) | 39 (25.0%) |
| 55 to 64 Years | 174 (88.8%) | 22 (11.2%) |
| 65 to 74 Years | 142 (100.0%) | 0 (0.0%) |
| 75 Years and older | 62 (100.0%) | 0 (0.0%) |
| Total | 1,410 (87.2%) | 207 (12.8%) |
Health Insurance Coverage by Citizenship Status in Bismarck
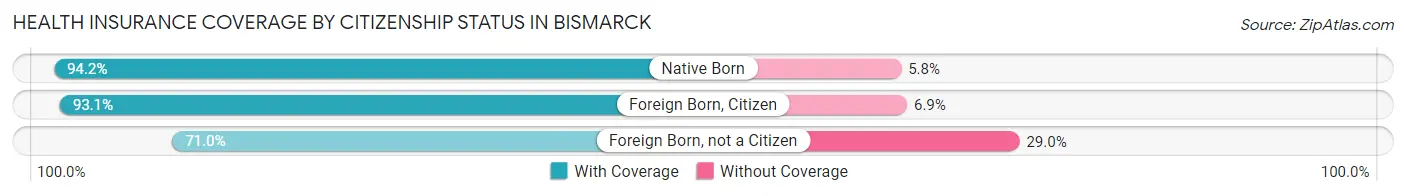
| Citizenship Status | With Coverage | Without Coverage |
| Native Born | 163 (94.2%) | 10 (5.8%) |
| Foreign Born, Citizen | 336 (93.1%) | 25 (6.9%) |
| Foreign Born, not a Citizen | 66 (71.0%) | 27 (29.0%) |
Health Insurance Coverage by Household Income in Bismarck
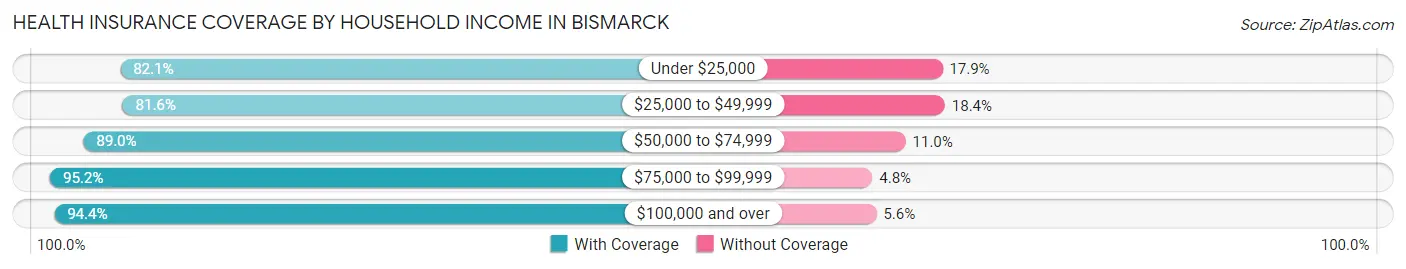
| Household Income | With Coverage | Without Coverage |
| Under $25,000 | 197 (82.1%) | 43 (17.9%) |
| $25,000 to $49,999 | 400 (81.6%) | 90 (18.4%) |
| $50,000 to $74,999 | 436 (89.0%) | 54 (11.0%) |
| $75,000 to $99,999 | 239 (95.2%) | 12 (4.8%) |
| $100,000 and over | 136 (94.4%) | 8 (5.6%) |
Public vs Private Health Insurance Coverage by Age in Bismarck
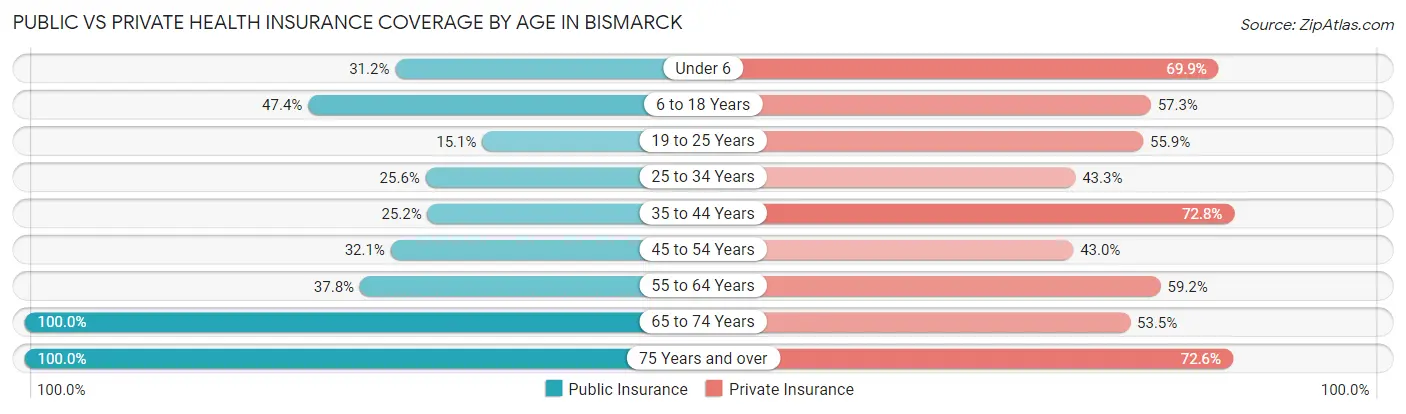
| Age Bracket | Public Insurance | Private Insurance |
| Under 6 | 54 (31.2%) | 121 (69.9%) |
| 6 to 18 Years | 171 (47.4%) | 207 (57.3%) |
| 19 to 25 Years | 14 (15.0%) | 52 (55.9%) |
| 25 to 34 Years | 46 (25.6%) | 78 (43.3%) |
| 35 to 44 Years | 64 (25.2%) | 185 (72.8%) |
| 45 to 54 Years | 50 (32.1%) | 67 (42.9%) |
| 55 to 64 Years | 74 (37.8%) | 116 (59.2%) |
| 65 to 74 Years | 142 (100.0%) | 76 (53.5%) |
| 75 Years and over | 62 (100.0%) | 45 (72.6%) |
| Total | 677 (41.9%) | 947 (58.6%) |
Disability Status by Sex by Age in Bismarck
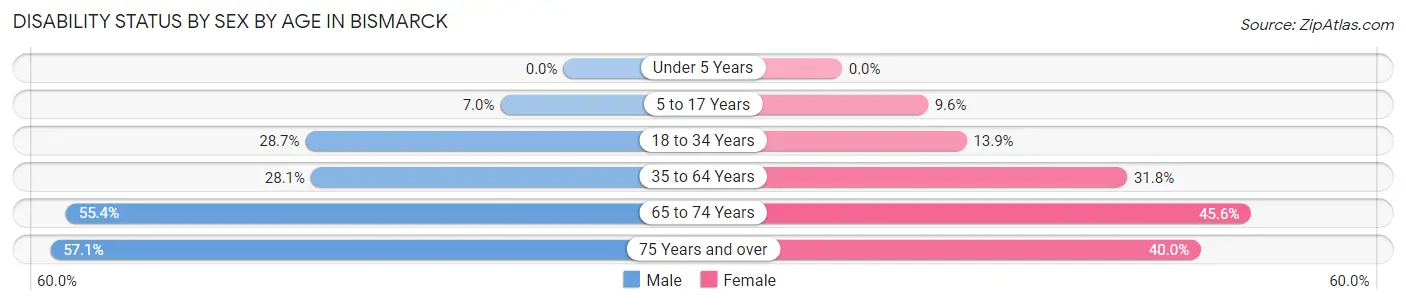
| Age Bracket | Male | Female |
| Under 5 Years | 0 (0.0%) | 0 (0.0%) |
| 5 to 17 Years | 12 (7.0%) | 18 (9.6%) |
| 18 to 34 Years | 25 (28.7%) | 29 (13.9%) |
| 35 to 64 Years | 81 (28.1%) | 101 (31.8%) |
| 65 to 74 Years | 41 (55.4%) | 31 (45.6%) |
| 75 Years and over | 4 (57.1%) | 22 (40.0%) |
Disability Class by Sex by Age in Bismarck
Disability Class: Hearing Difficulty
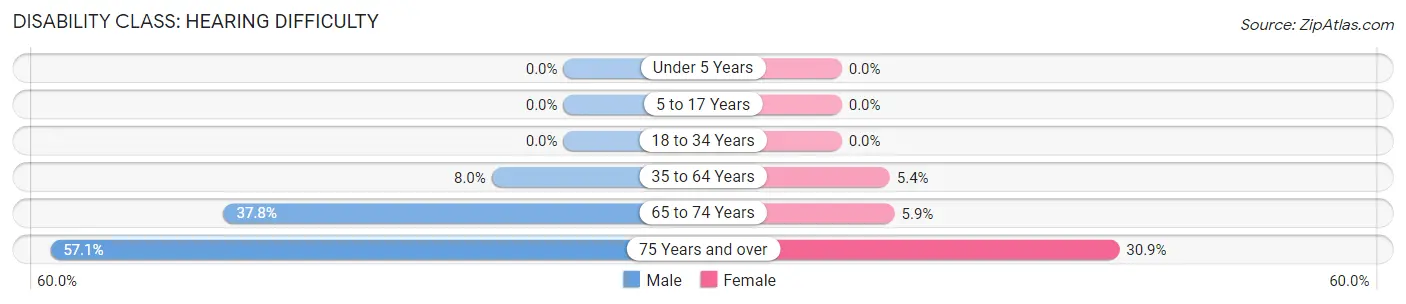
| Age Bracket | Male | Female |
| Under 5 Years | 0 (0.0%) | 0 (0.0%) |
| 5 to 17 Years | 0 (0.0%) | 0 (0.0%) |
| 18 to 34 Years | 0 (0.0%) | 0 (0.0%) |
| 35 to 64 Years | 23 (8.0%) | 17 (5.3%) |
| 65 to 74 Years | 28 (37.8%) | 4 (5.9%) |
| 75 Years and over | 4 (57.1%) | 17 (30.9%) |
Disability Class: Vision Difficulty
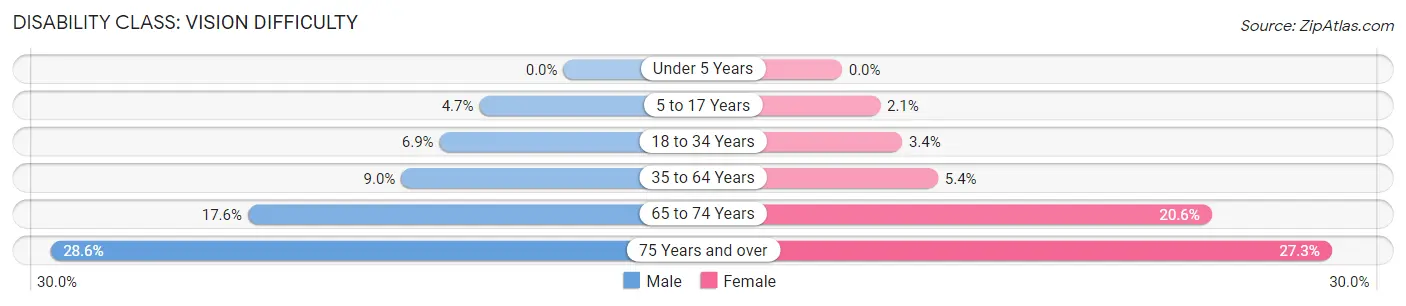
| Age Bracket | Male | Female |
| Under 5 Years | 0 (0.0%) | 0 (0.0%) |
| 5 to 17 Years | 8 (4.7%) | 4 (2.1%) |
| 18 to 34 Years | 6 (6.9%) | 7 (3.4%) |
| 35 to 64 Years | 26 (9.0%) | 17 (5.3%) |
| 65 to 74 Years | 13 (17.6%) | 14 (20.6%) |
| 75 Years and over | 2 (28.6%) | 15 (27.3%) |
Disability Class: Cognitive Difficulty
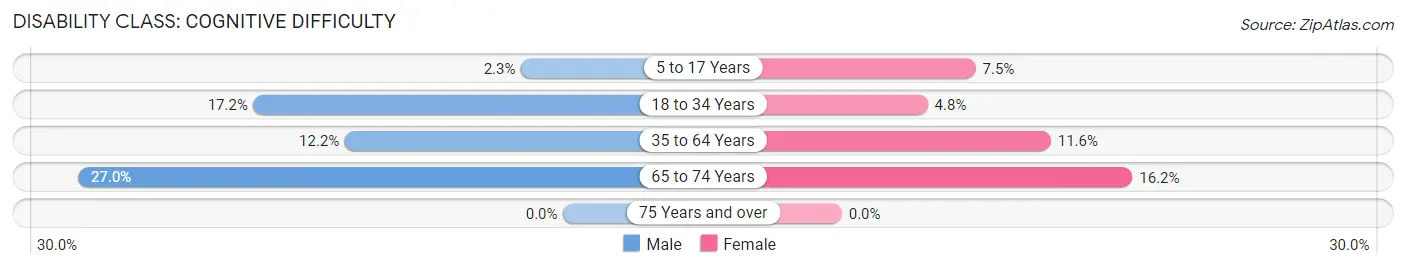
| Age Bracket | Male | Female |
| 5 to 17 Years | 4 (2.3%) | 14 (7.4%) |
| 18 to 34 Years | 15 (17.2%) | 10 (4.8%) |
| 35 to 64 Years | 35 (12.1%) | 37 (11.6%) |
| 65 to 74 Years | 20 (27.0%) | 11 (16.2%) |
| 75 Years and over | 0 (0.0%) | 0 (0.0%) |
Disability Class: Ambulatory Difficulty
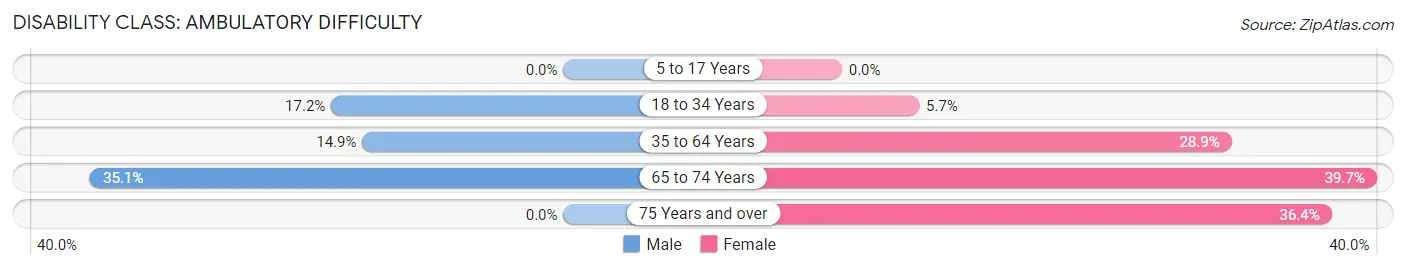
| Age Bracket | Male | Female |
| 5 to 17 Years | 0 (0.0%) | 0 (0.0%) |
| 18 to 34 Years | 15 (17.2%) | 12 (5.7%) |
| 35 to 64 Years | 43 (14.9%) | 92 (28.9%) |
| 65 to 74 Years | 26 (35.1%) | 27 (39.7%) |
| 75 Years and over | 0 (0.0%) | 20 (36.4%) |
Disability Class: Self-Care Difficulty
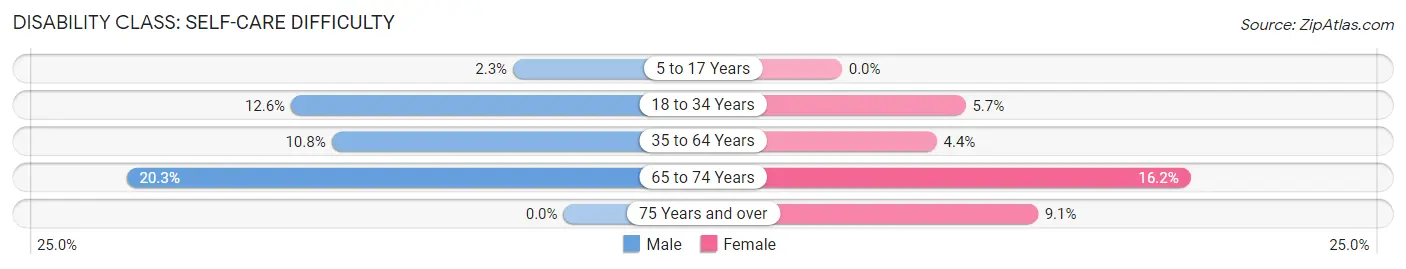
| Age Bracket | Male | Female |
| 5 to 17 Years | 4 (2.3%) | 0 (0.0%) |
| 18 to 34 Years | 11 (12.6%) | 12 (5.7%) |
| 35 to 64 Years | 31 (10.8%) | 14 (4.4%) |
| 65 to 74 Years | 15 (20.3%) | 11 (16.2%) |
| 75 Years and over | 0 (0.0%) | 5 (9.1%) |
Technology Access in Bismarck
Computing Device Access in Bismarck
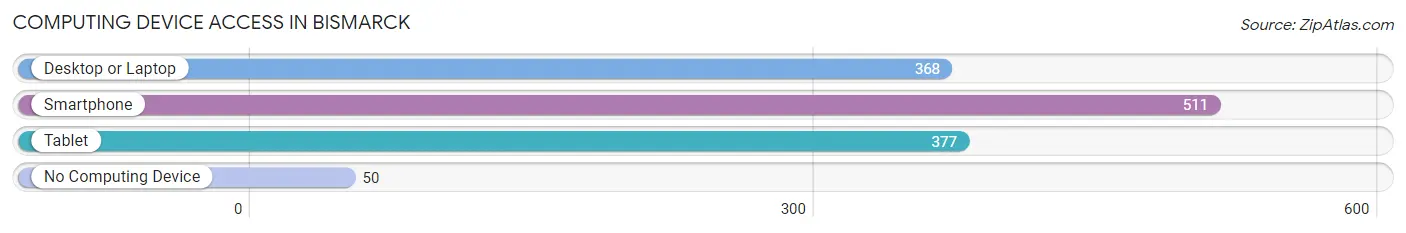
| Device Type | # Households | % Households |
| Desktop or Laptop | 368 | 62.5% |
| Smartphone | 511 | 86.8% |
| Tablet | 377 | 64.0% |
| No Computing Device | 50 | 8.5% |
| Total | 589 | 100.0% |
Internet Access in Bismarck
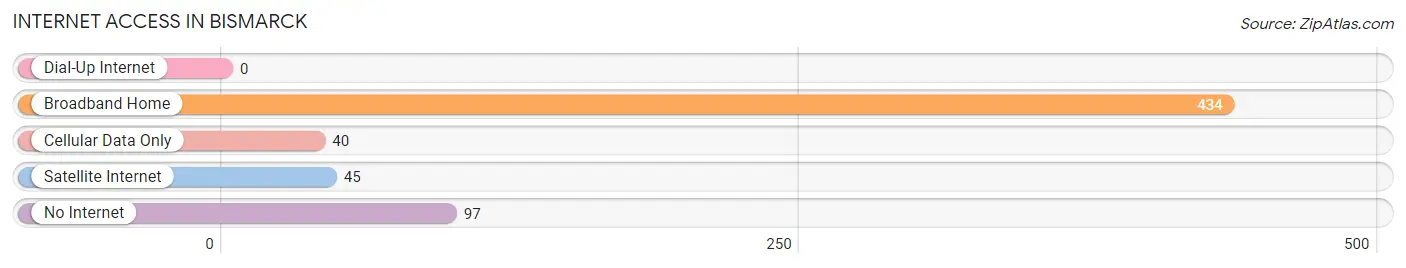
| Internet Type | # Households | % Households |
| Dial-Up Internet | 0 | 0.0% |
| Broadband Home | 434 | 73.7% |
| Cellular Data Only | 40 | 6.8% |
| Satellite Internet | 45 | 7.6% |
| No Internet | 97 | 16.5% |
| Total | 589 | 100.0% |
Bismarck Summary
Bismarck, Missouri is a small town located in St. Francois County in the southeastern part of the state. It is situated on the banks of the Big River, and is surrounded by rolling hills and forests. The town has a population of approximately 1,500 people, and is known for its rural charm and friendly atmosphere.
History
Bismarck was founded in 1819 by a group of settlers from Kentucky. The town was named after the German chancellor Otto von Bismarck, and was originally intended to be a trading post. The town quickly grew, and by the mid-1800s it had become a thriving agricultural center. The town was also home to several businesses, including a sawmill, a gristmill, and a blacksmith shop.
In the late 1800s, the railroad came to Bismarck, and the town began to grow even more. The railroad brought new businesses and industries to the area, and the population of the town increased. By the early 1900s, Bismarck had become a bustling small town with a variety of businesses and services.
Geography
Bismarck is located in the southeastern part of Missouri, in St. Francois County. The town is situated on the banks of the Big River, and is surrounded by rolling hills and forests. The town is located about 50 miles south of St. Louis, and is about an hour and a half drive from the city.
The climate in Bismarck is humid subtropical, with hot, humid summers and mild winters. The average temperature in the summer is around 80 degrees Fahrenheit, and the average temperature in the winter is around 40 degrees Fahrenheit.
Economy
The economy of Bismarck is largely based on agriculture and tourism. The town is home to several farms, and the surrounding area is known for its fertile soil and abundant crops. The town is also home to several small businesses, including restaurants, shops, and other services.
Tourism is also an important part of the economy of Bismarck. The town is home to several attractions, including the Big River State Park, which offers camping, fishing, and other outdoor activities. The town is also home to several historic sites, including the Bismarck Historic District, which is listed on the National Register of Historic Places.
Demographics
As of the 2010 census, the population of Bismarck was 1,500. The racial makeup of the town was 95.3% White, 1.3% African American, 0.7% Native American, 0.3% Asian, and 2.3% from other races. The median household income in Bismarck was $37,500, and the median home value was $90,000.
Bismarck is a small town with a friendly atmosphere and a strong sense of community. The town is home to several churches, and the residents are very active in local events and activities. The town is also home to several schools, including Bismarck High School, which serves the town and the surrounding area.
Common Questions
What is Per Capita Income in Bismarck?
Per Capita income in Bismarck is $18,838.
What is the Median Family Income in Bismarck?
Median Family Income in Bismarck is $58,966.
What is the Median Household income in Bismarck?
Median Household Income in Bismarck is $42,188.
What is Income or Wage Gap in Bismarck?
Income or Wage Gap in Bismarck is 2.6%.
Women in Bismarck earn 97.4 cents for every dollar earned by a man.
What is Family Income Deficit in Bismarck?
Family Income Deficit in Bismarck is $8,676.
Families that are below poverty line in Bismarck earn $8,676 less on average than the poverty threshold level.
What is Inequality or Gini Index in Bismarck?
Inequality or Gini Index in Bismarck is 0.37.
What is the Total Population of Bismarck?
Total Population of Bismarck is 1,617.
What is the Total Male Population of Bismarck?
Total Male Population of Bismarck is 738.
What is the Total Female Population of Bismarck?
Total Female Population of Bismarck is 879.
What is the Ratio of Males per 100 Females in Bismarck?
There are 83.96 Males per 100 Females in Bismarck.
What is the Ratio of Females per 100 Males in Bismarck?
There are 119.11 Females per 100 Males in Bismarck.
What is the Median Population Age in Bismarck?
Median Population Age in Bismarck is 35.1 Years.
What is the Average Family Size in Bismarck
Average Family Size in Bismarck is 3.5 People.
What is the Average Household Size in Bismarck
Average Household Size in Bismarck is 2.7 People.
How Large is the Labor Force in Bismarck?
There are 662 People in the Labor Forcein in Bismarck.
What is the Percentage of People in the Labor Force in Bismarck?
55.5% of People are in the Labor Force in Bismarck.
What is the Unemployment Rate in Bismarck?
Unemployment Rate in Bismarck is 3.9%.