Zip Codes with the Highest Percentage of Population Employed in Security & Protection in Chesterfield, MO
RELATED REPORTS & OPTIONS
Security & Protection
Chesterfield
Compare Zip Codes
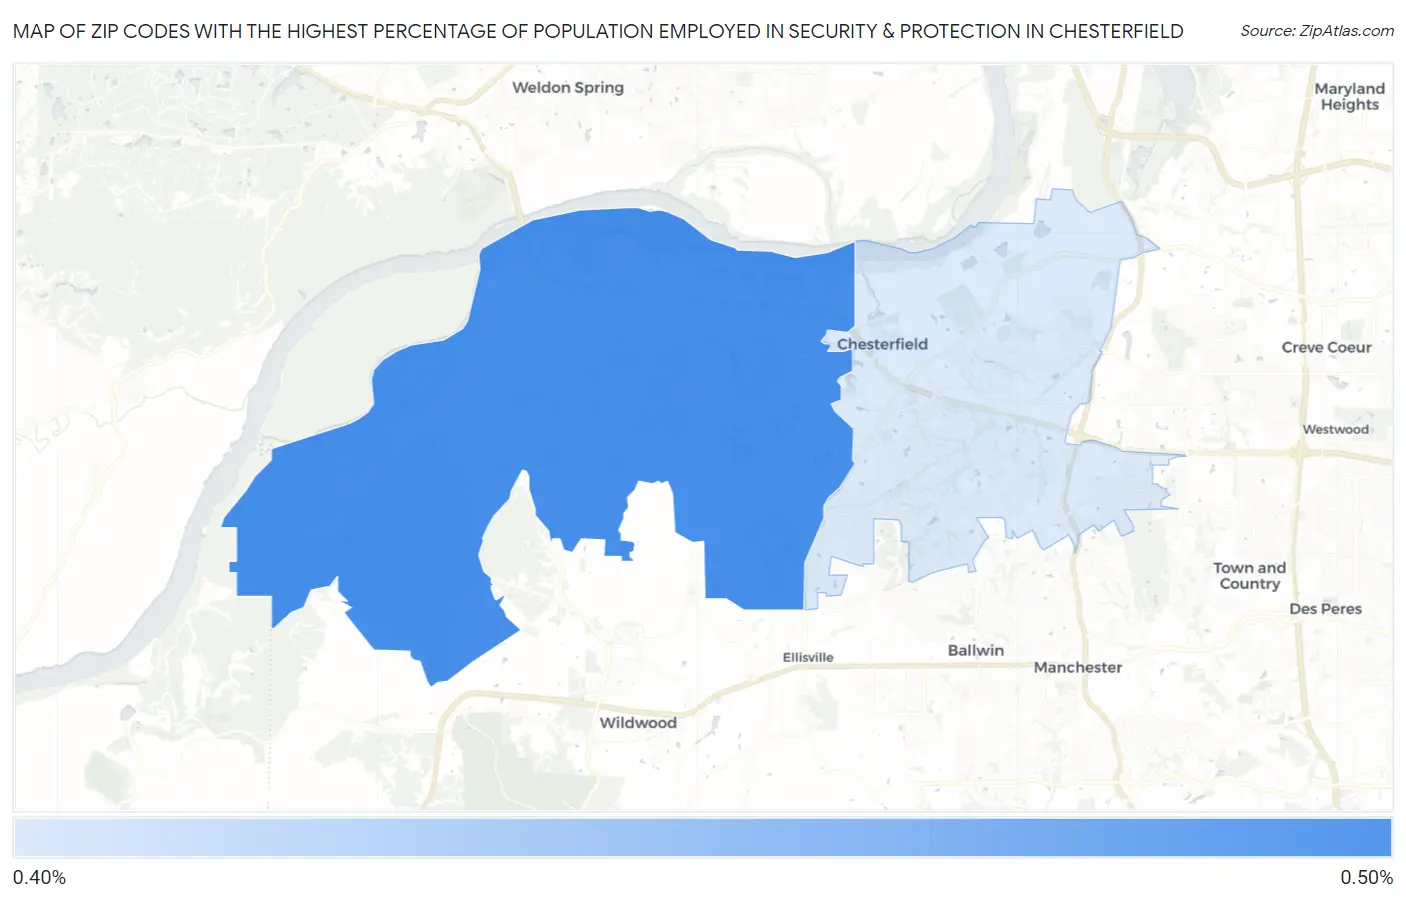
Map of Zip Codes with the Highest Percentage of Population Employed in Security & Protection in Chesterfield
0.48%
0.50%
Zip Codes with the Highest Percentage of Population Employed in Security & Protection in Chesterfield, MO
| Zip Code | % Employed | vs State | vs National | |
| 1. | 63005 | 0.50% | 1.9%(-1.40)#643 | 2.1%(-1.65)#23,255 |
| 2. | 63017 | 0.48% | 1.9%(-1.41)#646 | 2.1%(-1.67)#23,333 |
1
Common Questions
What are the Top Zip Codes with the Highest Percentage of Population Employed in Security & Protection in Chesterfield, MO?
Top Zip Codes with the Highest Percentage of Population Employed in Security & Protection in Chesterfield, MO are:
What zip code has the Highest Percentage of Population Employed in Security & Protection in Chesterfield, MO?
63005 has the Highest Percentage of Population Employed in Security & Protection in Chesterfield, MO with 0.50%.
What is the Percentage of Population Employed in Security & Protection in Chesterfield, MO?
Percentage of Population Employed in Security & Protection in Chesterfield is 0.56%.
What is the Percentage of Population Employed in Security & Protection in Missouri?
Percentage of Population Employed in Security & Protection in Missouri is 1.9%.
What is the Percentage of Population Employed in Security & Protection in the United States?
Percentage of Population Employed in Security & Protection in the United States is 2.1%.